

Diego Thomazini
Just as the S&P 500 ran into some resistance on Tuesday at its 200-day moving average (DMA), we’ve seen the same pattern play out in a number of commodities. Two of the more high-profile ones have been copper and crude oil.
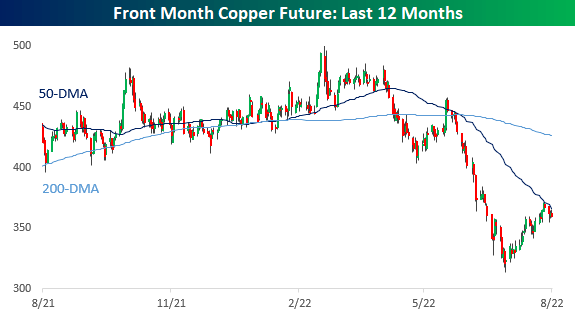
Copper fell out of bed in the late spring and early summer, losing a third of its value. Along with the equity market, copper has seen a late-summer rally, but things came to a screeching halt right at the 50-DMA last Thursday. Copper has been down on two of the last three trading days and hasn’t been able to trade back above that elusive 50-DMA since.
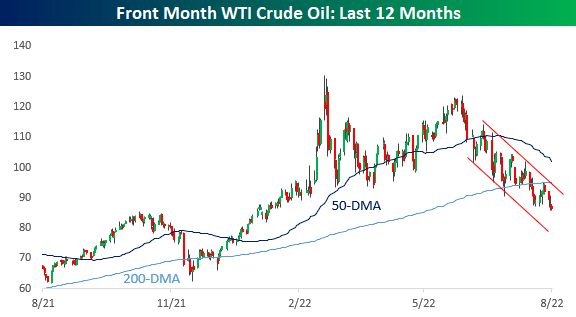
Crude oil has been just as weak as copper lately, trading in a well-defined downtrend and breaking below its 200-DMA in early August. There was a little bit of a bounce last week, but resistance came into play at the 200-DMA, and after making another lower high, it has since made another lower low.
When stock, commodity, bond, or any other asset class is in a well-defined downtrend, the first thing they have to do to break out of their funks is clear resistance at key moving averages like the 50 and/or 200-DMA. In the case of copper and crude, they have both recently come up short. The S&P 500, again, is facing some resistance at its 200-DMA, but at least it has managed to clear its 50-DMA which it did in the second half of July.
Editor’s Note: The summary bullets for this article were chosen by Seeking Alpha editors.
Be the first to comment