

Kativ/E+ via Getty Images
The economy and the stock market appear on edge with high inflation, an ongoing war in Ukraine, and with the recent inversion of the yield curve. This article will analyze the various economic conditions along with a technical perspective to see where the stock market is likely to go for the remainder of 2022.
Inflation as measured by the Consumer Price Index increased 7.9% in February 2022 over February 2021. This marks the highest inflation rate in 40 years. Consumers are paying more for gasoline, food, vehicles, and many other products/services.
The war in Ukraine is still ongoing with no resolution in sight, which could cause supply disruptions for aluminum, platinum, steel, and sunflower oil. This could lead to further supply disruptions for products such as vehicles and semiconductors.
The yield curve recently inverted as the 2-year treasury yield briefly traded higher than the 10-year yield. This typically happens about a year or two before a recession kicks in.
I will analyze various economic metrics and provide a technical perspective to see how the remainder of 2022 may go.
What’s The Deal With Inflation?
Yes, consumers are paying a lot more for most goods and services these days. However, they are also getting paid more. Average hourly earnings increased 5.6% in March 2022 as compared to March 2021. Granted, the earnings increases are lower than the inflation rate of 7.9%. However, this situation is much better than if earnings didn’t increase at all. Many consumers find a way to make extra money whether through second jobs or the gig economy – feasible opportunities do exist. Other consumers and those on fixed incomes may not be able to have that flexibility and feel a larger pinch of high inflation.
The Federal Reserve started a new interest rate increase cycle in March when the rate was increased by 0.25%. The Fed has plans for about 6 more increases in 2022 to combat inflation. While interest rate increases can lower inflation, it can lead to a recession when interest rates get to a level where lending slows down significantly. It may take a while for this to occur, but investors should keep an eye on how the economy responds as interest rates continue to increase.
The first series of interest rate increases may keep a lid on inflation while allowing the economy to continue to grow. Rates are not likely to get too high all at once.
Yield Curve Inversion
There has been a lot of hype in the news about the 2-year treasury yield briefly trading higher than the 10-year yield. This typically happens approximately 18.6 months on average before recessions occur. So, this indicator is not likely flashing a warning sign for a recession in 2022. It will probably take more time for a series of interest rate hikes to slow down the economy to the point of having a recession. The 2-year vs. the 10-year indicator worked to predict 7 of the last 8 recessions.
The better indicator to watch for in my opinion is the 3-month treasury yield vs. the 10-year yield. The occurrence of the 3-month yield exceeding the 10-year yield took place before 8 out of the last 8 recessions. This indicator occurs 17.3 months on average before a recession. The 3-month treasury yield did not yet exceed the yield of the 10-year treasury. This is an indicator to monitor as the Fed continues to raise rates.
Where We Are in the Economic Cycle
EconPi.com
The chart above shows that the economy (green dot) is sitting on the border of the economic expansion quad and the declining quad. Actual recessions take place in the contraction quad, which occurred in Q1 2020 as many businesses shut down during the COVID pandemic.
The likely scenario going forward is that as interest rates increase, the economy will probably move into the declining quad. Higher interest rates are likely to lead to a slowdown in mortgage originations as the rates get less attractive. It will be important to monitor mortgage sales, new housing starts and sales of existing homes to gauge how the economy is trending. Housing is a large purchase which leads to other large purchases such as remodeling, appliances, furniture, etc. Therefore, housing is a good economic indicator for the overall economy.
The last new residential construction report showed a 14% year-over-year gain for February 2022 over February 2021 for new housing starts. However, existing home sales experienced a 2.4% decline in February 2022 over February 2021. It will be important to monitor the trend in the months ahead. The data for March will be reported on April 19 for new residential construction and April 20 for existing home sales. This will show how home buyers are reacting to increases in interest rates.
If we start seeing double-digit percentage declines for new housing starts and existing home sales, then a possible recession could be closer. Affordability might be an issue for many buyers as interest rates increase. I doubt that cash buyers will be able to support the housing market since they only represent about 25% of existing home sales. So, buyers that can afford mortgages at higher rates going forward will be important for the health of the housing market.
Manufacturing And Other Data
The latest ISM manufacturing report for March 2022 marked the 22nd consecutive month for growth. The March manufacturing PMI came in at 57.1 which was lower than February 2022’s figure of 58.6 and the lowest since September 2020. The March report reflected a demand-driven, but supply constrained market. Five out of the six largest manufacturing industries (Food & Beverage, Machinery, Transportation Equipment, Chemical Products, and Computer & Electronics) experienced growth in March.
ismworld.org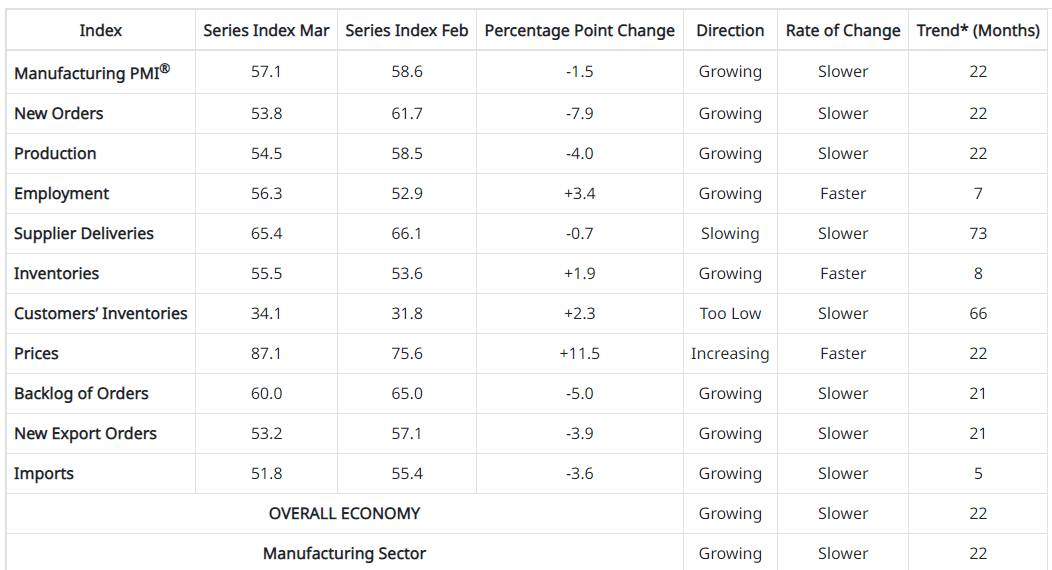
So far, the manufacturing sector has been increasing as the PMI remains above 50. Readings below 50 would indicate a contraction in manufacturing. Inventories are too low, which reflects the supply chain issues over the past couple of years.
It will be important to keep an eye on how the supply/demand dynamic changes in the coming months as interest rates increase. The costs of financing will become more expensive, so declines in demand are possible. The supply situation may improve as the year progresses as businesses return to optimal staffing levels.
The non-manufacturing report showed a Services PMI at 58.3%. This was higher than February’s Services PMI of 56.5%. However, the March percentage was lower than the 12-month average of 62.3%. The good news is that the services sector grew for 22 consecutive months. Readings above 50% indicate an expanding services sector, while readings below 50% indicate contraction.
prnewswire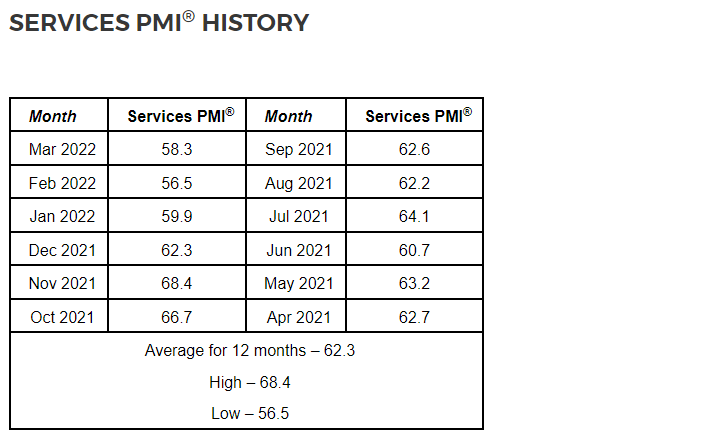
We should keep an eye on the trends in manufacturing and services going forward to see if it dips below 50% as the Fed continues to respond to inflation.
The Market’s Technical Outlook
S&P 500 (SPY) Weekly Chart (stockcharts.com)
The weekly chart of the S&P 500 (SPY) above is showing some conflicting indicators. The overall price appeared to be recovering from the recent market correction. However, the market took a dip last week. This led to the RSI curving back downward. The green MACD line looks like it is about to cross above the red signal line, which would indicate that the trend has flipped from negative to positive.
The bad news is that the money flow [CMF] has been declining since August 2021. This shows that money has been coming out of the market. Large investors have probably been taking profits when the market was overbought.
S&P 500 (SPY) Monthly Chart (tradingview.com)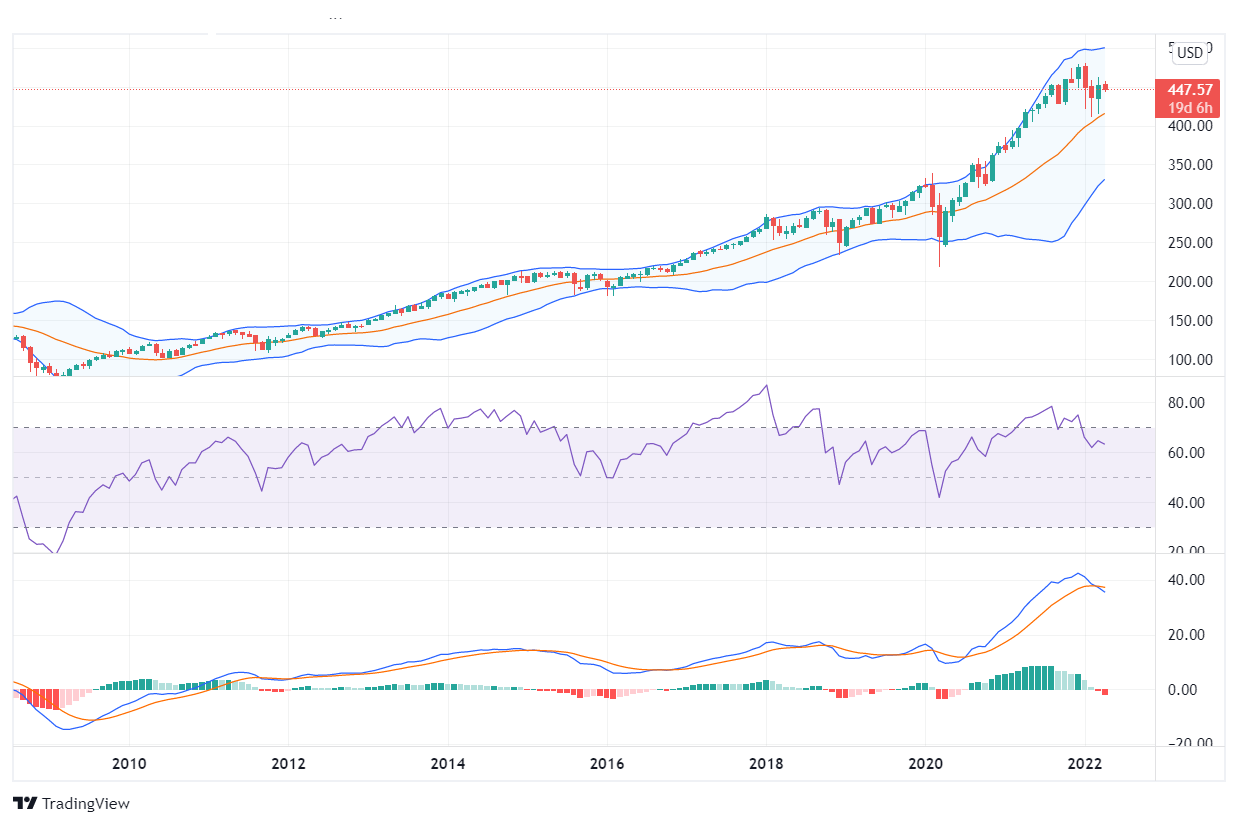
If we zoom further out and look at the S&P 500’s monthly chart, we have a more bearish perspective. SPY’s price and the RSI are showing a bearish divergence (price increased, while the RSI declined) from August 2021 to December 2021. Then we had the market correction in 2022. The blue MACD line recently crossed below the orange signal line. This indicates that the trend changed to bearish and further declines could take place in the months ahead.
We’ll have to keep an eye on various time frame perspectives to see if the trend stays on track or if it changes.
The Market’s Valuation
The S&P 500 currently has a trailing PE of 21.9 and a forward PE of 20. This is above the long-term average PE ratio of 13 to 15. So, the market has been in an overvalued condition.
currentmarketvaluation.com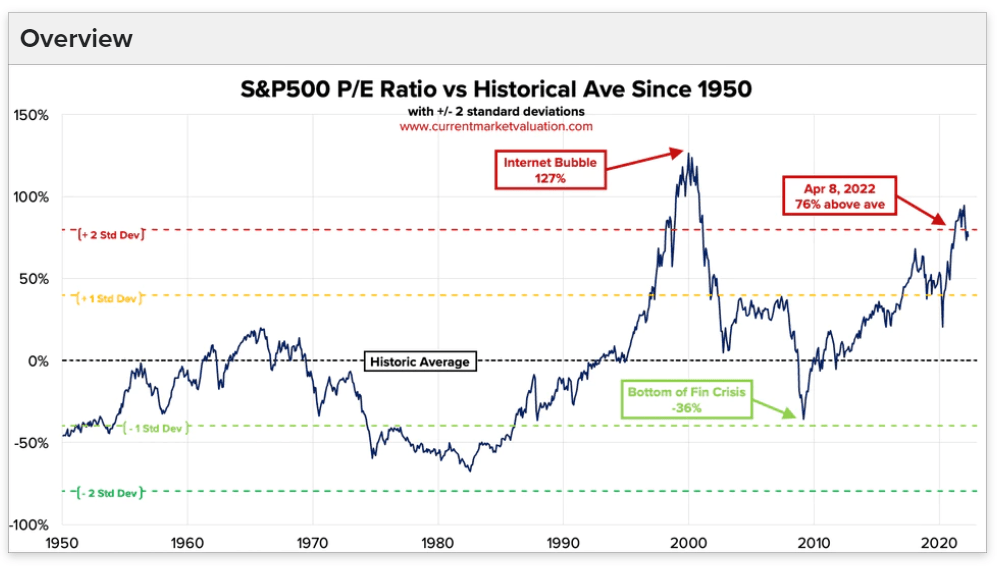
The chart above shows how the market’s current PE ratio increased 76% above the historic average. However, it is still not near the level that was reached at the peak of the internet bubble of 127% above the historical average. Given all of the other factors (high inflation, increasing interest rates, etc.), it looks like there is more downside than upside for the PE ratio and market prices. There would have to be a significant rise in earnings for the PE to drop while market prices continued to increase.
Outlook For The Remainder Of 2022
We know that the Federal Reserve is likely to raise interest rates to combat inflation this year. While that may keep a lid on rising prices, it will also make borrowing (financing) more expensive as mortgages and other loans experience higher rates. This typically results in a recession once rates get to the point of slowing down economic activity. Less demand for mortgages and other loans is possible as consumers and businesses may postpone purchases as affordability becomes an issue.
What may happen in the next few months is a possible surge in mortgages and other loans as consumers and businesses might panic buy/invest before knowing that rates are likely to be even higher later in the year.
If the upcoming earnings season in the second half of April turns positive, it could lead to a market rally. This would be the most likely near-term positive catalyst.
We will probably see a ‘sell the news, buy the rumor’ type of action for the stock market for the rest of 2022. What I mean by that is that the market tends to sell off when the Fed talks about raising interest rates. We saw this when the market sold off in the beginning of this year when the Fed talked about raising interest rates to fight inflation. Then, the market rallied when the actual rate was announced at the March meeting.
We also saw that scenario this past week when the Fed indicated that it wishes to raise rates by a half percentage point and the market sold off. When the actual meeting comes, investors already expect a half point raise. So, if that happens, the market will probably rally as the negative news was already baked in. If they raise by 3 quarters of a percentage point, then it would be unexpected and the market would likely sell off.
Overall, the evidence suggests that we could see further economic growth in the 1st half of the year before interest rates get too high. Then, the growth could slow as rates make loans less attractive and unaffordable to many potential borrowers. A possible recession would most likely take place in 2023 or late 2022 at the earliest.
As for the stock market, we will probably experience a lot of volatility with a bias to the downside around what the Fed says & what they do and around earnings seasons. I’ll provide updates as needed. Please discuss your thoughts in the comment section below.
Be the first to comment