

pick-uppath
Dilution… just that word alone should strike fear into the marrow of equity investors bones. The idea of your piece of the pie continually shrinking each and every quarter into oblivion is not a pleasant, or profitable idea to comprehend.
The core reason for the peaked interest in the subject of stock-based compensation is simple, large SBC numbers, on the surface, are looked at as a precursor to massive shareholder dilution ahead. In my prior article on the subject of SBC expenses, I presented a list of the worst SBC offenders in stocks that I follow, along with a few of the best. In this article, I would like to revisit that list and delve into the actual and potential future dilution numbers in these names.
What is stock based compensation?
To go through a bit of a refresher from my prior article, the very basic definition of stock-based compensation is that it is a non-cash way of paying employees by way of issuing stock options as part of an overall compensation package.
Theoretically, stock options and restricted stock awards create an alignment with shareholders who have a financial interest in seeing the company prosper. Stock options have a vesting period before shares can be earned and thus sold, also creating an incentive for talented employees and executives to stay with the company for a given period.
Stock-based compensation is not a new phenomenon and is used in virtually all industries and by nearly all public companies. Historically, SBC has been a very valuable tool for retention and alignment of key executives.
In the last decade, given the historically low interest rates in the United States and the avalanche of venture funds flowing into the stock market, SBC levels have been on a meteoric rise, beginning around 2013, particularly in the software and technology sector.
Alliance Bernstein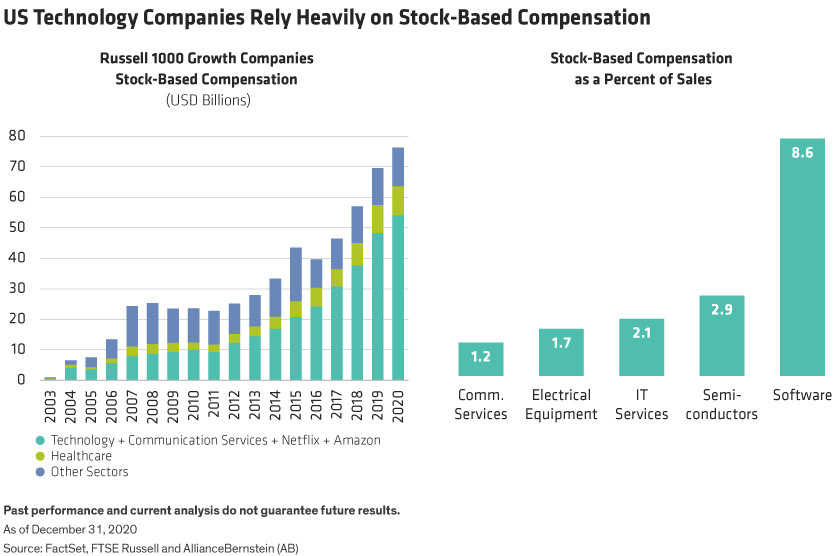
In my last article, the comments section, per usual, was incredibly helpful in putting some context into a simple blanket SBC screen. A few very knowledgeable Seeking Alpha users who are CPA’s and former CFO’s commented that many of the SBC expense numbers are unlikely to ever be recognized in the form of dilution given the variable options prices at which SBC is issued.
For example, if 1,000,000 options were issued in Matterport (MTTR) at the all-time high price of $27.86, this would lead to a SBC expense of $27,860,000. However, in order for these shares to ever be issued or to be dilutive, the stock would need to rally 895% from the current $3.11 levels. Now, I am certainly not Nostradamus, but I do not see that happening anytime in the near future.
In contrast, restricted stock units to founders and key executives are extremely likely to be dilutive and for recently public companies, they are unlikely to be included in reported SBC costs if these agreements were potentially reached before a company was a public entity. The underlying consensus was that SBC numbers lacked any form of context and therefore were nearly useless.
I can certainly see their points on this issue and there appears to be no good answer as to precisely how to value SBC expenses and the potential dilution ahead, so I decided to try to create some form of context around my list of what I consider egregious levels of SBC. I came away with some surprising results.
In the below table, I used Seeking Alpha data to compile the total SBC figures for the trailing 12 months or “TTM” for short, the percentage of SBC to TTM revenue and total dilution over the past 12 months. I am also attempting to compile the total number of option awards and restricted stock units outstanding and creating a potential future dilution percentage based on these numbers.
Worst Offenders of SBC
| Name | SBC (TTM) | % of TTM Revenue | Last Reported Shares Outstanding | Year Ago Shares Outstanding | TTM Dilution % | Total Option And RSU Shares Outstanding | Potential Future Dilution % |
| Matterport (MTTR) | $183.5M | 151.7% | 286.5M | 196.5M | 45.8% | 65.1M | 22.7% |
| C3.ai (AI) | $179.6M | 66.5% | 108.9M | 103.7M | 5.1% | 53.7M | 49.3% |
| Robinhood Markets (HOOD) | $811.4M | 60.5% | 882.4M | 638.2M | 38.3% | 164.7M | 18.7% |
| Snowflake Inc. (SNOW) | $756.5M | 40.6% | 320.1M | 303M | 5.6% | 170.4M | 53.2% |
| SentinelOne, Inc. (S) | $144M | 39.8% | 280.6M | 263M | 6.7% | 47.2M | 16.8% |
| The Trade Desk (TTD) | $576.5M | 38.8% | 488M | 478.1M | 2.1% | 24.6M | 5.1% |
| Okta, Inc. (OKTA) | $669.6M | 38.6% | 158.7M | 153.8M | 3.2% | 64.7M | 40.7% |
| Unity Software (U) | $474M | 37.7% | 299.1M | 283.7M | 5.4% | 56.8M | 19% |
| Asana, Inc. (ASAN) | $178.1M | 35% | 204.7M | 185M | 10.6% | 24.5M | 12% |
| Zscaler (ZS) | $424.8M | 34.9% | 143.5M | 139.3M | 3% | 17.6M | 12.3% |
| UiPath (PATH) | $347.8M | 33.4% | 550.2M | 531.7M | 3.5% | 53.5M | 9.7% |
| Palantir Technologies (PLTR) | $602M | 32.8% | 2,073.3M | 1,964.4M | 5.5% | 472.3M | 22.8% |
| Bill.com (BILL) | $231.9M | 30.7% | 105.1M | 95.9M | 9.6% | 21.1M | 20.1% |
| MongoDB (MDB) | $353.1M | 29.6% | 68.9M | 66.4M | 3.8% | 11.5M | 16.7% |
| Alteryx (AYX) | $202.9M | 27.8% | 68.7M | 67.3M | 2.1% | 17.6M | 25.6% |
Source: Author created with Seeking Alpha data
Before I summarize my thoughts, I must mention and disclose that finding the total options and RSU units outstanding for issuance in the SEC filings was truly a pain in the behind. Each company’s 10-Q is formatted differently and some companies are much more transparent on the amount of shares that may potentially be issued under compensation plans, leading to perhaps inaccurate results, with greater transparency potentially punished. I want to be clear; I made a concerted effort to find the correct information on the above companies, but I can in no way guarantee that this is accurate given the above difficulties.
Now, in the above table, a few things stick out to me. First, the top 4 on this list, Matterport, C3.ai, Robinhood Markets and Snowflake appear to wholeheartedly deserve their ranking in my previous article. To be clear, not all of the dilution over the last 12 months at these firms was likely due to SBC, however it is clear that all four, using these metrics, appear ready and willing to dilute shareholders significantly into the future. While both C3.ai and Snowflake have kept dilution limited over the last 12 months, the future dilution potential appears to be massive, albeit likely dependent on share price appreciation.
Second, I was very surprised to see that The Trade Desk, Zscaler and UiPath may have future dilution significantly more under control than my initial SBC screen indicated.
Now, creating this table was useful, however I am curious to see the results from my “not so bad” list in my prior article as a comparison.
The Not So Bad List
| Name | SBC (TTM) | % of TTM Revenue | Last Reported Shares Outstanding | Year Ago Shares Outstanding | TTM Dilution % | Total Option And RSU Shares Outstanding | Potential Future Dilution % |
| Digital Turbine (APPS) | $21.7M | 2.8% | 98.9M | 96.2M | 2.8% | 8.1M | 8.2% |
| Paycom Software (PAYC) | $92M | 7.1% | 57.9M | 57.9M | 0% | 2.1M | 3.6% |
| PubMatic, Inc. (PUBM) | $18.8M | 7.3% | 52.4M | 50.6M | 3.6% | 8.2M | 15.6% |
| PTC Inc. (PTC) | $174.9M | 9% | 117.4M | 117.2M | 0.1% | 2.8M | 2.4% |
| Dynatrace, Inc. (DT) | $121.4M | 11.9% | 287.2M | 283.9M | 1.2% | 6.4M | 2.2% |
| nCino, Inc. (NCNO) | $46.4M | 12.4% | 110.9M | 96.4M | 15% | 25.1M | 22.6% |
| Autodesk, Inc. (ADSK) | $638M | 13% | 216M | 220M | -1.9% | 22M | 10.2% |
| Veeva Systems Inc. (VEEV) | $318.1M | 15.3% | 155.4M | 153.5M | 1.2% | 15.3M | 9.8% |
| Elastic N.V. (ESTC) | $175.2M | 17.9% | 95.3M | 92.2M | 3.4% | 9.3M | 9.8% |
| Datadog, Inc. (DDOG) | $307M | 19.9% | 316M | 310.2M | 1.9% | 30.8M | 9.7% |
Source: Author created with Seeking Alpha data
Before I delve into this table, I want to emphasize again the disclaimer from the first table, I made a concerted effort to find the correct information on the above companies, but I can in no way guarantee that this is accurate given the difficulties in obtaining clear option and RSU outstanding data.
I, frankly, was pleasantly surprised to see that this table, for the most part, held up quite well. The only notable deviations here appear to be PubMatic and nCino, with nCino’s numbers being highly disappointing to me in both TTM dilution and future potential dilution, however, the remainder of this list appears to be quite reasonable and largely in line with my prior SBC screen.
Bottom Line
This article; and the gathering of data it required to simply screen 25 companies, took much longer than I anticipated and frankly, it was exhausting. This process highlighted a major pet peeve of mine regarding information transparency. SEC forms are simply brutal to navigate and places an individual investor at a distinct disadvantage to institutions that have programs to track and organize all the data that an SEC form holds.
It is clear to me after creating both of these tables that SBC, in a vacuum, certainly does not tell the full story, however, these updated tables certainly do not either. Potential future dilution is just that, potential. In many cases, share prices would need to rocket significantly higher for the full amount of this potential dilution in my worst offenders list to in fact be realized. This fact, at least to me, does not give me great comfort.
I will say that it does appear by using an SBC screen, it may at least point you in the right direction to future dilution given the TTM dilution and future potential dilution correlation between the two lists lending to a proclivity of firms with liberal SBC policies appearing to be the most dilutive. All of this with admittedly a very small sample size.
Clearly, using a longer dilution timeline would generate better data, however, with most of these company’s going public within the last few years, data is quite limited and potentially skewed.
Using this screen, or these numbers, should not be a primary factor in any investment. The variables involved in how many dilutive shares are ever actually issued are complex and numerous. The way I plan to look at this metric going forward is that SBC expense figures represent alarm bells that require in-depth investigations on a company-by-company basis to discover the larger picture.
Thank you for reading and I look forward to your comments below. Good luck to all!
Be the first to comment