

DNY59
How Am I Doing So Far?
In June 2022, I published an article titled “Welcome To A Bear Market – Expect Another 10% Down“, which implied a target of 3400 on the S&P 500 (SP500) (SPY). Looking at the comments section of that article, there was a fairly even 3-way split between those who agreed with my target, those who thought the market bottomed already in June, and those who thought a much lower bottom was possible.
So far, the only group that can be proved wrong is the quick correction group, as the S&P went on to bottom at 3577 on 10/12/22. My 3400 target has not been hit yet, but it appears I need to update it to be more in line with the big bear group. Since June, we have seen about a 10% degradation in the S&P 500 as reported earnings estimate, from $200 down to $181 presently. (A reminder – I use as reported earnings, while many analysts use the higher operating earnings estimate.) Additionally, the 10-year Treasury rate is higher than it was in June, even after its more recent decline. The resulting fair value estimate from my simple earnings model is 2935. See the June article for more details about the model.
Author Spreadsheet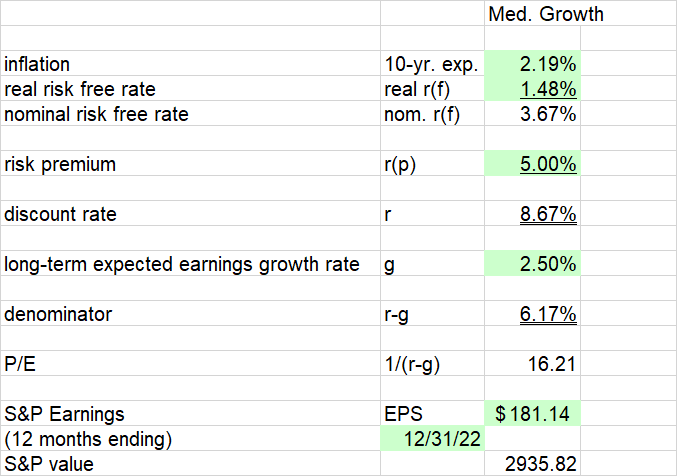
Another rationale for more pain ahead comes from looking at historic bear market patterns. As I mentioned in June, there have been two kinds of bear markets in the last 50 years: those that last a few months and lose around 20%, and those that are longer and deeper. With the low in October, the current bear is now longer than any correction-type bear market. The 25.4% decline to that point is also more than any correction-type bear, except for the 1987 and 2020 crashes.
Looking at the longer bear markets, we see that one year in, most were down around 20%. Three out of four of these suffered steep declines after this point before the bear was finally over.
Author Spreadsheet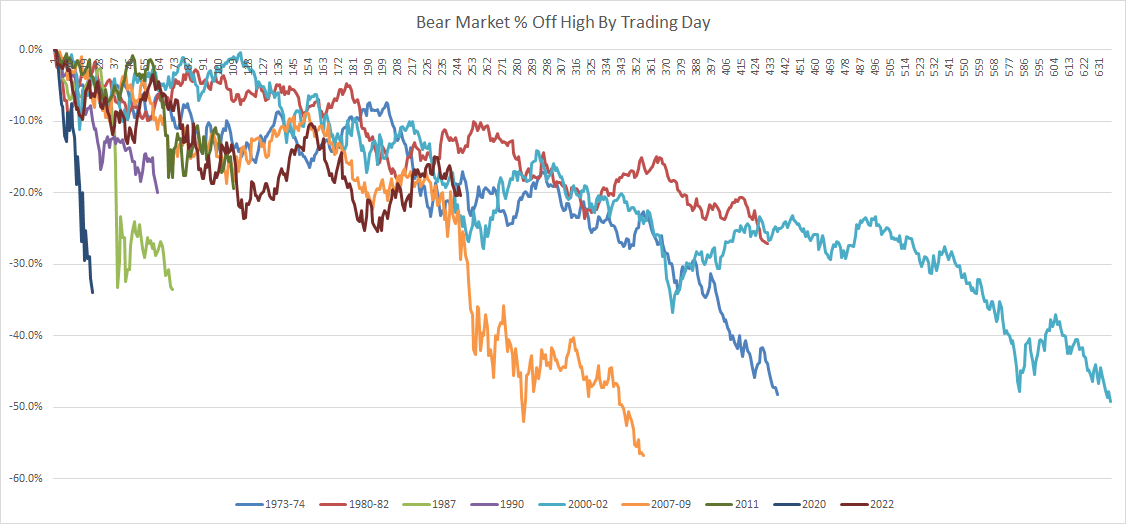
In all three of these cases, there was a “black swan” event that one could blame for the final capitulation. In 1973-74 it was Watergate, in 2000-02 it was the run-up to the Iraq war, and in 2007-09 it was the Lehman bankruptcy. Black swans are by definition impossible to predict. Nevertheless, maybe something Russia or covid-related happens next year. Maybe not – it could be something else entirely, or just Mr. Market throwing a tantrum over the final rate hike.
My 2935 estimate would be a decline of 39% from the all-time high reached at the start of 2022. This is less than the three black swan bear market endings, but still more than any short correction.
Don’t Fight The Fed, They May Join Your Side Soon
The latest projection from the Federal Reserve predicts a Fed Funds rate in the 5.00% – 5.25% range at the end of 2023. 10 FOMC members predicted this range, 7 predicted higher rates, and 2 predicted 25 basis points lower. The market, as represented by the CME Fed Watch tool, sees the most probable Fed Funds rate in the 4.75% – 5.00% range starting in May 2023 and remaining there for 6 months before declining 25 basis points in November. The tool shows almost a 50/50 chance of one more 25 bp rate cut in December 2023.
CME Fed Watch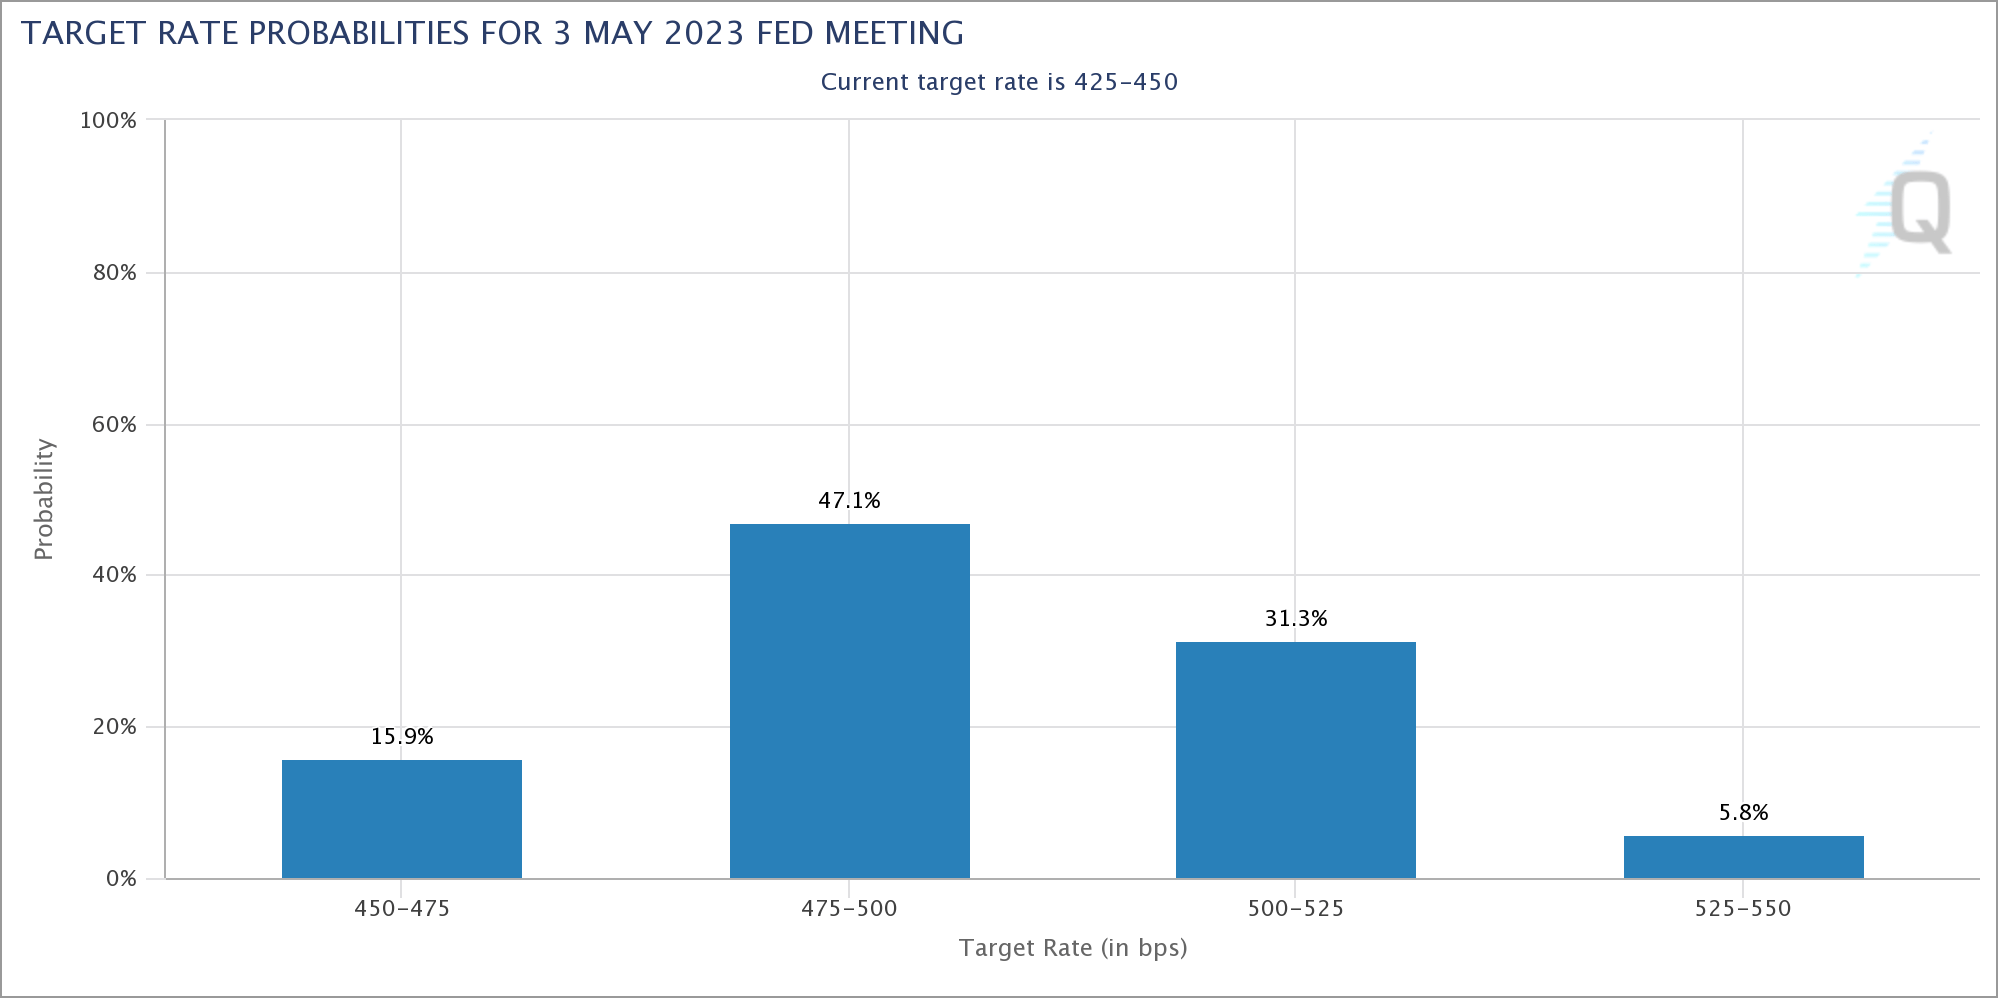
I see a good chance of the market bottoming in the second quarter as it becomes clear the Fed is sticking to their plan. After that, there could be some relief once the Fed leaves rates unchanged at one meeting. Later in the year, we should see even more relief if the Fed changes their tune and starts guiding toward rate cuts coming soon. This is not out of the question if we see my expected market tantrum combined with further signs of easing inflation, which are already showing up in commodities and housing, not to mention the financial asset price deflation we have already had this year.
My Year-End 2023 Target: 3940
Let me first say I agree with Jim Sloan, who noted that “Annual Forecasts Are Usually Worthless“. Risks of black swan events like those mentioned above could derail a forecast. On the other hand, the elusive soft landing could still be achieved, and maybe the bottom was reached in October 2022. Or, my fundamental assumptions could be perfect, but my timing could be off. Mr. Market works on his own time scale unrelated to the calendar year. Just a few months off in either direction could result in a different year-end result.
Still, annual forecasts are popular this time of year, and they provide a base to start from when thinking about what could go differently. Going back to my simple valuation model, I only have to guess the earnings level and risk-free interest rate. For the earnings number, I will go with $203.75 as reported, which is the bottom-up estimate for 2023 from S&P analyst Howard Silverblatt. (The spreadsheet with this data is found on the S&P website.) One thing that may surprise you is that it’s higher than the 2022 estimate. If you look at the quarterly numbers, we see that the as reported earnings bottomed in 2Q 2022 if future estimates are correct. Again, these are bottom-up numbers looking at all the individual companies in the index, not some top-down macro forecast. Maybe the GDP numbers really did tell us we had a recession in the first half of 2022 and are now in recovery with the positive 3Q result. Still, it may take some time for the market to believe this, which is why I think the dump to 2935 is still possible in the first half of the year.
For the risk-free rate, I am assuming a 100 basis point decline in the 10-year Treasury from current levels, or 2.67% at the end of 2023. This is not out of line with historical rate cycles, where the 10-year peaks ahead of the Fed Funds rate. This rate corresponds to a fair P/E of 19.3 based on my valuation model. Plugging these numbers in, I get a fair value estimate of 3941 at the end of 2023, which I will round to 3940.
Author Spreadsheet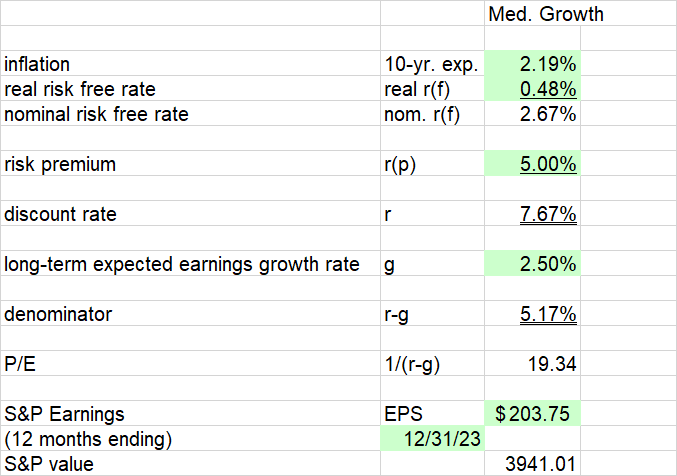
This forecast is a 2.7% increase from current levels, and a 34% increase from the possible bottom estimate of 2935.
Conclusion
The market has gone mostly sideways since my June article, with a couple up and down cycles within the larger trend. This is as I predicted and in line with the second six months of many historical long bear markets. We are now close to that inflection point where a big leg lower has happened in the past. As a long-term investor, I am not making huge timing moves, although I did recently sell about 7% of my portfolio to fund a real estate deal. I plan to cover about 2/3 of this when I sell my existing residence. Given the housing market, if my forecast is right, I should be able to buy stocks back lower in a couple of months.
One warning about the end of long bear markets is that there are few places to hide during the final capitulation. Even the value names that have held up well will probably go down. While I am personally ahead of the S&P by almost 12 percentage points this year thanks to my value focus, the next few months could finally be time to deploy cash into growth stocks. What goes down the most usually bounces the most. As with all market forecasts, the hard part is the timing.
Be the first to comment