

buzbuzzer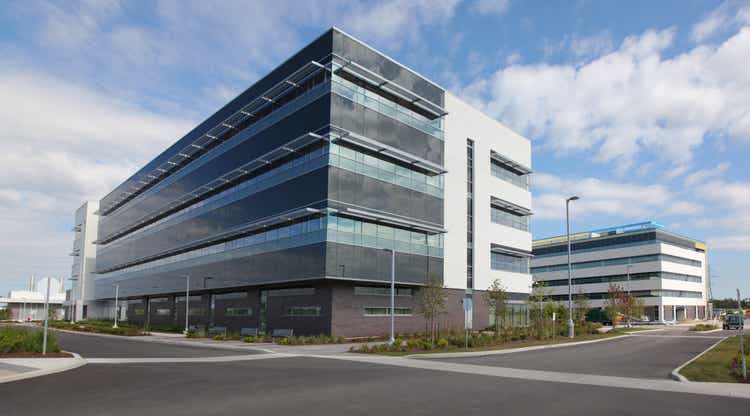
The pandemic propelled a work from home trend that drastically impacted investors’ opinions about office real estate. Weak sentiment and the recent rise in interest rates have caused public traded REIT valuations to plummet to panic levels.
The reaction within public markets to the changing office dynamics feels somewhat unfounded. Many companies have indicated that offices will continue to play an important role in their business. Corporations across several industries have instituted hybrid work or return to office policies that likely result in continued demand for office space. This is particularly true within specific geographies around the U.S.
The push behind returning to offices is likely the result of a desire to monitor worker productivity, help new and young employees acclimate to the firm, and improve intra-team relationships.
The business-friendly U.S. sunbelt region is seeing many businesses and people relocating to the area, leading to attractive office market supply/demand dynamics. Low taxes and cost of living are causing migration to the area, which is driving employment demand. Unlike many coastal cities, many of the major metropolitan areas within the U.S. south are significantly less developed than gateway markets such as New York and San Francisco. The recent rise in interest rates is also potentially crowding out new developments that may have gotten the green light in a low rate environment, potentially constraining the supply of new offices. These dynamics should leave room for office rents and occupancy levels to remain at stable levels of not improving levels as the world deals with an evolving work environment.
Overall, while equity markets remain in turmoil, the beating office REIT stocks have taken year-to-date has created a highly attractive opportunity for stock picking within the sector.
Highwoods Properties (NYSE:HIW) is highly attractive after falling over 40% year-to-date. Most of the movement in the stock is the result of changes in interest rates, not a deterioration in the company’s fundamentals. In fact, the company has had some of the best financial performance of any office REIT since the pandemic started.
Given that the stock is now trading at a P/FFO, implied cap rate, and dividend yield not been seen since the financial crisis of ’08 (yes, the stock is now cheaper than it was during the March 2020 sell off). It’s hard for us to imagine the stock going much lower from here.
We believe the downside (unless there’s a full-blown ’08-like crater) is ~$21, which represents a 10.3% cap rate on a stressed NOI number. Inclusive of $2.04 in dividends, our 12-month total return downside is ~13% from recent levels.
At a more normalized 8.2% cap rate, the stock price would be ~$38. Including dividends, that’s up ~50% over the next 12 months. That represents a risk-to-reward ratio of ~4x.
HIW’s management seems to agree with us that the stock has become too cheap. The CEO, CFO, and General Counsel acquired almost $200k worth of stock at the end of September.
Thesis
HIW’s valuation, geographic focus, and lease portfolio are all attractive during a time when businesses continue to pressure workers to return to the office.
Better Business Districts Insulate the Company from Weak Market Concerns
Highwood’s focus on “better business districts” (BBDs) in the U.S. south has positioned the company to generate attractive returns for investors. Many office REITs such as Vornado Realty Trust (VNO) or SL Green Realty (SLG), focus on coastal high-population markets (like NY and SF) that have been overbuilt and have seen office demand wane post-pandemic. (See this interesting article from Bloomberg from 9/25/22: Remote Work Is Killing Manhattan’s Commercial Real Estate Market)
HIW’s southern cities are in a much better situation than many of the major U.S. coastal cities. The sunbelt has some of the highest employment and new business growth in the country.
HIW Investor Presentation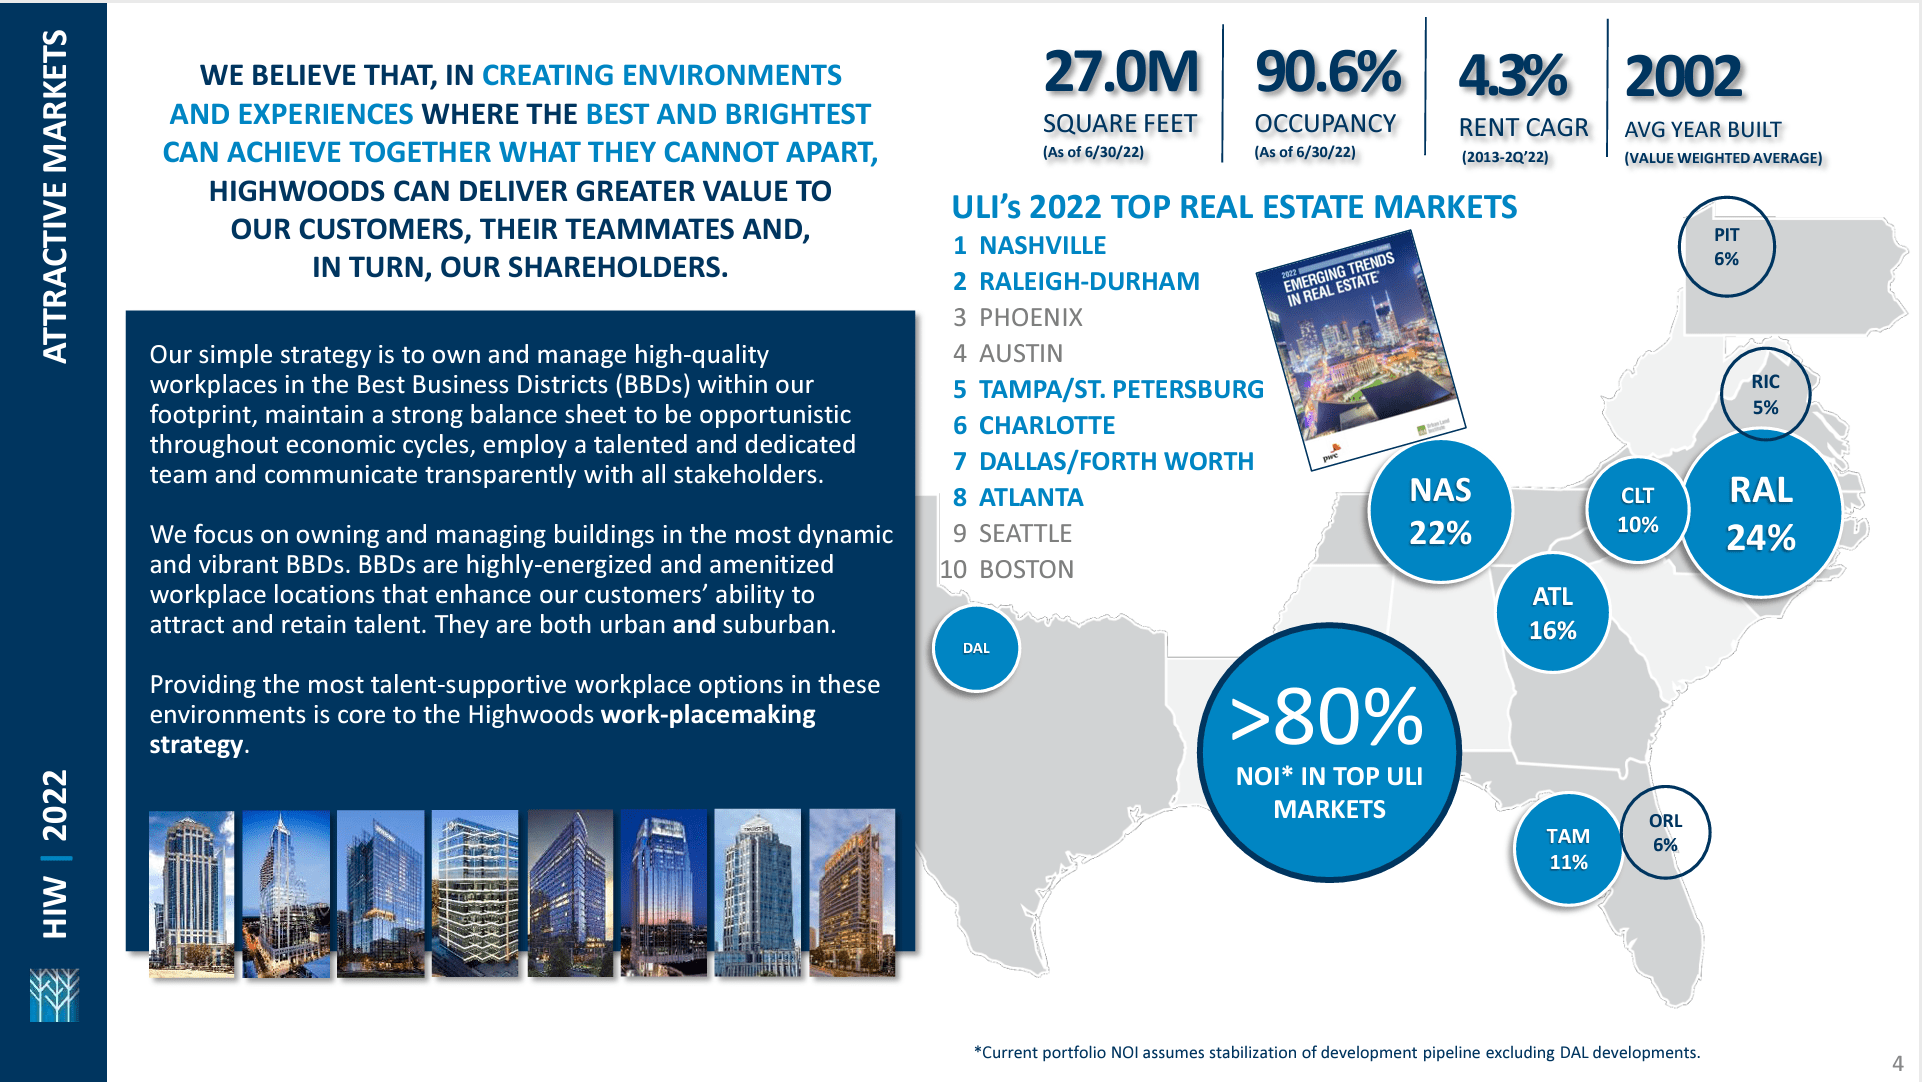
Several of gateway city REITs trade at lower cap rates than HIW. It’s also worth mentioning that their balance sheets and occupancy levels are no better than HIW’s. If anything, they have more leverage and lower occupancy.
Data Obtained from Bloomberg, Author’s Spreadsheet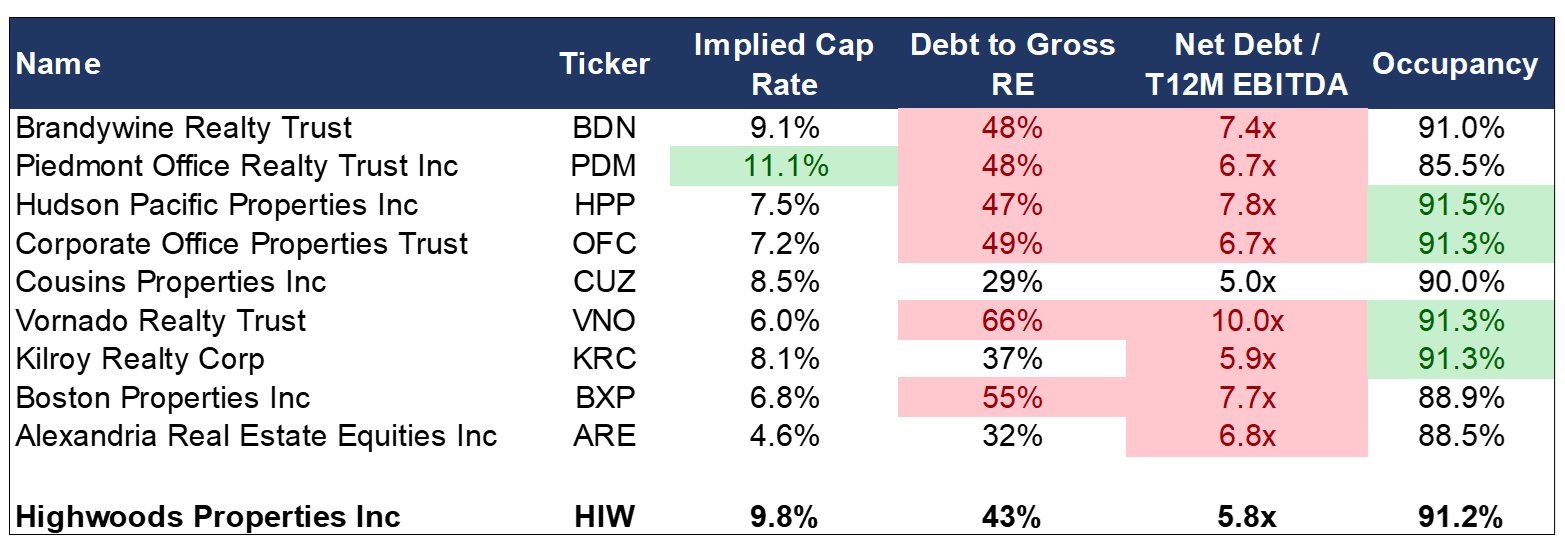
HIW actively manages its assets to position its portfolio to focus on attractive markets. Shifting geographies has been a net positive for investors as the company has traded up into properties and/or markets with better growth and free cash flow.
A recent example of this occurred in July when management announced that it would enter the Dallas market through a partnership with a local developer. Dallas is a top 10 market according to the Urban Land Institute (ULI) with a significant number of Fortune 500 companies headquartered in the city. Part of the equity financing commitment towards the partnership will come from the sale of assets the company currently has in Pittsburgh, PA.
HIW Dallas Market Overview Presentation
This type of business move is nothing out of the ordinary for the company. Entering Dallas and exiting Pittsburgh increases the company’s growth rate and cash flow generation, while also allowing the company to maintain a strong credit profile without the need to raise equity capital.
HIW’s Strong Lease Portfolio and Investment Grade Credit Rating Should Lead to Resilient Financial Performance
Highwoods lease portfolio is generally in pretty good shape as ~23.5% of leases are expiring through 2024. This is slightly below the peer average of ~25%. Overall, the average lease term for HIW is ~6 years.
Leasing activity has remained strong since the start of the pandemic and has returned to pre-pandemic run-rate levels year to date. If leasing activity continues to trend as it has, HIW could end up filling up a significant portion of expiring leases.
There are some larger leases that are set to expire towards the end of 2024 and the beginning of 2025 that could cause some problems if the leasing market stalls in a recession, but even if we stress occupancy levels, HIW should remain in fairly good shape.
Company Reports, Author’s Spreadsheet Company Reports, Author’s Spreadsheet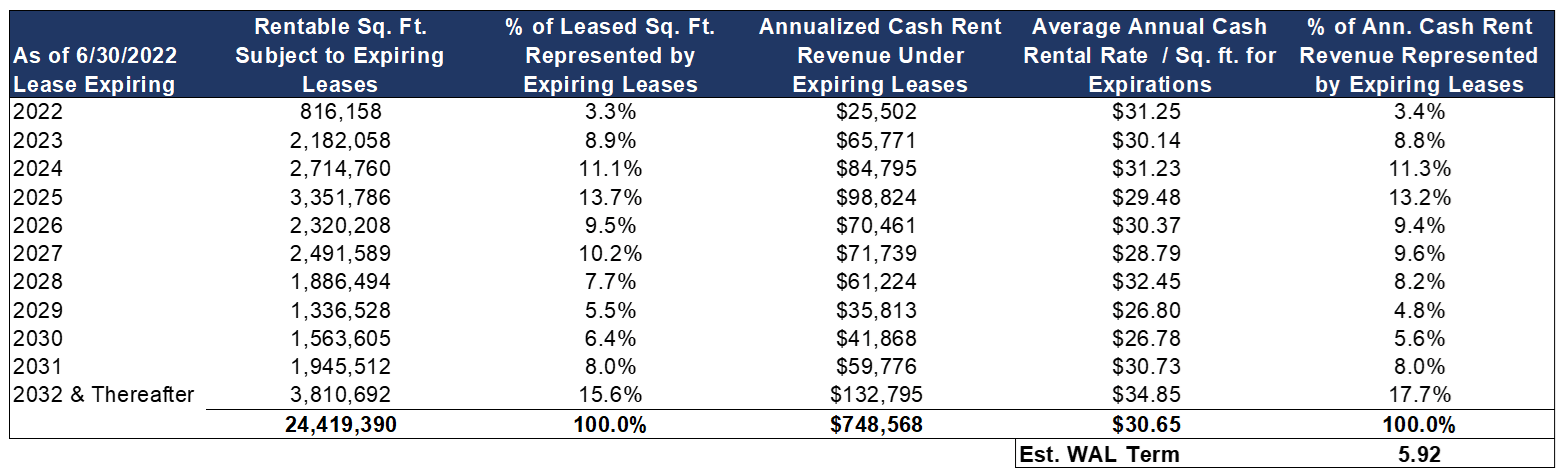
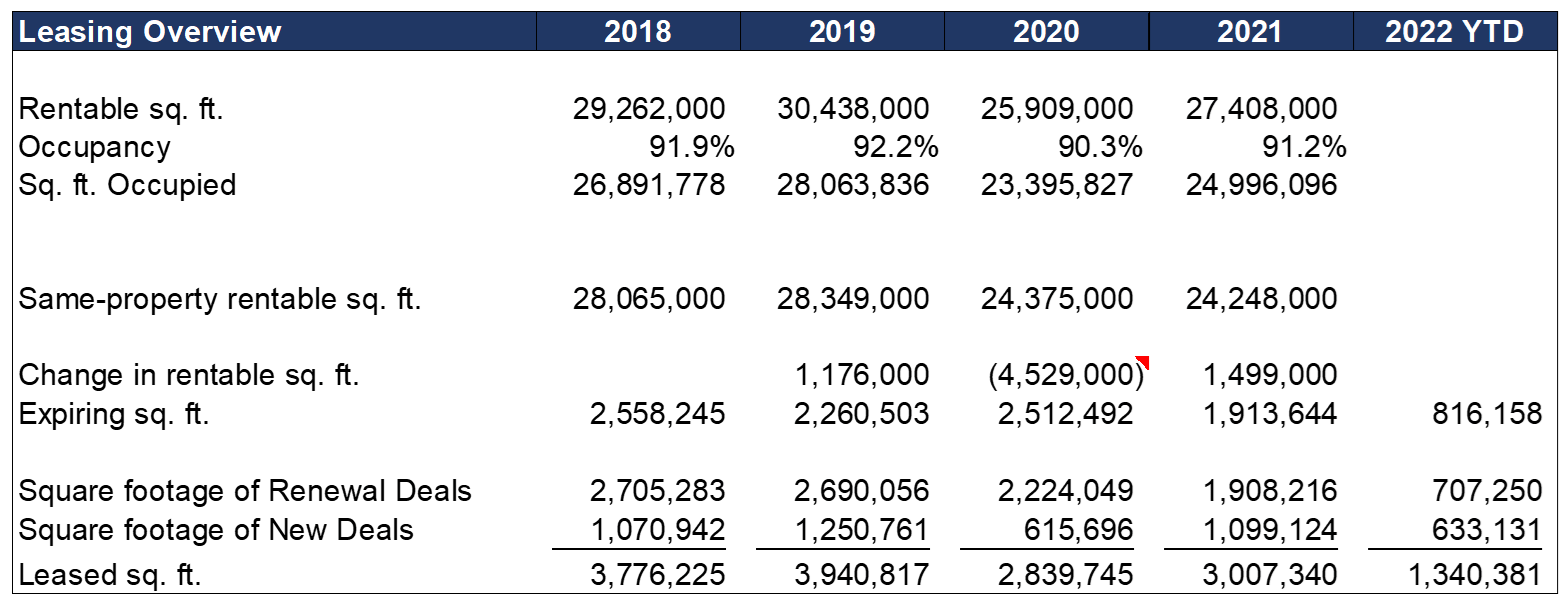
Management has guided for year-end occupancy to be in the 91% to 92% range, which is about 100 basis points higher than where it stood at the end of the 2nd quarter.
Tenant diversity is also strong with ~27% of base rent coming from professional, scientific, and technical services, ~18% from financing/banking, 12.9% from insurance, and 10% from healthcare.
Company Reports, Author’s Spreadsheet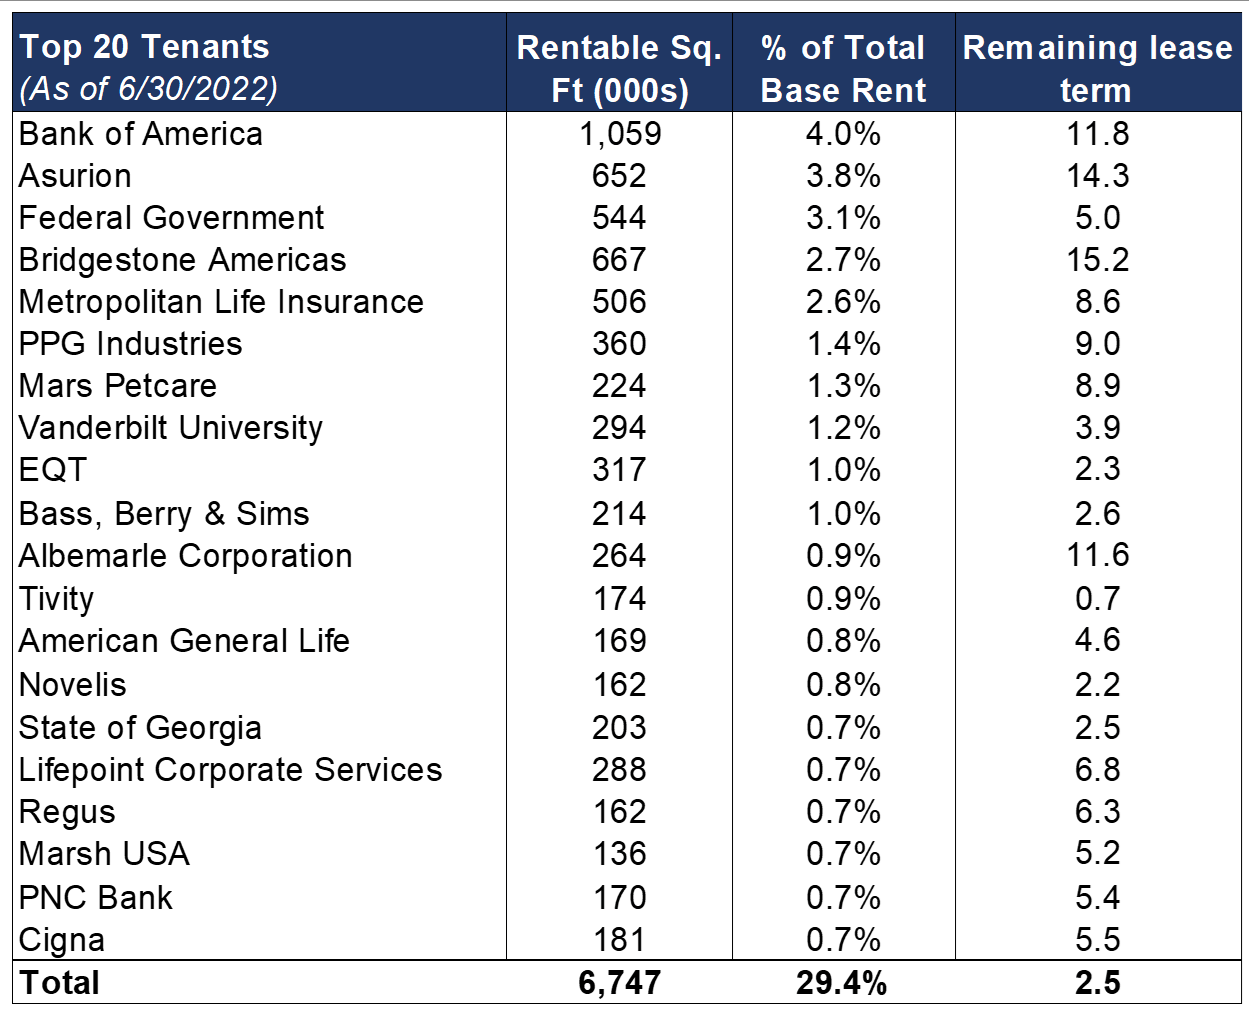
~50% of HIW’s tenants come from investment grade rated companies and large law firms, while the remaining 50% serve small-and-medium-sized businesses.
Highwood’s commitment to maintaining a strong balance sheet also put the company in an advantageous position if an economic downturn were to occur. The company is BBB rated from S&P and has a debt to gross real estate ratio of 43%, putting it below many of its peers. Net debt to EBITDA stands at 5.8x which is the 2nd lowest among its peer group.
Just $488M of the company’s $2.8B of debt is secured, representing ~7.3% of gross assets. Most of HIW’s debt is fixed rate with one maturity in 2023 and no other maturities until 2026.
The company’s strong balance sheet enables the company to take advantage of sellers who may become desperate in a downturn.
HIW’s current valuation leaves room for significant upside
We expect HIW’s implied cap rate to recover to historical ranges of 7.5-8%, particularly if fundamentals remain strong and long-term interest rates fall. HIW’s stock has been negatively correlated with the 10-year since the start of the 3rd quarter of 2022, which is a major reason behind the stock’s significant decrease in price.
The stock’s current implied cap rate of 9.9% represents a ~590 basis point spread of the U.S. 10-year treasury rate, which is 1.3 standard deviations above the stock’s average implied cap rate spread over 10-year USTs for the last 25 years.
Said different, over the last 25 years, HIW’s implied cap rate has only been at a higher spread over the 10-year UST ~8% of the time. As one would expect, those times were in the depths of the financial crisis in ’08/’09 and during the pandemic sell-off in 2020.
This level of panic leads us to believe that unless interest rates were to spike even higher, the stock is within 10-15% of bottoming out.
While it is impossible to predict the direction of interest rates, there is an argument to be made that the next move is potentially lower as the Fed’s aggressive interest rate policy has likely to put too much pressure on the economy and will push us into a recession.
Bloomberg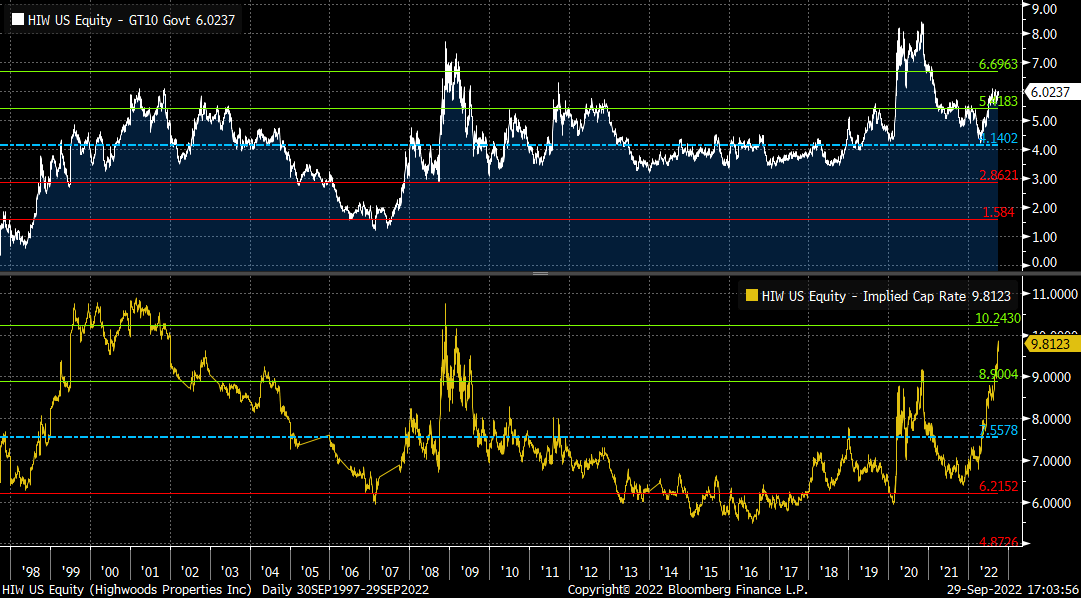
Risks
Length and depth of a recession poses risks to HIW’s financial performance
While expectations for a U.S. recession are rising, significant uncertainty exists around the duration and severity of the recession. A short, narrow recession would probably not impact HIW’s performance very much as the office leasing market would rebound quickly.
However, if a moderate to severe recession occurs, and it takes significant time for the labor market to recover, HIW’s occupancy may decline, reducing net operating income (NOI) and FFO. Given the larger leases expiring in late 2024 and early 2025, this is probably the biggest risk to the company.
HIW has some assets that may be challenged in a post-pandemic world
HIW average year built is ~2001, with some buildings dating back to the ’80s. Older buildings may be less desirable and require capex to make them desirable to new tenants.
Office quality has become even more important post-pandemic. Newer, trophy-like class A office buildings are really the only assets that have been trading. The market for class A commodity-like assets, which is a lot of HIW’s portfolio, has pretty much dried up. This seems to be the result of the recent interest rate volatility and fears over the future of these types of assets.
Model
Under our base case scenario for 2022, we assume average rentable square feet decreases 1.9%, average occupancy remains approximately flat y/y at 91.1%. We also assume the company’s rent per square foot increases 7% driven by strong re-leasing activity during the year. This results in revenue growth of 4.8% y/y.
In 2023, we estimate rentable square feet to increase 1.6% and average occupancy to decline to 90.1%, while rents grow to 2.5%. This leads to revenues increasing ~3%.
NOI margins are expected to remain approximately flat over the next two years, and G&A is expected to remain largely flat at $42M.
These assumptions lead to 4.3% FFO per share growth to $3.94 for 2022 and 2.2% FFO per share growth to $4.03 in 2023.
Author’s Spreadsheet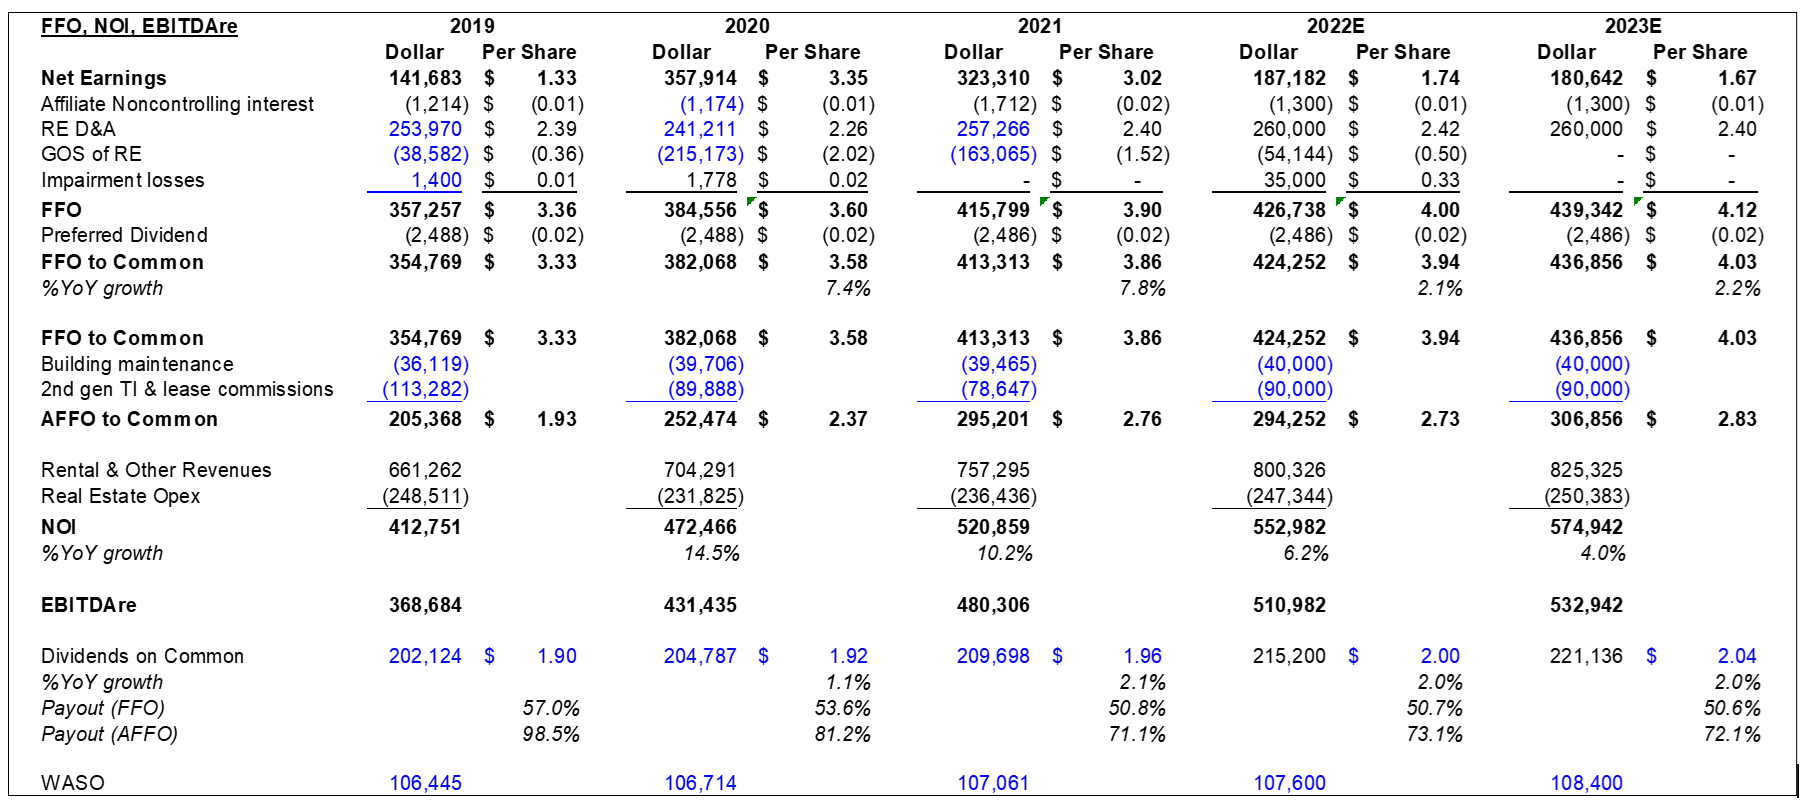
If we stress the company’s financials and assume occupancy falls to 88% and NOI margins fall to 66%, that results in NOI falling 5.6% to ~$522M. That would be a larger drop than the 4.2% amount that occurred in 2009.
Author’s Spreadsheet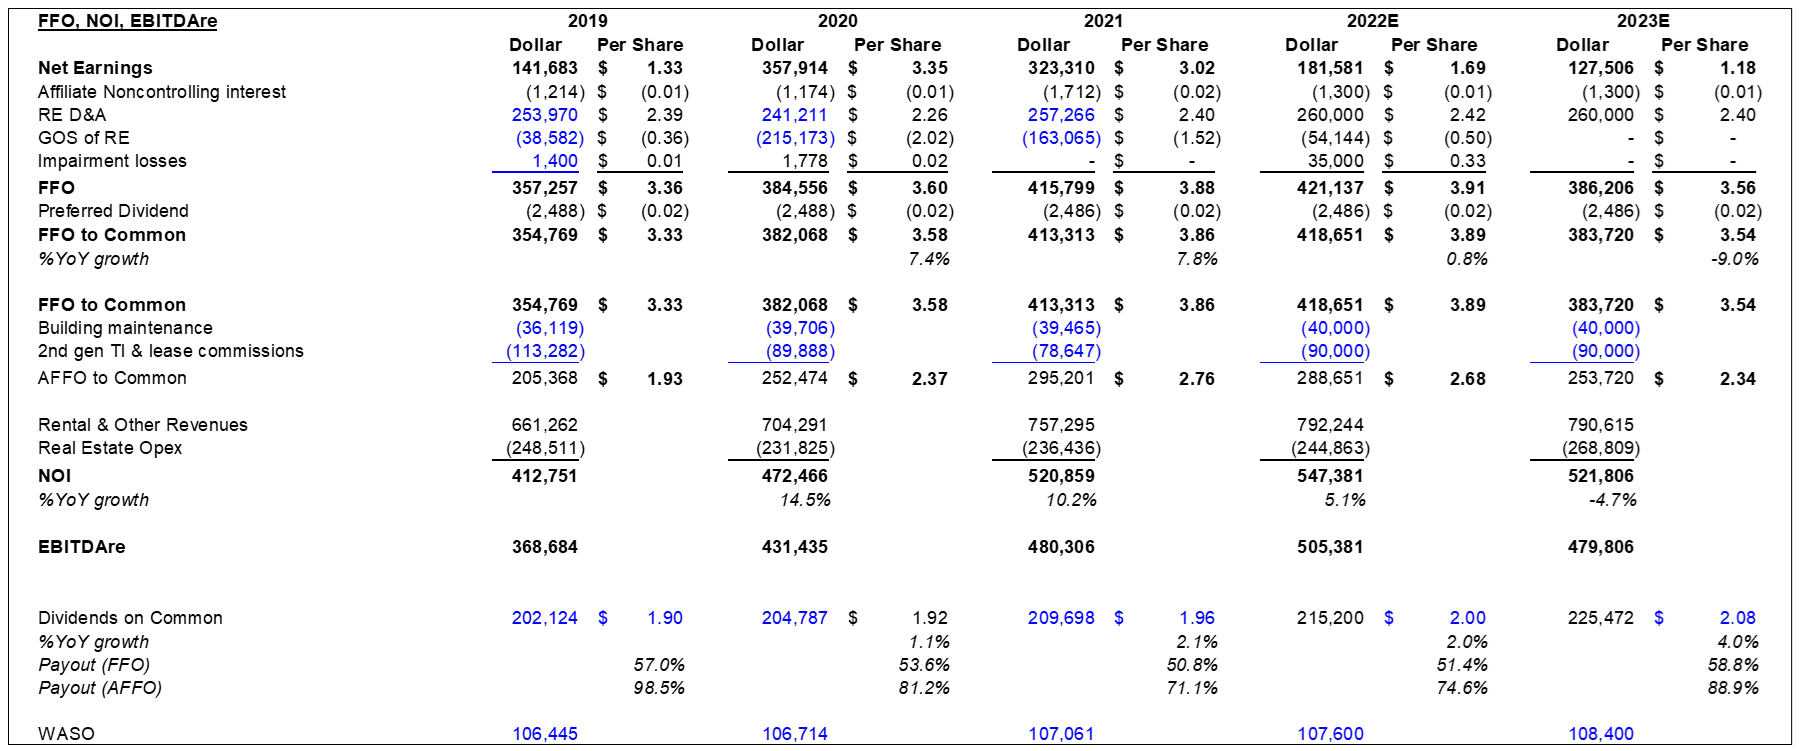
Valuation
HIW’s stock has seen its cap rate spread to treasury jump significantly, to well over historical averages. Our base case scenario assumes a 420-basis point spread to a 4% U.S. 10-year treasury.
At an 8.2% cap rate, we see a total return upside of 42% over the next 12 to 18 months. We believe downside total return is fairly limited to ~13%, since $2 in dividends covers a large portion of the downside in the stock.
Author’s Spreadsheet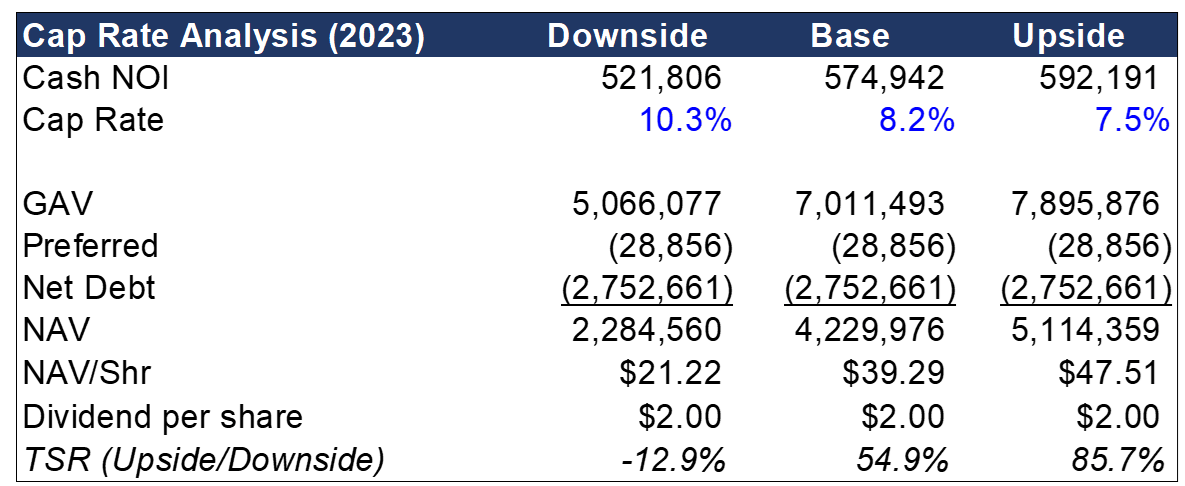
Using price to FFO multiples, we believe total return downside is ~13.3% and upside is potentially ~60%, if the stock returns to its historical range of 10.5x to 13x. Our upside is for the stock to potentially double, which is just the stock returning to its historical average P/FFO multiple of 13x on slightly higher FFO per share numbers.
Author’s Spreadsheet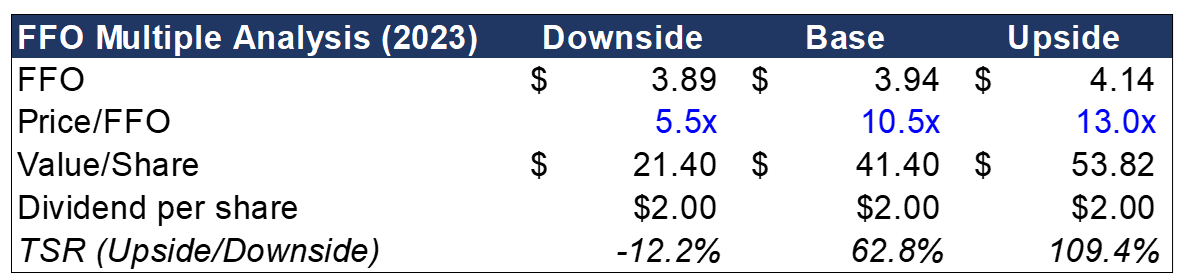
Conclusion
While the pandemic has created several challenges for office REITs, we believe Highwoods is positioned to benefit from the geography of its portfolio and the push to get workers back into the office. HIW’s exposures to the financial services, insurance, and legal profession seem to position the company better than other REITs which are more focused on technology companies, as tech companies seem to be much more inclined to embrace remote work.
At recent prices, HIW is now trading at a ~7.5% dividend yield. Even in an environment where 1-year treasuries are yielding ~3.8%, the yield on HIW is attractive.
A dividend cut is highly unlikely. By our estimates, the company’s AFFO payout ratio (which adjusts AFFO for any recurring capex and tenant improvement) is ~70%. HIW’s balance sheet is also solidly investment grade.
That’s not to say in a full-on panic the stock won’t drop another 10-20% from current levels, but the yield and risk/reward at recent prices seems to be an attractive opportunity.
For investors who are concerned about the direction of the market or the stock’s correlation to the office REIT sector, one may want to consider a pair trade with one of the gateway city exposed office REITs.
Office REIT stocks are highly correlated, making the sector attractive for executing a pair. Kilroy Realty (KRC) looks like the most attractive candidate as it is focused on major west coast cities and currently trades at an implied cap rate of 8.1%. KRC yields 5.0%, which is 2.5% lower than HIW.
Be the first to comment