

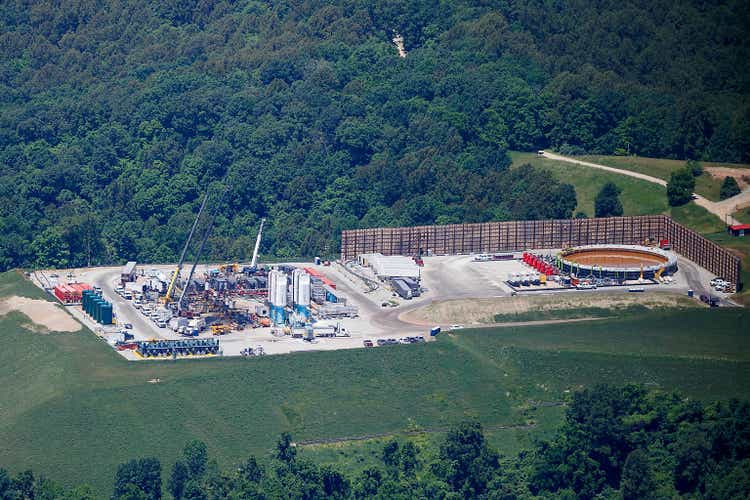
6381380/iStock Editorial via Getty Images
As I previously stated, it’s a great time to buy oilfield service (or OFS) stocks. The oil industry is under government and public pressure to pump more hydrocarbons, which requires more wells to be drilled and completed, which in turn means higher day rates and greater equipment utilization for OFS vendors.
- If you dread the wild gyrations of oil and gas prices, OFS companies – as opposed to commodity producers – do not suffer from short-term oil and gas price volatility directly, as long as the oil bull market is going strong in the longer term, which I believe is exactly the case as I discussed in a recent article.
- Additionally, if you worry about inflation, OFS providers are expected to pass on input material and labor price hikes to the operators thanks to the currently tight market it serves.
That’s why I expect the OFS players to post exciting results in the upcoming 2Q2022 quarterly reporting season.
Before the quarterly earning reporting begins, let’s look at STEP Energy Services Ltd. (STEP.TSX)(OTCPK:SNVVF), a small-cap oilfield service player operating in Canada and the U.S.
STEP: the business
STEP was founded in 2011 as a specialized deep-capacity coiled tubing company in Canada. Since then, it has expanded into completion and stimulation services to E&P companies both in Canada and the U.S., with specialization in hydraulic fracturing of wells that are deeper and have longer laterals and higher pressures.
STEP currently has operations in the Western Canadian Sedimentary Basin in Canada as well as the Permian Basin and Eagle Ford play in Texas, the Uinta-Piceance and Niobrara-DJ basins in Colorado and the Bakken play in North Dakota (Fig. 1).
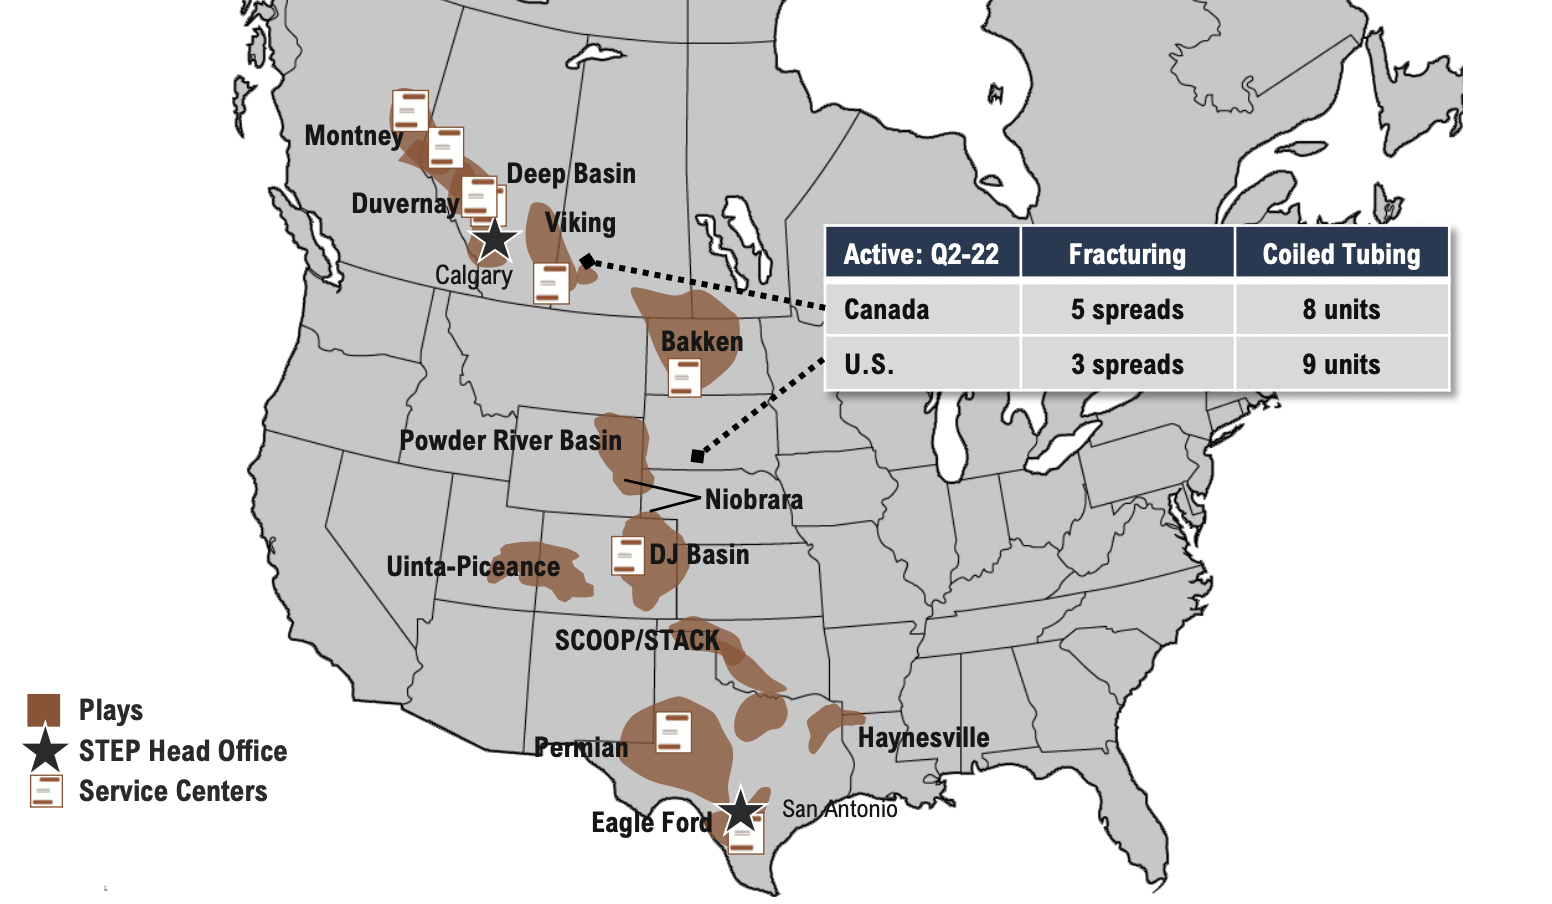
Fig. 1. STEP Energy Services operations in Canada and the U.S. (Modified from STEP)
STEP has two operating divisions, i.e., Canada and the U.S., which contribute 66.9% and 33.1% of revenue respectively as of 1Q2022. The fracturing line of business pulled in the vast majority (76.8%) of the top line, while coiled tubing services make up the remaining 23.2%.
STEP went IPO on TSX-V on May 2, 2017, where on average slightly less than 400,000 shares change hands per day. The stock also trades on OTC-Pink market under the ticker symbol of SNVVF, with relatively limited liquidity.
Business fundamentals
Equipment utilization
Equipment utilization has continued to improve for both fracturing and coiled tubing.
- In Canada, idled fracturing capacity gradually decreased from 232,500 HP in the 2Q2020 to 57,500 HP in the 1Q2022, matching the pre-COVID levels; and idled coiled tubing units dropped from 11 in the 2Q2020 to 8 in the 1Q2022, yet to decline below the 1Q2020 level.
- In the U.S., idled fracturing capacity gradually decreased from 157,500 HP in the 3Q2020 to 42,500 HP in the 3Q2021-1Q2022, already lower than the pre-COVID 1Q2020; and idled coiled tubing units decreased from nine as in the 2Q2020 to five from 2Q2021 to 1Q2022, again lower than 1Q2020. Apparently, the recovery in equipment utilization has been stronger in the U.S. market than in the Canadian one.
- Equipment capacity has remained constant for STEP since the 4Q2019 for fracturing and since 2Q2019 for coiled tubing. STEP seems to have moved 15,000 horsepower of fracturing capacity across the border to the U.S. after the 3Q2019, while coiled tubing units were increased from 14 to 16 in Canada and from 12 to 13 in the U.S. both in the 2Q2019 (Fig. 2).
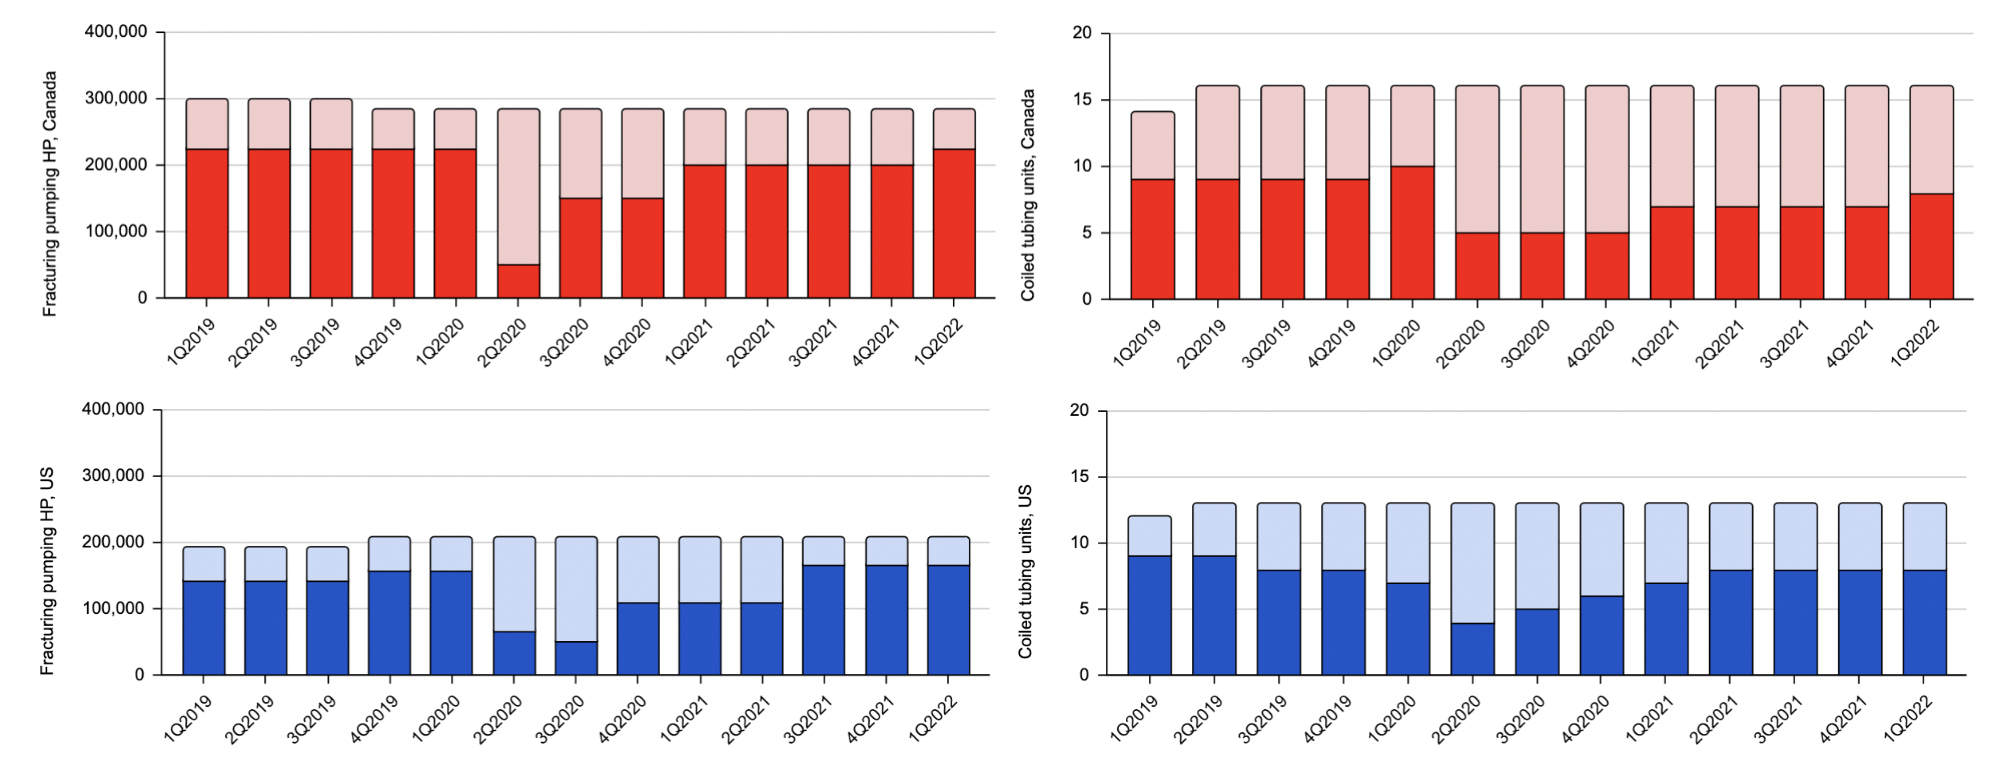
Fig. 2. Fracturing and coiled tubing equipment utilization at STEP in Canada and the U.S., with active equipment in darker colors and idled equipment in lighter colors (Laurentian Research based on data sourced from Seeking Alpha and STEP)
Considering a 15%-20% of the active horsepower is required to accommodate equipment maintenance cycles, it’s safe to say that as of 1Q2022, STEP is nearing full utilization for fracturing equipment both in Canada and the U.S., which essentially echoes what Halliburton (HAL) stated in the 1Q2022 earnings call. On the other hand, coiled tubing utilization still has headroom to further improve.
Day rates
As equipment utilization picked up, day rates have increased substantially.
- For fracturing equipment, the day rate in Canada has risen above the pre-COVID levels and there is no reason not to expect it to surmount C$300,000 per day. Meanwhile, the day rate in the U.S. is yet to surpass the pre-COVID days, where the upside can be more than 75%, supposing fracturing day rate recovers to the height of the pre-COVID time.
- For coiled tubing equipment, the day rate has been rather resilient in Canada even during the COVID times. In the U.S., the COVID-induced lost ground, not so deep to begin with, has been fully reclaimed (Fig. 3).

Fig. 3. Day rates captured by STEP in Canada and the U.S. (Laurentian Research based on data sourced from Seeking Alpha and STEP)
It’s worth noting that the U.S. market appears to be currently more fully competed as compared with the Canadian market, judging from the difference in day rates across the border. However, the U.S. market, approximately 3-4 times bigger the Canadian market, is where growth is as the oil bull market swings higher.
Revenue
Thanks to the rising equipment utilization and improving day rates, STEP has pulled in an increasing amount of revenue since the 2Q2020. Although revenue in 2021 was still shy of that in the pre-COVID 2019, by 1Q2022, revenue had risen above the pre-COVID high reached in 1Q2020, by a margin of 13% (Fig. 4).
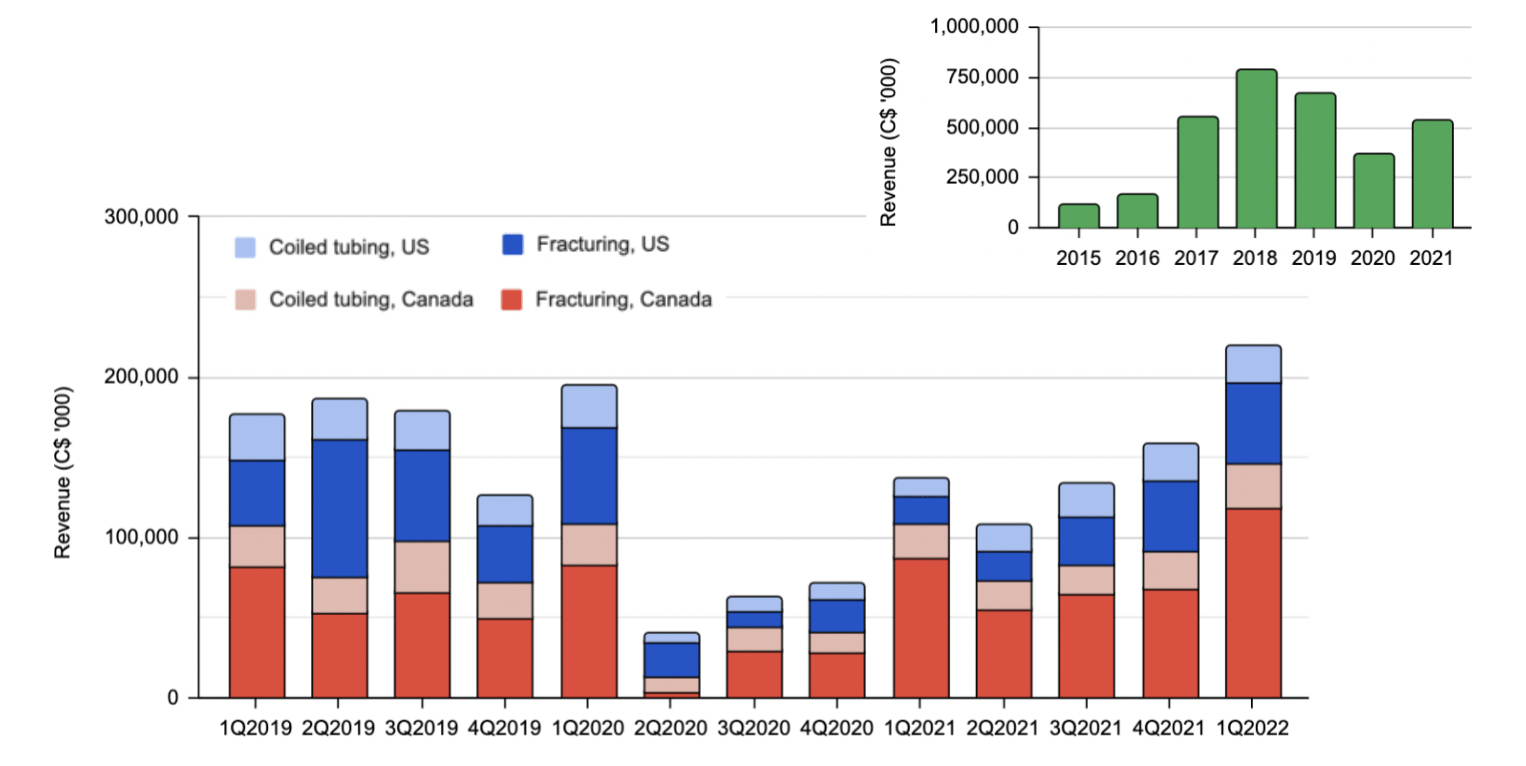
Fig. 4. Revenue for the fracturing and coiled tubing divisions by quarter and year (Laurentian Research based on Seeking Alpha and STEP)
Margins
Despite strong seasonality, the Canadian segment enjoys higher margins than the more fully competed and more cyclical U.S. segment. Nonetheless, margins there have improved materially since 2Q2021 (Fig. 5).
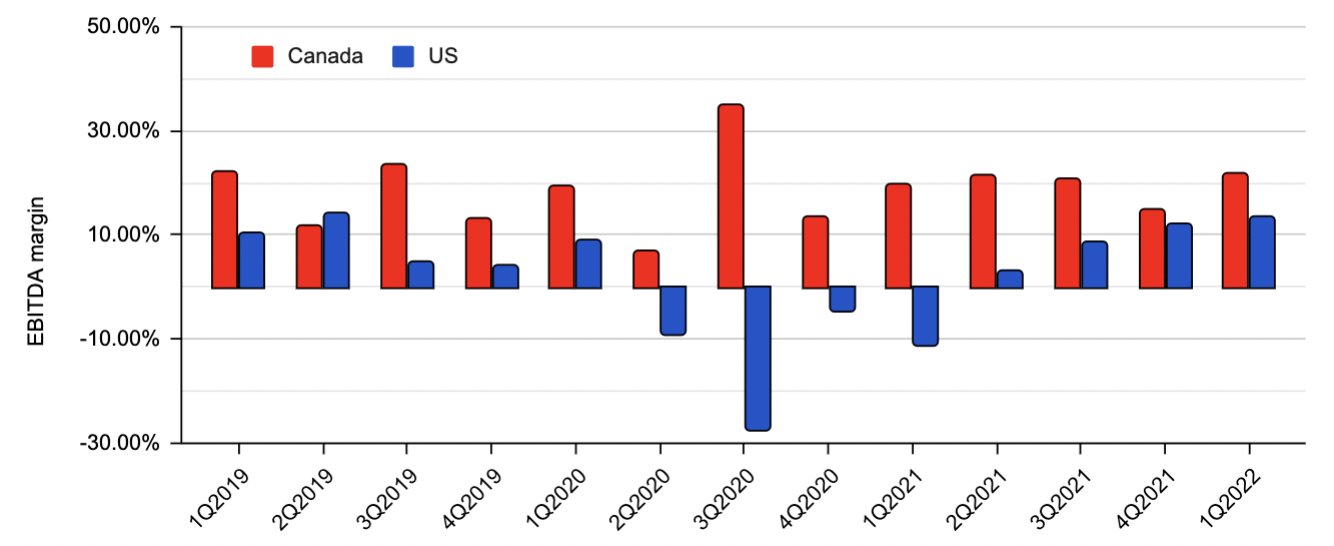
Fig. 5. EBITDA margin for the Canadian and U.S. segment of STEP (Laurentian Research based on Seeking Alpha and STEP)
Margins remain below the levels achieved in previous cycles. The extreme tightness in oilfield service markets seems to point to higher day rates and further improved profitability in the foreseeable future.
Outlook and upside
From our analysis above, STEP is supposed to see strong increase in day rates and equipment utilization, which will drive sequential improvement in revenue and adjusted EBITDA performance. According to the company’s operational updates, STEP continues to experience strong demand for services both in the Canadian and U.S. geographic regions, which is expected in the backdrop of rising rig counts in these regions (Fig. 6).
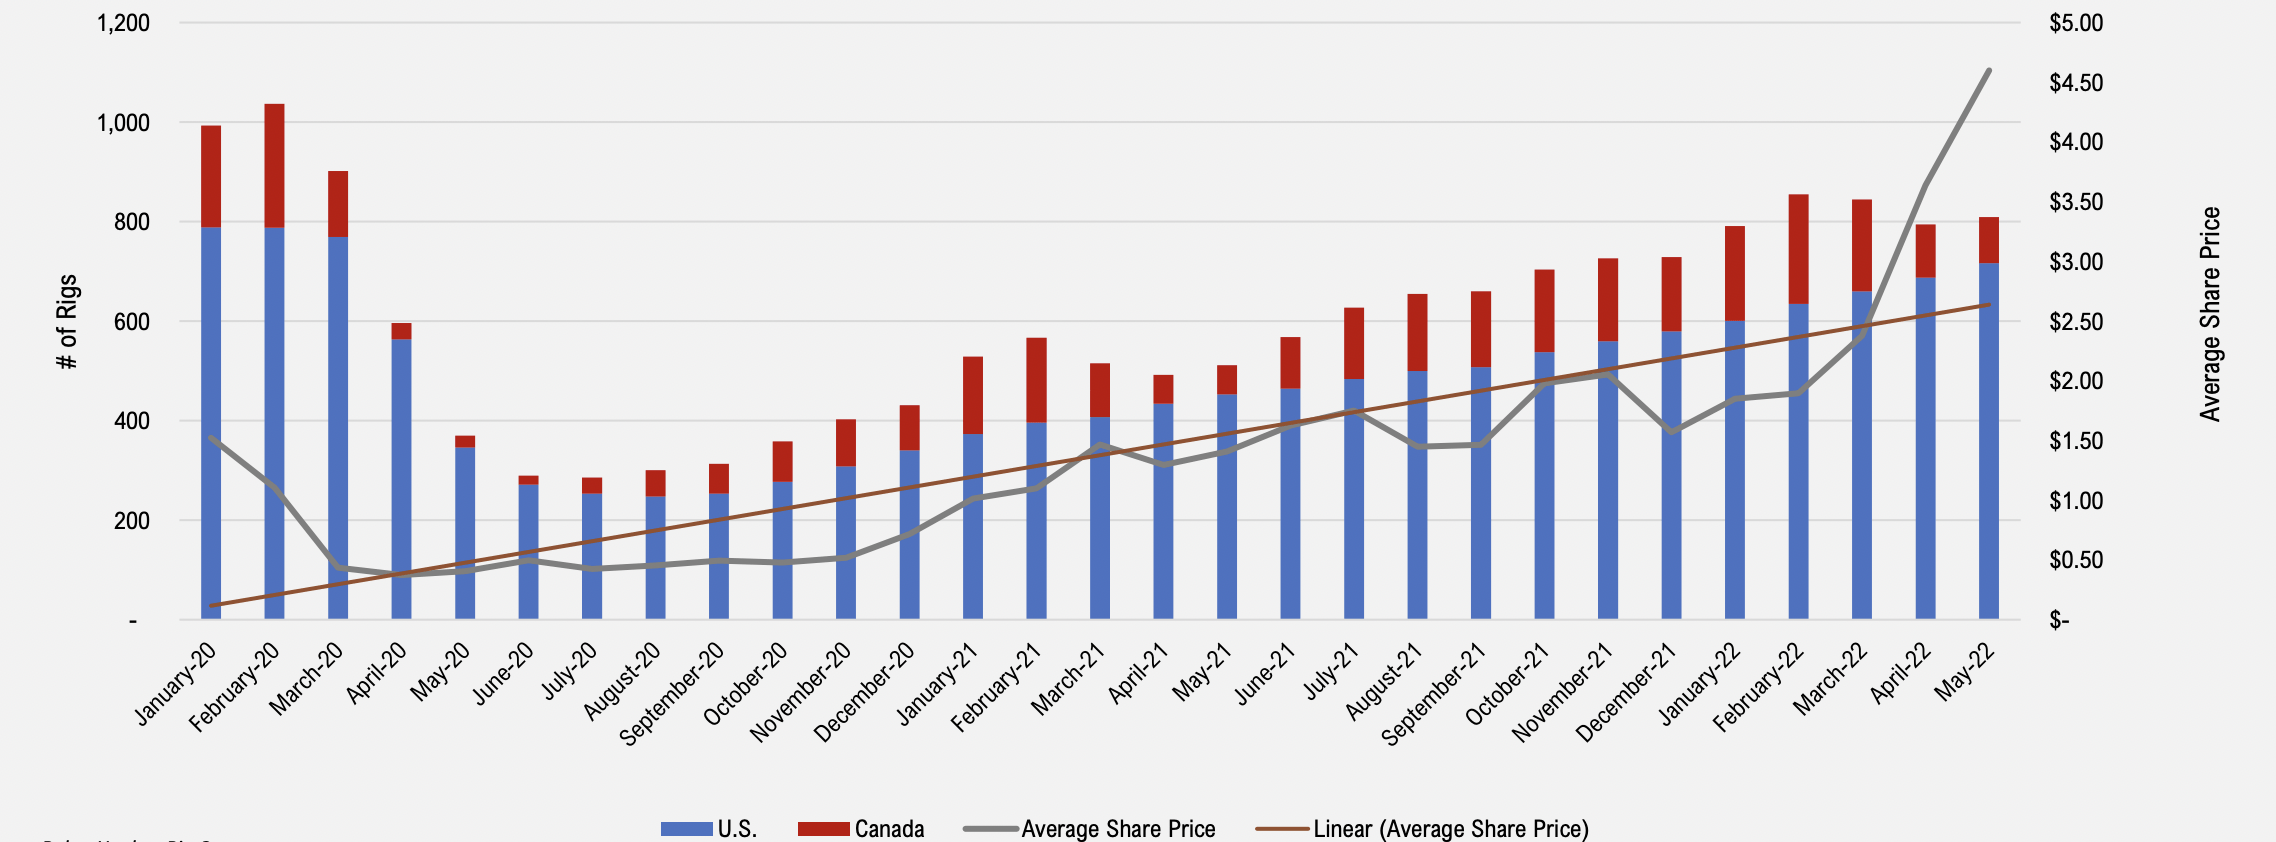
Fig. 6. U.S. and Canadian drilling rig count, 2000 to present (STEP)
Canada
Up north, STEP is expected to focus in the 2Q2022 on larger multi-well pads, which minimized the impact of spring break-up conditions, which should provide steady utilization for the company’s five fracturing crews, outside of a slower period during mid-April to mid-May.
The larger pads and improved day rates will result in a higher day rate relative to 1Q2022. In addition, during the last downturn, STEP gave operators deep pricing concessions; as the industry swings to an up-cycle, these discounts have been disappearing (Fig. 3). Therefore, STEP is expected to continue to enjoy tailwinds on its back when its comes to day rates. As a matter of fact, the management allowed that pricing in the 2Q2022 was steady, contrary to the usual pricing weakness during the spring break-up periods.
U.S.
The U.S. fracking market has tightened significantly, particularly in the Permian Basin where STEP operates three fracturing crews, thanks to supply chain constraints and industry discipline. I don’t expect STEP to activate additional equipment. However, day rates in the U.S. has increased from the start of the 2Q2022, laying ground for continued margin expansion (Fig. 3; Fig. 5).
Near-term outlook
STEP management estimates 2Q2022 revenue to be between C$250.0 million and C$265.0 million and adjusted EBITDA to be in the range of C$42.0-50.0 million, which will lead to record-high revenue. As compared with C$219.5 million in revenue and C$37.0 million in adjusted EBITDA reported in 1Q2022, I expect there will likely be a sequential improvement of 17% for revenue and 24% for adjusted EBITDA.
Looking further ahead, in the 3Q2022, I believe STEP will most probably experience higher activity levels in Canada and steady activity in the U.S., with continued improvement in day rates on a sequential basis.
Valuation and upside
At present, STEP is valued at an EV/EBITDA multiple of 3.38X on 1Q2022 run-rate or 2.72X on an expected 2Q2022 run-rate.
- As a reference, the big three OFS juggernauts Schlumberger (SLB), Halliburton and Baker Hughes (BKR) currently capture an EV/EBITDA multiple of 9.0-10.0X, while Canadian peers Total Energy Services (OTCPK:TOTZF) and Trican Well Service (OTCPK:TOLWF) are valued at 4.3X and 5.3X, respectively.
Compared with these peers, STEP is deeply undervalued. A re-rating to the level of valuation of Canadian peers alone may result in an ~80% appreciation, let alone capital appreciation to be expected from organic growth.
Risk
Inflation in input factor prices puts STEP in a spot where it has to continually adjust day rates upwards to maintain profitability. Fortunately, it’s operating in a tight OFS market.
- Proppant supply remains under pressure, although STEP has been able to secure supply from its major sand suppliers.
- Both the supply of equipment and availability of trained personnel are expected to remain tight. Although the company doesn’t foresee activation of additional fleet capacity through the rest of 2022, going forward, significant capital expenditures may be needed to activate much of the idled equipment.
STEP currently has C$214 million of net debt on its balance sheet, at 1.45X of the 1Q2022 adjusted EBITDA on a run-rate basis. Accordingly, debt retirement remained a key priority. Scheduled quarterly repayments of the term loan facility of $7.0 million per quarter began on March 31, 2022, which is why debt is expected to decline from now on (Fig. 7).
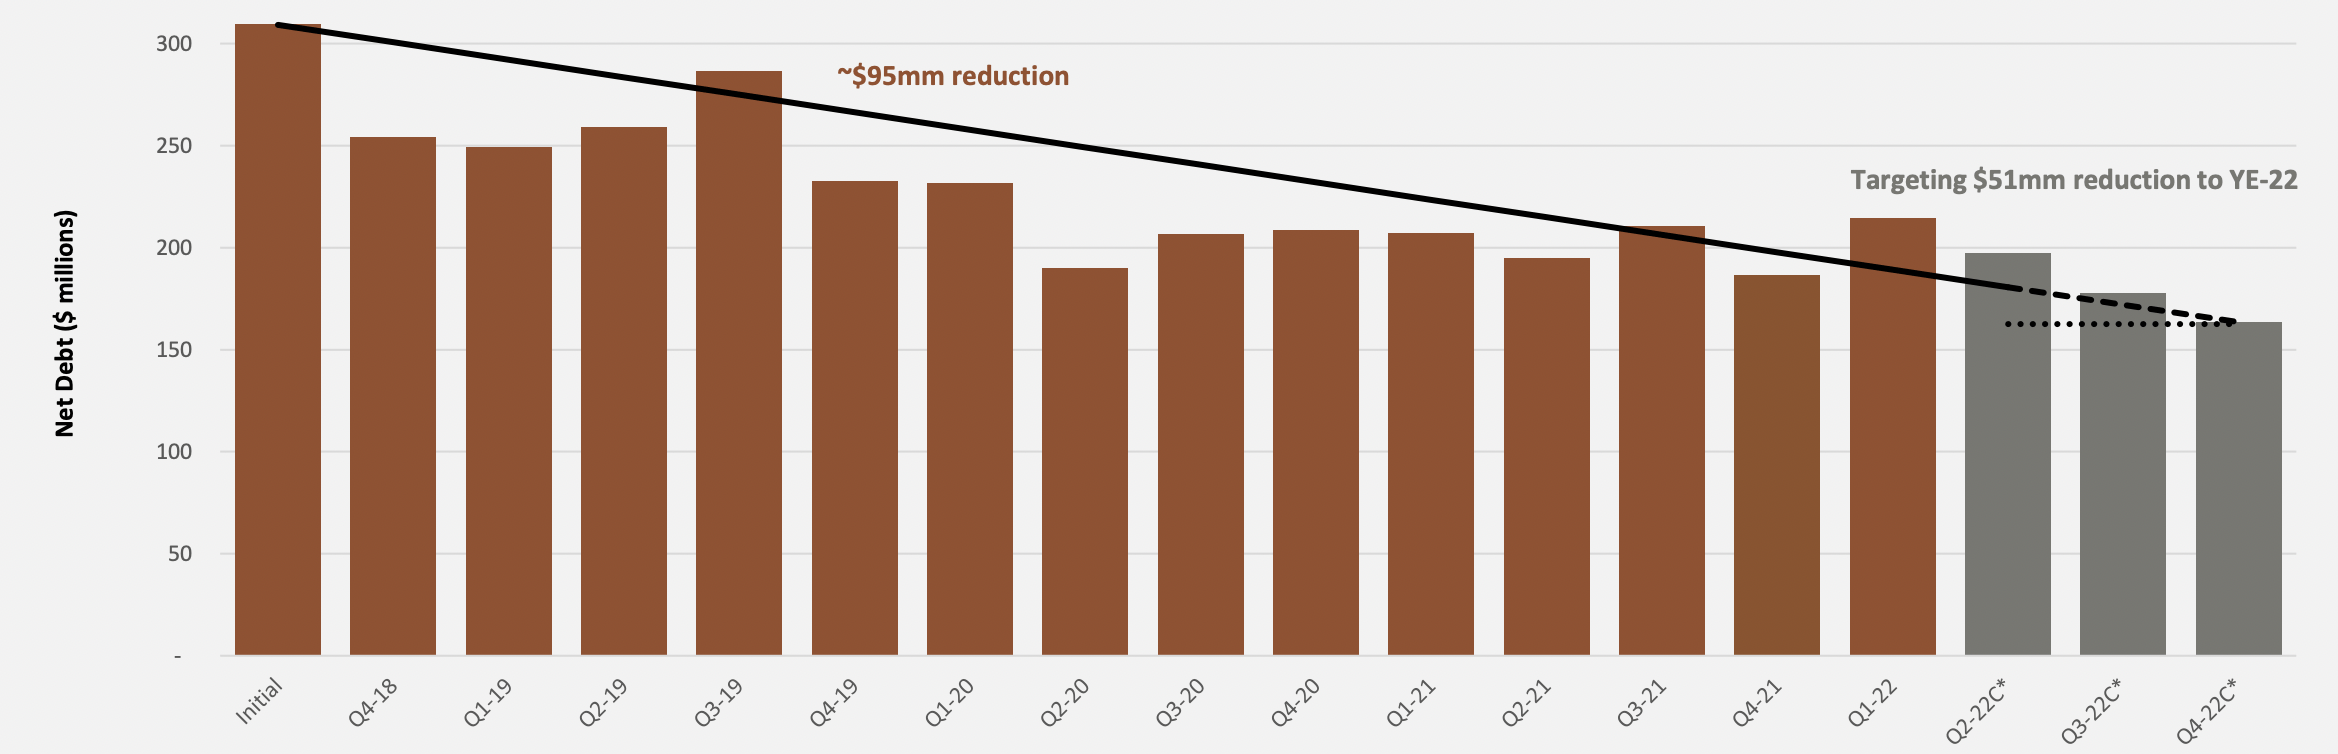
Fig. 7. Net debt of STEP Energy Services, actual and projected (STEP)
STEP has been in discussions with its syndicate of lenders on the renewal of its credit facilities. On July 12, 2022, the company successfully amended and extended its credit agreement. The credit facilities include a C$215 million revolving facility, a C$15 million operating facility, a US$15 million operating facility, and a three-year term with a maturity date of July 12, 2025, which should provide ample liquidity for the company to run its operations and activate additional equipment.
Investor takeaways
Our in-depth analysis indicates that business for STEP Energy Services has steadily improved since the COVID-19 trough. With specialization in high-performance fracturing and coiled tubing, STEP is well positioned to benefit from day rate appreciation and equipment activation, especially as the North American oilfield service market remains tight in the foreseeable future.
Perhaps due to its greater net debt, the market has not yet accorded as much credit to STEP as to its Canadian peers even though STEP has already begun to generate record-high revenue. However, beginning in the 2Q2022, the company began to pay down debt so leverage will be less and less of a concern to investors. It is thus an opportune time to consider accumulating its shares.
To that end, investors are fortunate that STEP share price has declined by some 28% since early June 2022, ahead of the 2Q2022 earning reporting season that will most probably deliver pleasant surprises (Fig. 8).
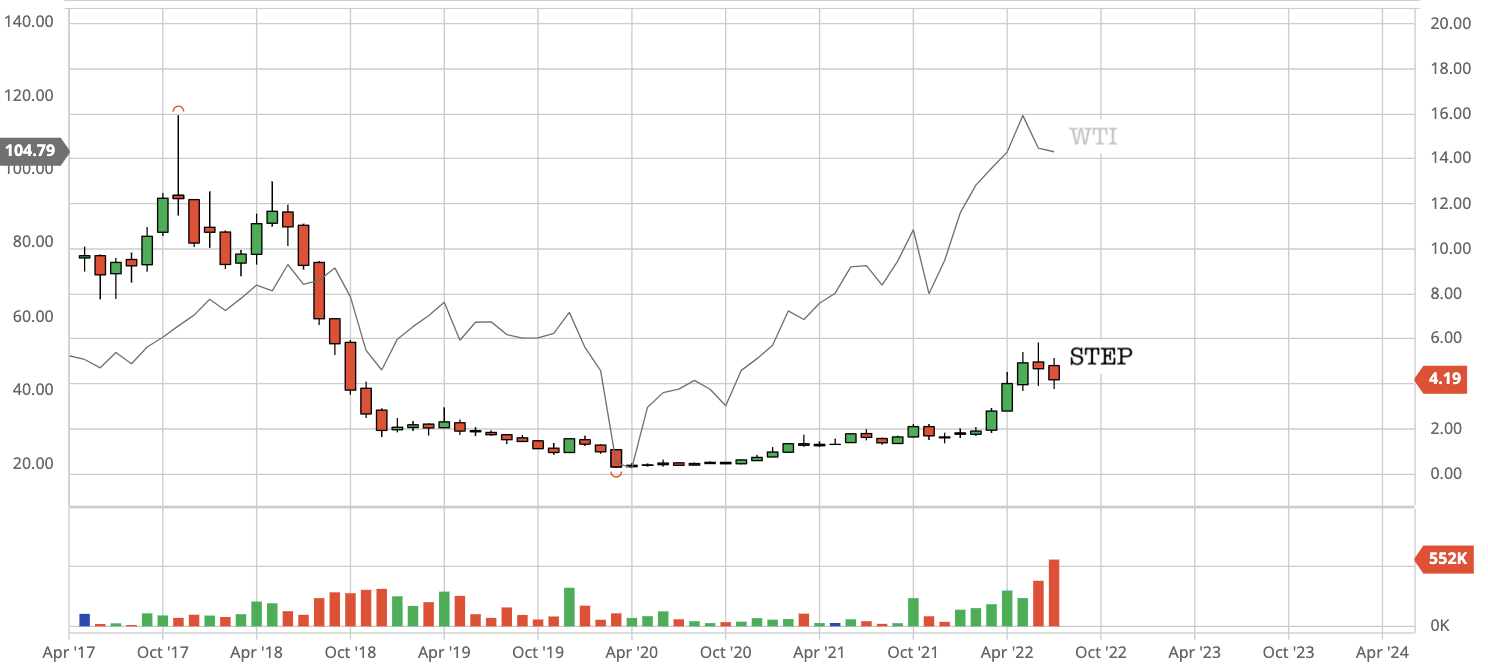
Fig. 8. The share price of STEP Energy Services, as compared with the WTI benchmark oil price (Laurentian Research based on Seeking Alpha and Barchart)
Editor’s Note: This article discusses one or more securities that do not trade on a major U.S. exchange. Please be aware of the risks associated with these stocks.
Be the first to comment