

ByMPhotos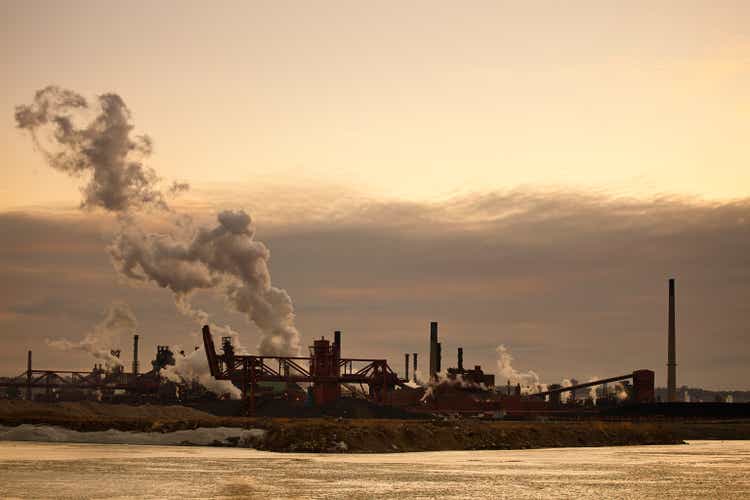
Investment Thesis
Stelco Holdings Inc. (OTCPK:STZHF) is in a cyclical sector. As such, I analyzed and valued Stelco based on its performance over the cycle. The challenge with Stelco is that data was only available since its IPO year of 2017.
Given this, I took 2018 to 2020 average values to represent the performance over the cycle. This is based on looking at the past 20 years’ steel cycle pattern and ignoring prices of the past year or so.
Stelco is fundamentally strong with good growth and ROA since its IPO. At the same time, steel demand is expected to grow given the recently passed infrastructure plan. There are margins of safety based on its EPV over the cycle. There are also other upsides.
Company background
Stelco is a Canadian integrated steel manufacturer that was at one time part of the United States Steel Corporation Group. Its present corporate set-up followed its divestment by US Steel (X), a restructuring, and 2017 IPO.
Stelco operates from 2 facilities in Ontario. These are strategically located near its raw material suppliers and core customers. Its products include flat-rolled valued-added steel, coated pre-painted cold-rolled and hot-rolled sheet products. In 2021, hot-rolled steel accounted for about 3/4 of the total shipments.
Its customers include steel service centers, construction, automotive, energy, and appliances industries in Canada and the U.S.
Cyclical sector
In its announcement for the second quarter 2022 results, Stelco stated that:
“…we are faced now with even stronger headwinds, including the sharply negative reversal in pricing trends that began early in the quarter…It is expected that Adjusted EBITDA in Q3 will be materially below the Q2 level, and further weakening is expected in our Q4 results…”
But Stelco is in a cyclical sector. For a long-term value investor, the issue is not the quarterly or even the current year’s performance. Rather it is the performance over the cycle.
Steel prices have gone through several cycles over the past 20 years. But prices for the past year or so have been exceptional, as can be seen from Chart 1.
Chart 1: Hot Roll Steel Prices (SteelBenchmarker)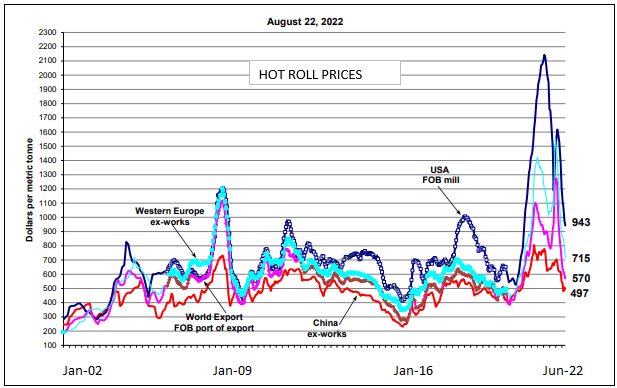
Not surprisingly, Stelco’s revenue also shows a cyclical pattern in line with the steel price as illustrated in Chart 2.
The challenge for Stelco is that it only had published data from its 2017 IPO year. I thus could not use my normal approach of looking at the past decade performance to get the cyclical values.
Looking at Chart 1, I would say that the 2018 to 2020 peak-to-trough average can be a good representation of the long-term average performance. It is certainly better than the past 2 years’ peak-to-trough. I thus used the average values over this period to represent the cycle values of the various metrics.
Chart 2: Stelco Revenue Index vs Hot Roll Price Index (Author)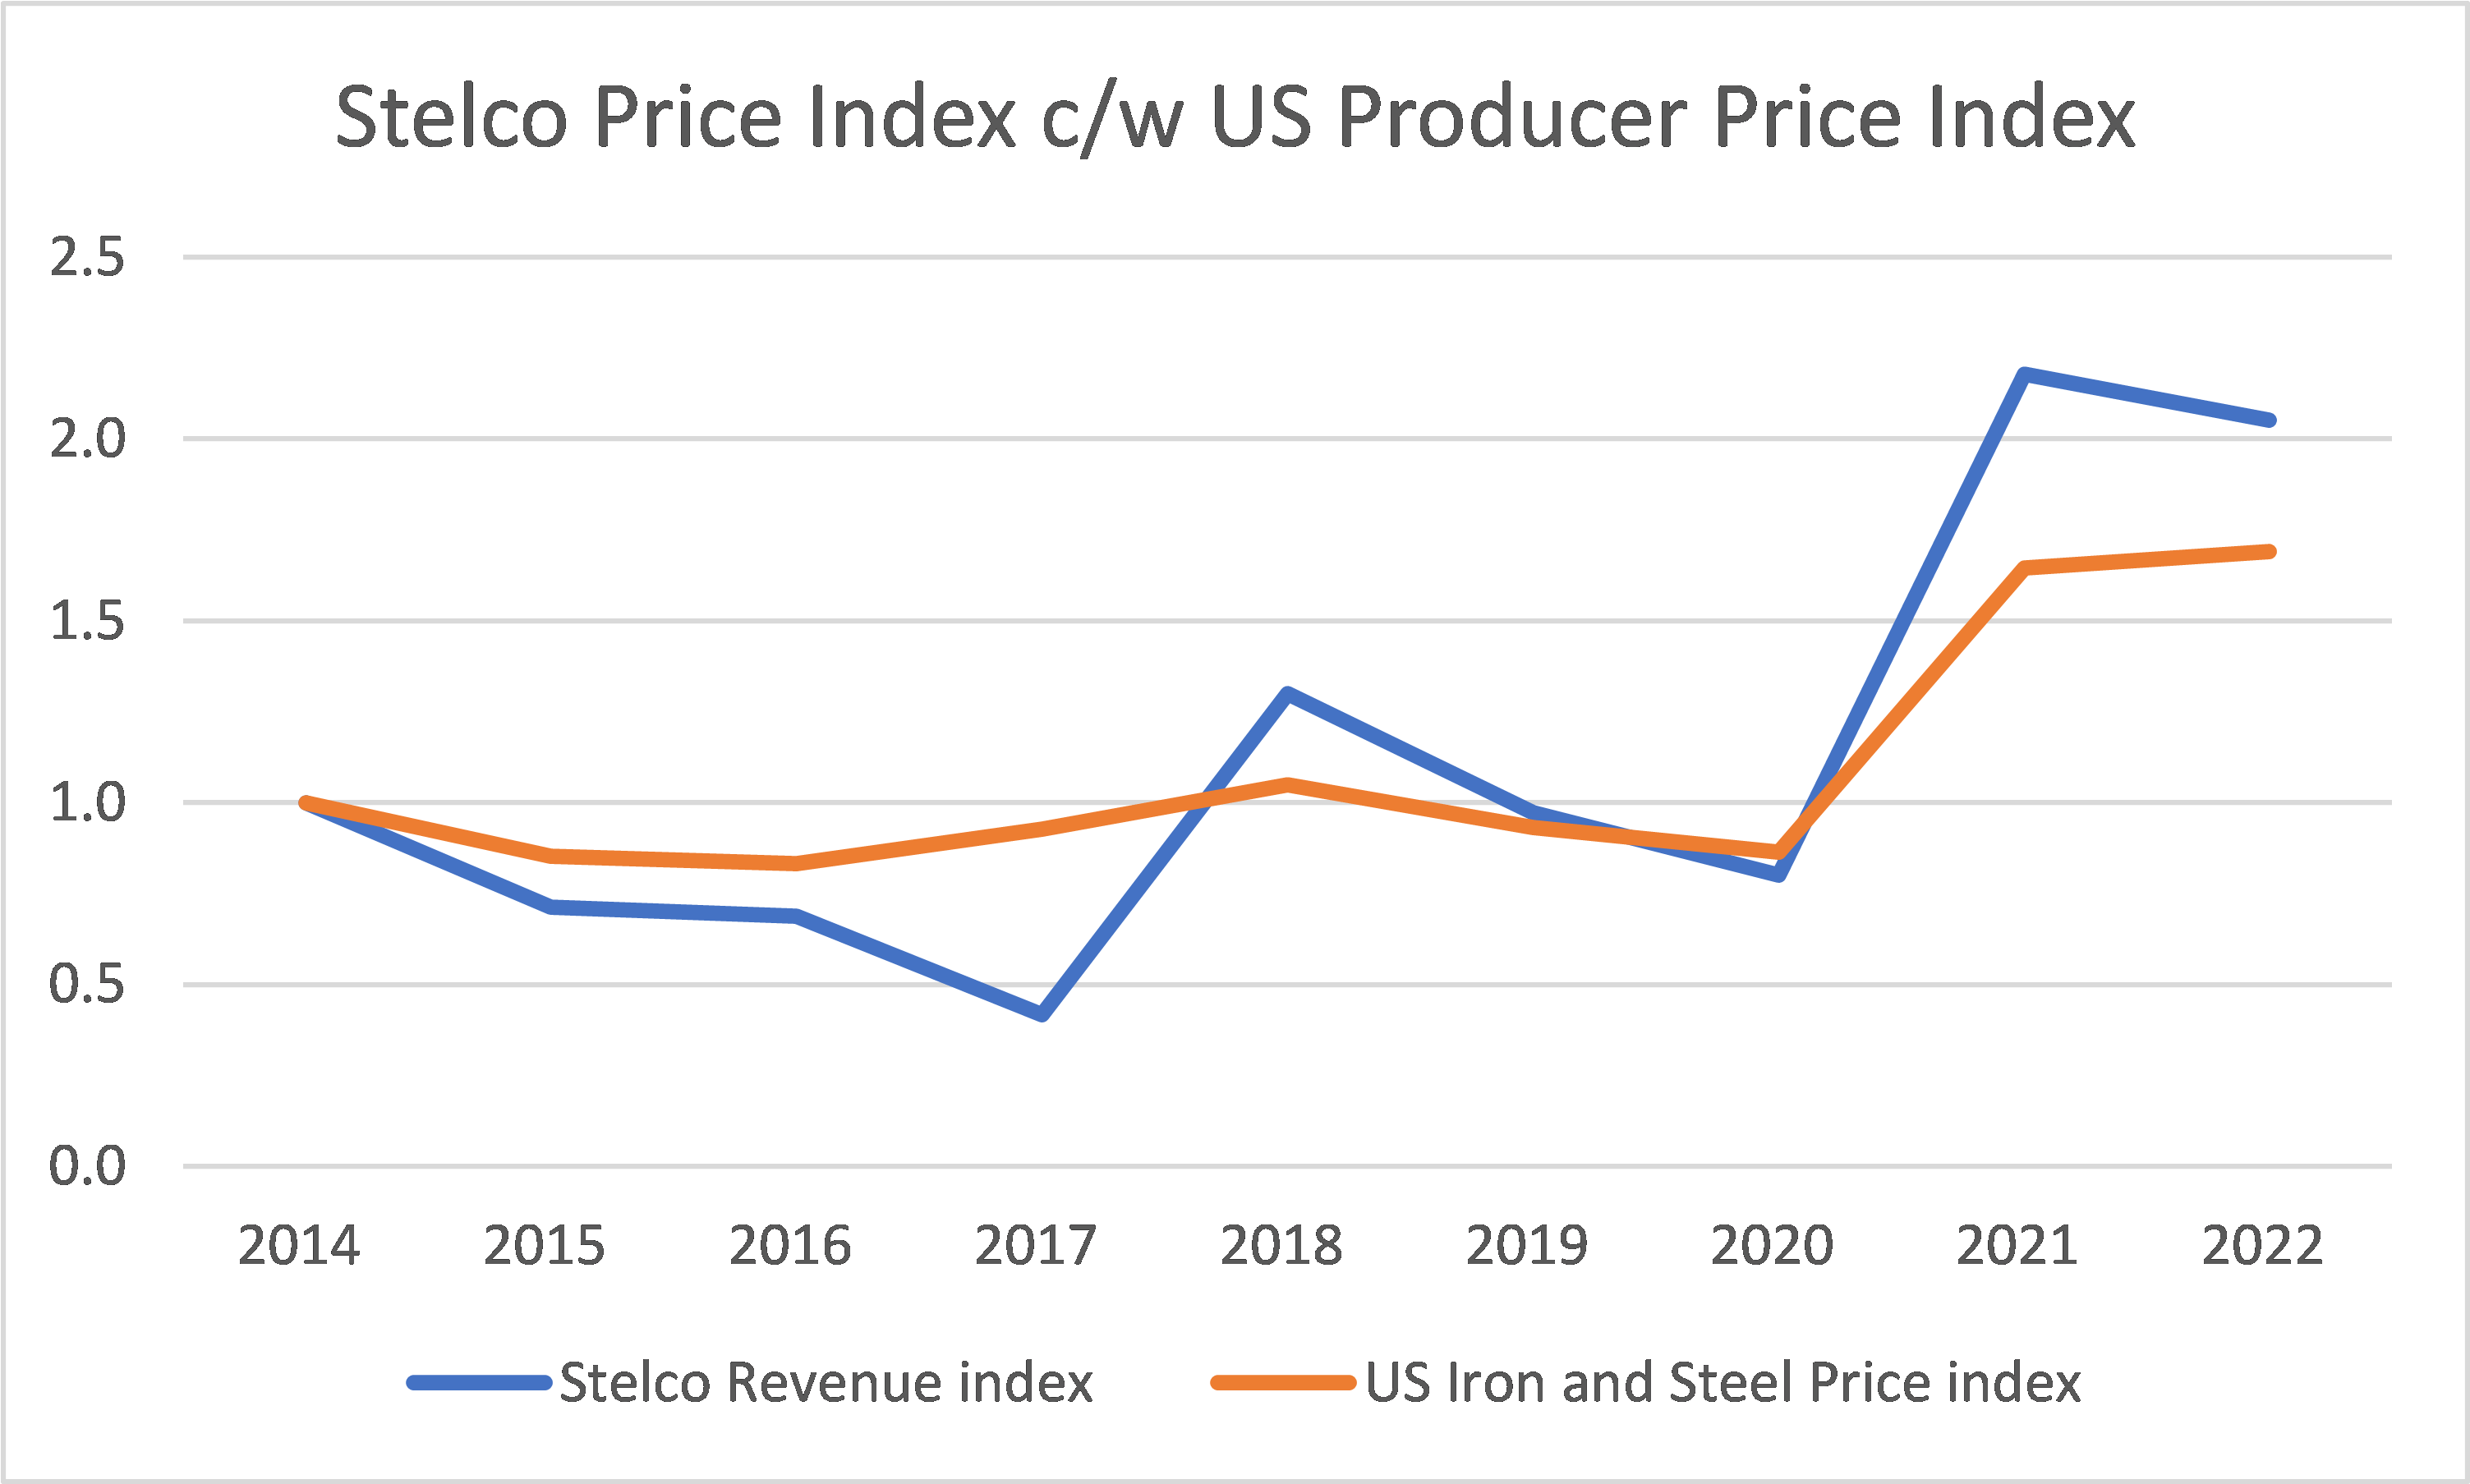
Notes to Chart 2:
1) Because of the differences in the scale, I have created an index by dividing the values for the various years by the respective 2014 values.
2) Source of Producer Price Index – FRED
3) Source of Stelco revenue – TIKR.com
Strong fundamentals
I would rate Stelco as fundamentally strong based on the following:
- It is financially sound. As of Jun 2022, Stelco had a Total Capital Employed of CAN$ 2.6 billion. About ¾ of this is funded by equity. The company is cash rich with cash accounting for about 57% of the Total Capital Employed.
- It has a good track record. Compared to the top 4 US steel companies, Stelco’s revenue growth and ROA stand out as illustrated in Charts 3 and 4.
- It has a Piotroski F Score of 8 for 2021.
While steel prices are currently in the decline, the demand is expected to grow as illustrated by the following:
…According to Kevin Dempsey of the American Iron & Steel Institute, President Joe Biden’s infrastructure plan could provide as much as 40-45 million net tons of additional steel demand over the next five years…While Fastmarkets continues to forecast that prices have farther to fall over the next year, positive underlying supply and demand fundamentals will keep prices from collapsing; contrary to what we have seen in numerous previous market cycles. Instead, Fastmarkets are forecasting annual average steel prices to remain well above long-term historical averages in the coming years… (Source: 15 Dec 2021 Fastmarkets)
Note: Stelco only shipped 2.6 million tons in 2021, so the forecast for additional steel demand is significant.
Chart 3: Stelco Peer Revenue Index (Author)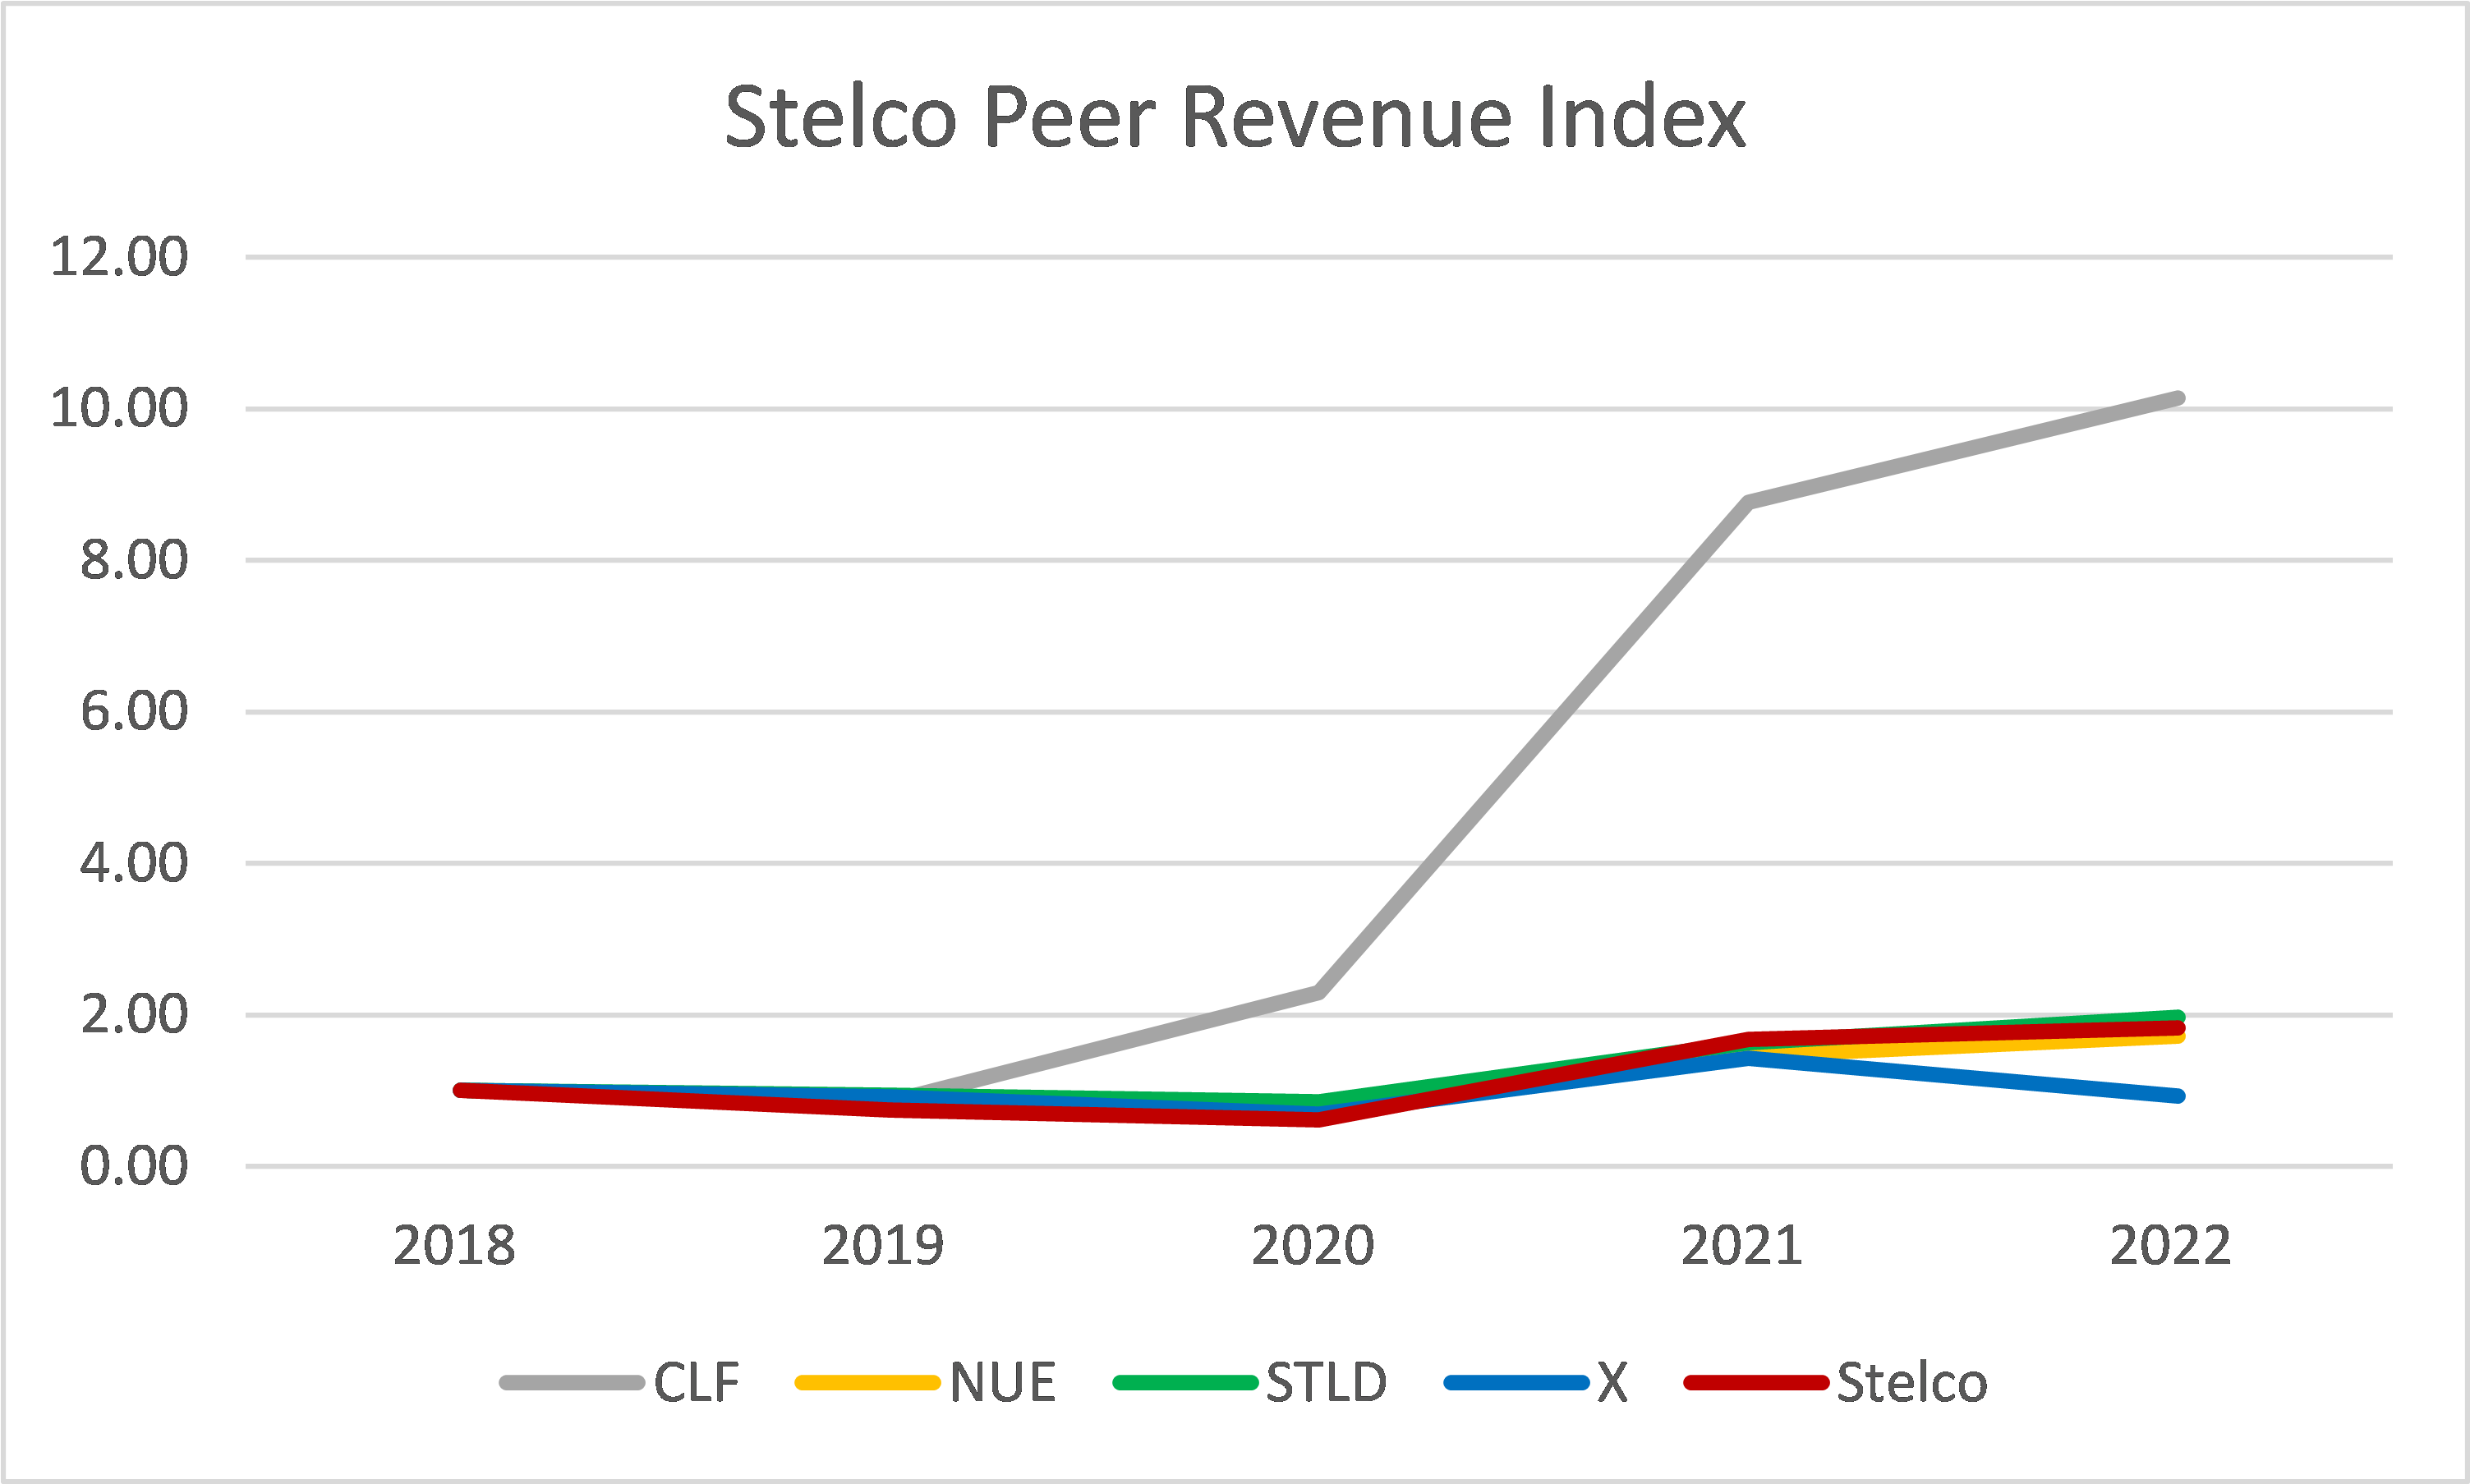
Notes to Chart 3:
1) I started the comparison from 2018 as Stelco 2017 results were not for the full calendar year.
2) 2022 is based on LTM.
3) CLF jumped in revenue in 2020/21 due to a large acquisition.
Chart 4: Stelco Peer ROA (Author)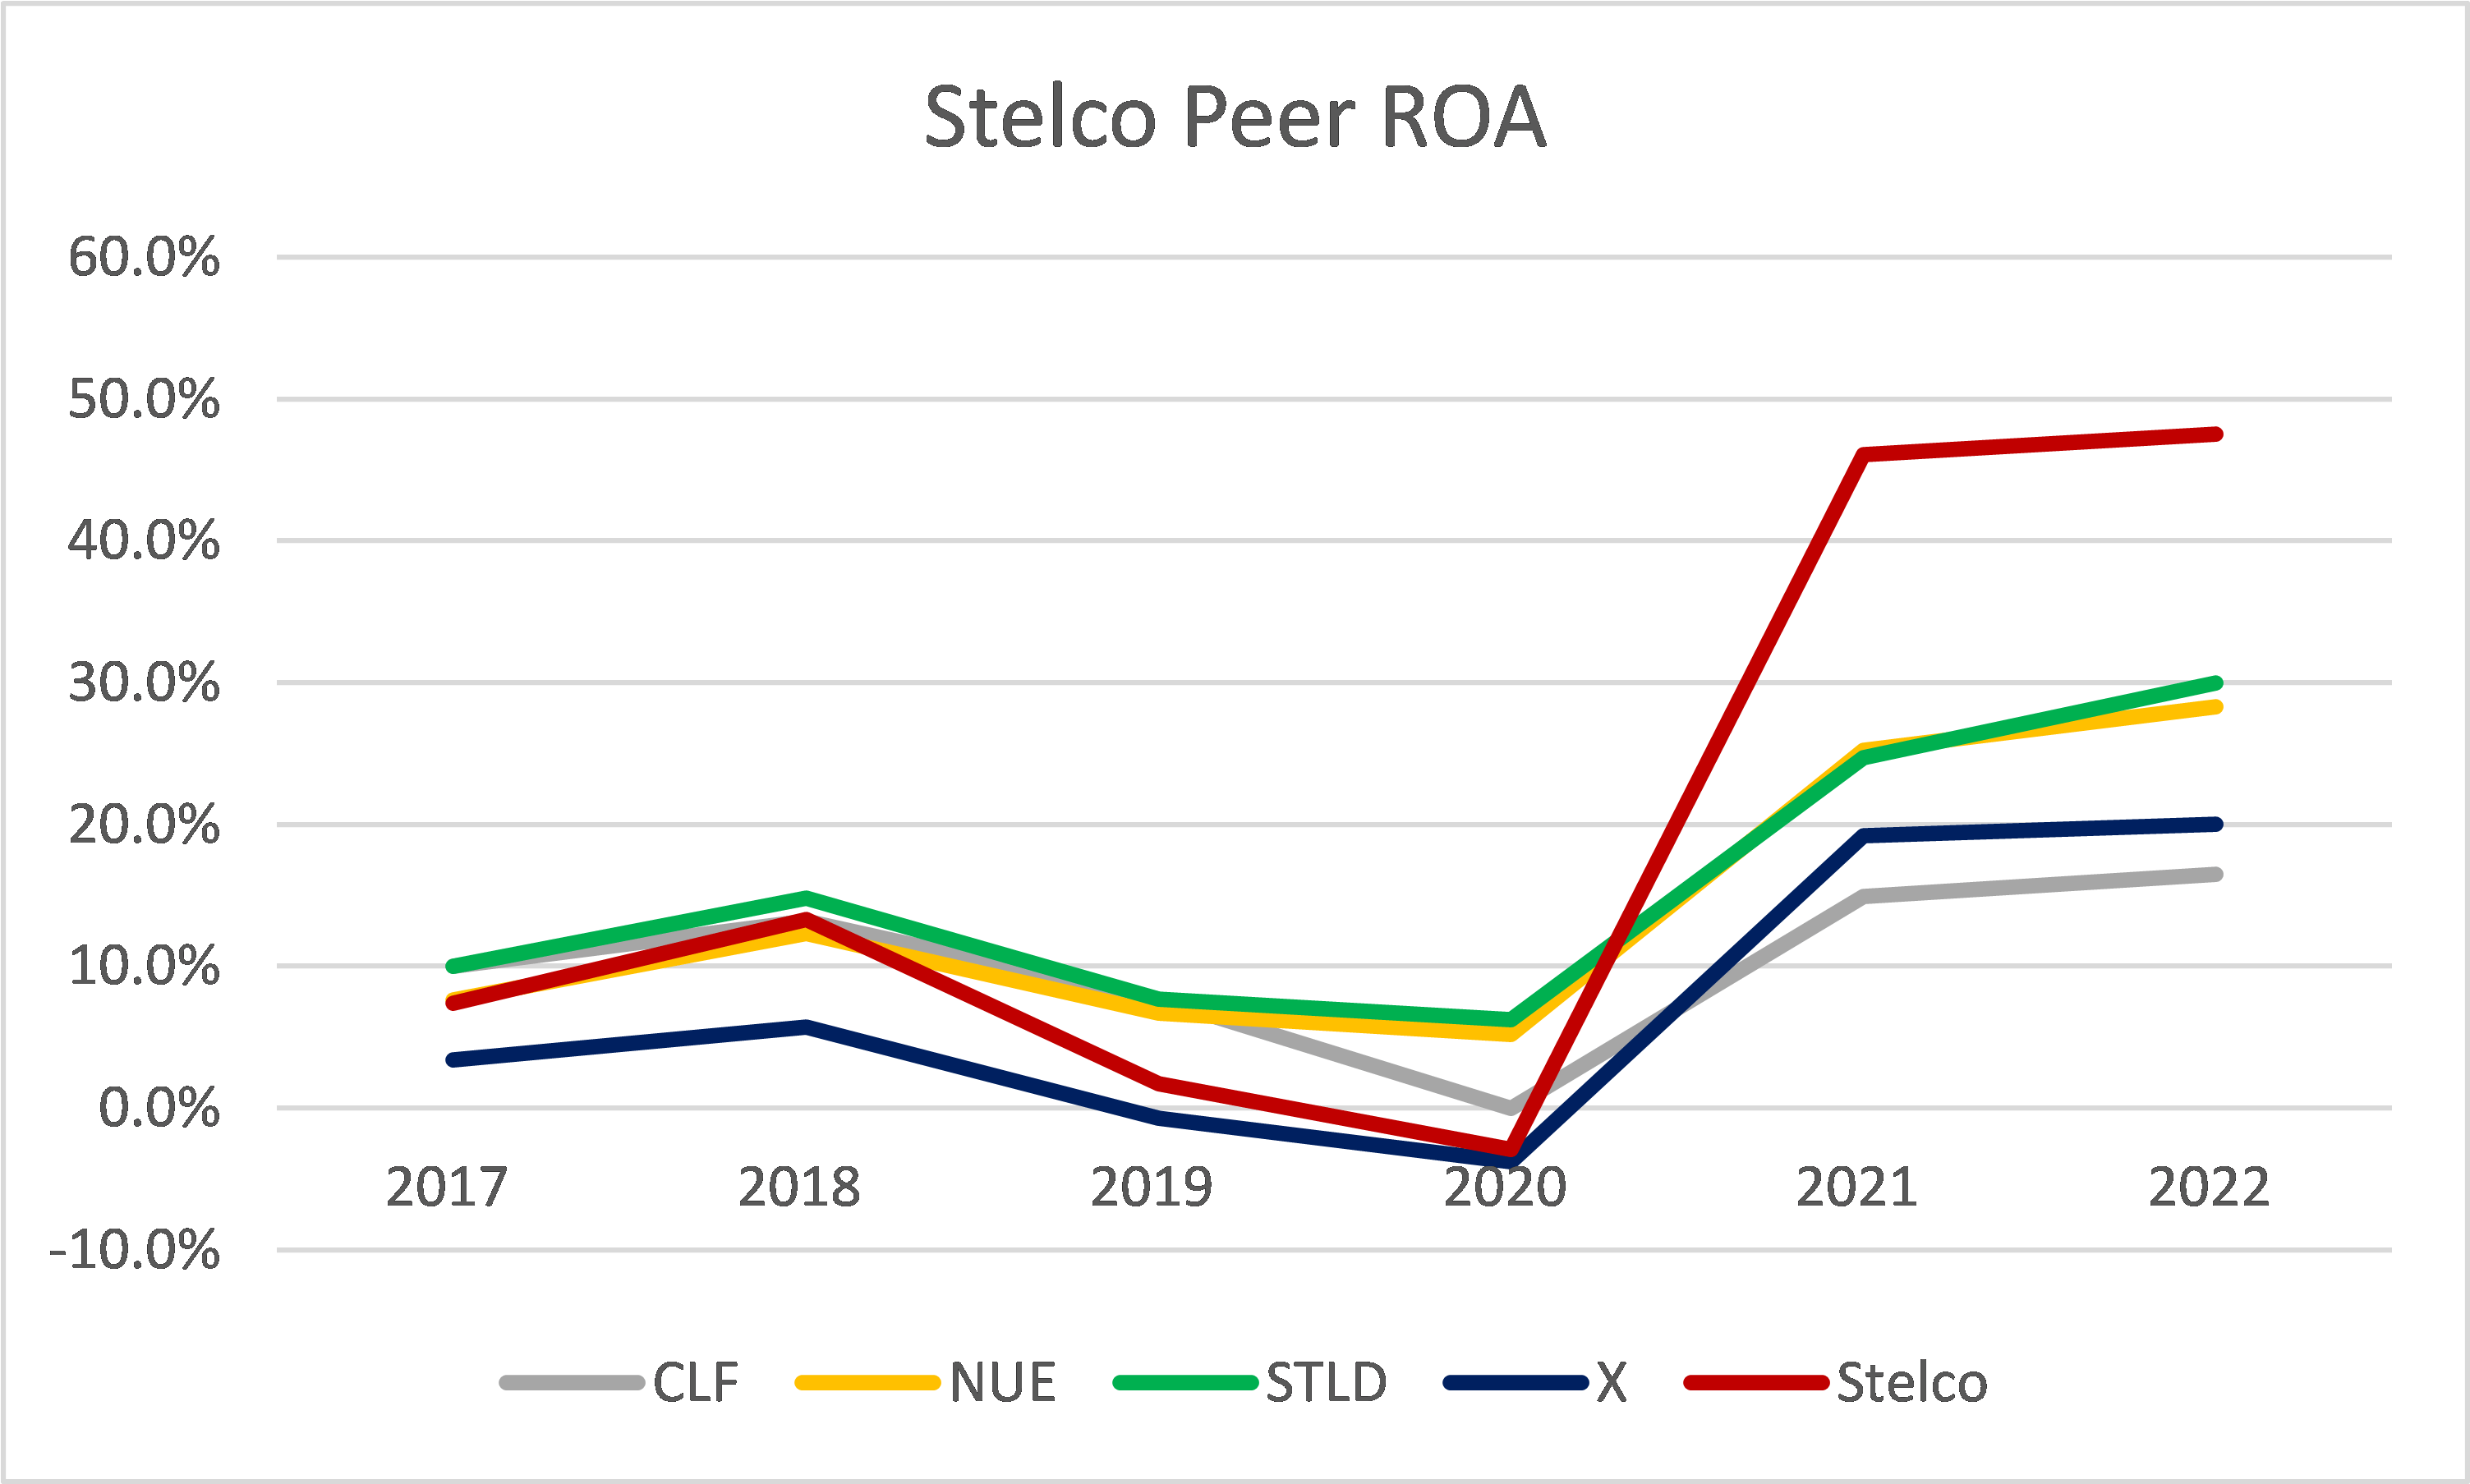
Notes to Chart 4:
1) 2022 is based on LTM.
2) Data is sourced from TIRK.com.
Valuation
I valued Stelco based on the single-stage Free Cash Flow to the Firm (“FCFF”) model. In the EPV scenario, where there is no growth, I assumed that there is no reinvestment. Thus
EPV to the Firm = FCFF/WACC
Where:
FCFF = Free cash flow to the Firm = EBIT(1-t)
EBIT = Earnings before Interest and Tax
t = tax rate = 28 % assuming that there is no tax break in the long run.
WACC = weighted average cost of capital. The cost of debt and equity was derived based on the Damodaran approach. I used a risk-free rate = 3.13 % (Canada 10 years govt bond rate), Beta = 0.98, and equity risk premium = 4.24 %.
Equity EPV = EPV to the Firm + Cash – Debt
Cash = CAD$ 1,503m as of Jun 2022
Debt = CAD$ 641m as of Jun 2022
I looked at two scenarios in deriving the EBIT:
- Conservative Scenario. This is looking at the 2018 to 2020 performance.
- Optimistic Scenario. This is the expected value with the Conservative Scenario value at 95 % probability and the 2021 value at 5 % probability.
The probabilities were guesstimates looking at the past 20 years of price cycles as per Chart 1.
The EBIT was estimated based on the EBITDA per ton data provided in the Annual Report.
EBIT = computed EBITDA + Depreciation & Amortization.
Computed EBITDA = Average EBITDA per ton X 2.6 m tons.
I have assumed that the average shipment over the cycle is 2.6 m tons based on the 2021 shipments. This not unreasonable as the company projected that it can increase its annual shipment capacity to 3 m tons without significant capital expenditure.
The computation of the EBIT is summarized in Table 1.
Table 1: Computation of EBIT (Author)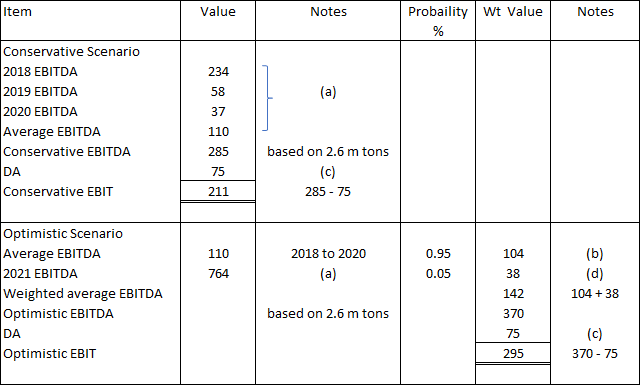
Notes to Table 1:
a) EBITDA CAD$ per ton as per Annual Report
b) 104 = 110 X 0.95
c) Average of 2020 and 2021 Depreciation and Amortization
d) 38 = 764 X 0.05
The Equity EPV computed were:
Conservative Scenario = CAD$ 42 with 10 % margin of safety
Optimistic Scenario = CAD$ 54 with 42 % margin of safety
The margin of safety was based on Stelco market price as of 9 Sep 2022 of CAD$ 38 per share.
As the company has both revenue growth and shipment tonnage growth, the EPV is a conservative approach.
Conclusion
There are 2 keys questions:
- Is the company fundamentally strong to withstand the impact of the coming downtrend in prices?
- Is there is margin of safety?
The first question is readily answered. I think part of the reason is that although Stelco had its IPO in 2017, it has a long steelmaking history, having been established in 1910. The company boasts that it has “…the newest and the most technologically advanced integrated steelmaking facilities in North America.”
The analytical challenge is determining Stelco performance over the cycle, as there was not enough published historical data.
- I assumed that the 2018 to 2020 values represented the cycle values. But 2018 to 2020 is only from one peak to the corresponding trough. I normally prefer to estimate the average cycle values based on the peak to peak for at least 2 cycles. Thus, in the case of Stelco, there is more estimation uncertainty.
- Secondly, I derived the EBIT from the per ton EBITDA data. I then assumed that the cycle shipment would be 2.6 m tons to determine the cycle EBIT. This is of course a simple approach.
Nevertheless, I believe that a 10% margin of safety based on the Conservative EPV indicates an investment opportunity. The upside and or additional margin of safety will come from:
- Shipment growth from the additional steel demand. Any valuation taking into account growth will certainly result in a higher value than the EPV.
- Higher steel prices than the historical average as opined by Fastmarkets. The Optimistic EPV shows the additional margin of safety if this happens.
- The expected extraordinary 2022 results compared to the cycle value. The LTM EPS is projected at CAD$ 25 and can be considered another margin of safety.
- Potentially higher EBIT from economies of scale. I had derived the EBIT based on the 2018 to 2020 data. During this period the average shipment was 2,360 tons compared to the cyclical shipment of 2,600 tons.
Given the above, I recommend that if you have a long-term investment horizon, invest in Stelco.
Be the first to comment