

Vladimir Zapletin
Investment Thesis
Steel Dynamics, Inc. (NASDAQ:STLD) is a steel company. Steel is a cyclical commodity and as such any analysis and valuation of STLD should be based on its performance over the cycle. Secondly, STLD has USD 2 billion in Cash + Short-term Investments. The conventional valuation approach is to include these as Non-Operating Assets based on the Book Value.
On such a basis, I estimated the Equity value of STLD to be USD 109 per share. This is equivalent to the current market price. Looking at this you should not invest in STLD.
But STLD has announced its USD 2.2 aluminum venture that would be funded internally. This meant that the USD 2 billion of Cash + Short-term Investments cannot be viewed as Non-Operating Assets.
Rather I would consider them as aluminum Operating Assets. The value of STLD is then the sum of the value of the steel operations and the value of the aluminum operations. On such a basis, the Equity value of STLD becomes USD 131 per share providing a 20% margin of safety.
The thrust of my analysis
STLD is a steel company that is venturing into aluminum. As such there are 2 key questions:
- What is the value of STLD over the steel cycle?
- What is the value of the aluminum venture?
Cyclical sector
STLD is in the cyclical steel sector. As such any analysis and valuation of STLD should be based on its performance over the cycle. Professor Damodaran provides one approach. According to him:
Cyclical and commodity companies…value is often more dependent on the movement of a macro variable (the commodity price or the growth in the underlying economy) than it is on firm-specific characteristics…the biggest problem we face in valuing companies tied to either is that the earnings and cash flows reported in the most recent year are a function of where we are in the cycle, and extrapolating those numbers into the future can result in serious mis-valuations.
This begets the question of how you “normalize” the performance. Damodaran has suggested 3 ways:
- Absolute average over time. Take means taking the average values over the cycle.
- Relative average over time. “In effect, we can average profit margins over time, instead of net profits, and apply the average profit margin to revenues in the most recent period to estimate normalized earnings.”
- Sector averages. Damodaran suggested this be used for companies with limited history or undergoing some operating changes.
I used the second approach for STLD.
Aluminum venture
The most common valuation approach is to model STLD as comprising 2 components – an operating component and a non-operating one.
- The operating component comprises the current steel operations and accounted for about USD 5.8 billion of Total Assets as of the end Sep 2022.
- The non-operating one comprises mainly Cash and Short-term Investments that amounted to USD 2 billion as of the end of Sep 2022.
The value of STLD from a firm perspective = value of Operating Assets + value of Non-operating Assets. Here I took the value of the Non-operating Assets as the Book Value.
But STLD has announced that it is venturing into the aluminum sector ear-marking USD 2.2 billion for this. This means that the USD 2 billion is no longer Non-operating Assets. Rather it is now a potential Operating Asset.
The value of STLD now becomes = value of steel operations + value of aluminum operations. The challenge is then valuing the aluminum operations.
Strong fundamentals
There are many articles in Seeking Alpha about the fundamental strengths of STLD. As such I would not go deeply into this. Rather I have summarized them as follows:
Over the past decade, STLD has achieved significant topline and bottom-line growth. At the same time, it has also been able to grow its Gross Profitability. According to Professor Novy-Marx, Gross Profitability has the same power as Price to Book in predicting returns. Refer to Chart 1. Given these performances, you should not be surprised to see growth in its ROE.
Chart 1: Performance Index (Author)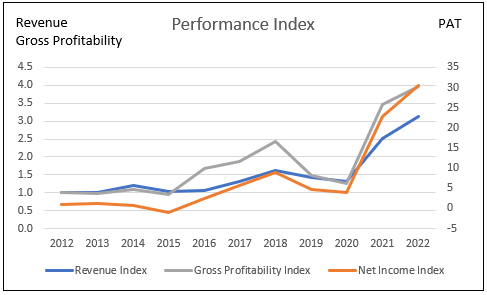
Note to Charts 1 and 2: The 2022 values were based on the Sep 2022 LTM values.
A DuPont Analysis (Chart 2) shows that its improvements in the ROE were due to growth in the Profit Margins and Asset Turnover. At the same time, there was also a reduction in Leverage. In other words, an efficient operation overall.
Chart 2: DuPont Analysis (Author)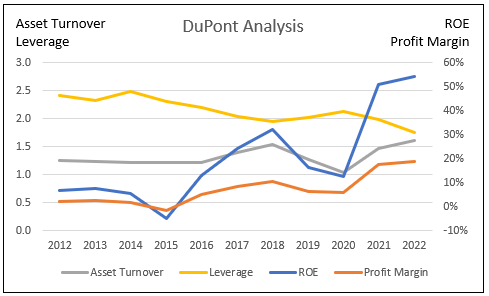
STLD also has a strong capital structure with Debt accounting for 27% of the Total Capital Employed. At the same time, about 18% of the Capital is in Cash and Short-term Investments which do not generate good returns. Refer to Chart 3.
Chart 3: Sources and Uses of Funds (Author)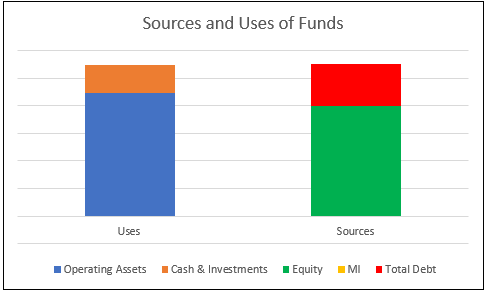
Steel cycle
Steel is a cyclical commodity as illustrated in Charts 4 and 5 where you can see the price fluctuations over the past 20 years. The past 2 years were exceptional; both the cold roll and hot roll steel prices shot up significantly higher than the historical average.
The horizontal red line in each Chart is my estimate of the historical average. I guesstimated this so that area shaded by the horizontal line is equal to the area shaded by the vertical red line as shown in Chart 4.
My analysis shows that the historical average price is equivalent to the price in 2020. I am assuming that future steel prices will follow this historical pattern (including the 2021/2022 spike). In other words, I am projecting the long-term cyclical price to be the same as those for 2020.
Chart 4: Cold Roll Steel Prices (Author based on FRED)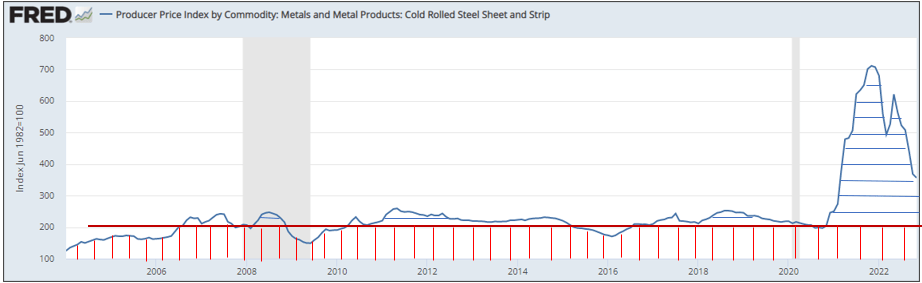
Chart 5: Hot Roll Steel Price (Author based on FRED)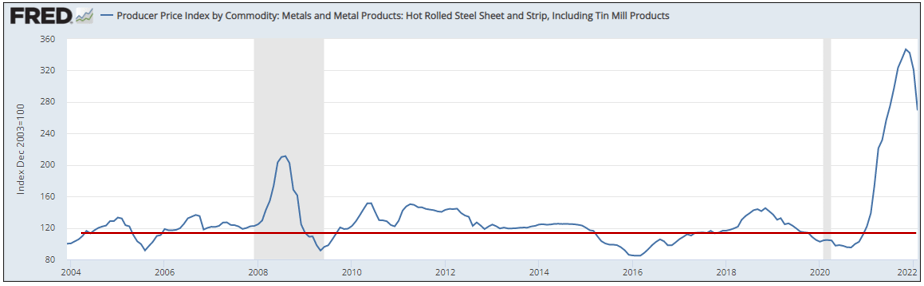
Valuation
I estimated the STLD Equity value to be USD 109 per share. To value STLD, I used the single-stage Free Cash Flow to the Firm (FCFF) model where:
Value of the Firm = Value of Operating Assets + Value of Non-operating Assets.
Value of Equity = Value of Firm – Total Debt – Minority Interests.
Value of Operating Assets = FCFF X (1+g) / (WACC – g).
Value of Non-Operating Assets = Cash + Short-term Investments, both based on Book Values = USD 2 billion.
FCFF = EBIT X (1 – tax) X (1 – Reinvestment rate).
I assumed that tax to be at a 21% nominal rate.
EBIT = Revenue X (Gross Profit margin – SGA margin).
g = growth = Reinvestment rate X Return.
Given g, we can estimate the Reinvestment rate = g / Return.
Return = EBIT X (1 – tax) / Total Capital Employed or TCE.
I estimated the TCE by determining the TCE/Revenue ratio X Projected Revenue.
WACC = weighted average cost of capital obtained from the first page of a Google search of the term “STLD WACC”. Refer to Table 1.
Table 1: Estimating the WACC (Author)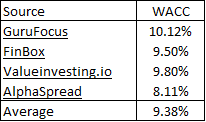
Estimating Equity Value
We know that steel prices fluctuate over the steel cycle with the average price equal to that in 2020. In 2020 STLD shipped 10.7 million tons of steel to achieve USD 9.6 billion in revenue. The average 2020 steel price is then = USD 9.6 billion / 10.7 million tons = USD 897 per ton. Refer to Note c in Table 2.
The projected steel capacity over the cycle is 16 m tons of steel. Assuming the 2017 to 2022 capacity utilization, I estimated the shipment tonnage over the cycle to be 14.6 m tons. Given the USD 897 per ton price over the cycle, I estimated the Revenue over the cycle = USD 13 billion. Refer to Note g in Table 2.
I took the average 2004 to 2022 Gross Profit margins and SGA margins as the margins over the cycle. With these, I could then calculate the EBIT. Refer to Note l in Table 2.
For the growth rate, I assumed that it was equal to the long-term GDP growth rate of 5%. This is a reasonable estimate as it is lower than STLD’s actual shipment rate. In its Nov 2022 Investor Presentation, STLD reported shipping 5.8 m tons in 2012 compared to 11.2 million tons in 2021. This is equal to a 7.6% CAGR.
Given the growth rate, I then estimated the Reinvestment rate. Refer to Notes in Table 2. With the Reinvestment rate and the EBIT, I then estimated the FCFF incorporating growth.
I hence determine the value of Equity as USD 109 per share. Refer to Table 2 for the computation and assumptions. Given the market price of USD 109 per share (as of 14 Dec 2022), there is no margin of safety.
Table 2: Calculating the Equity Value (Author)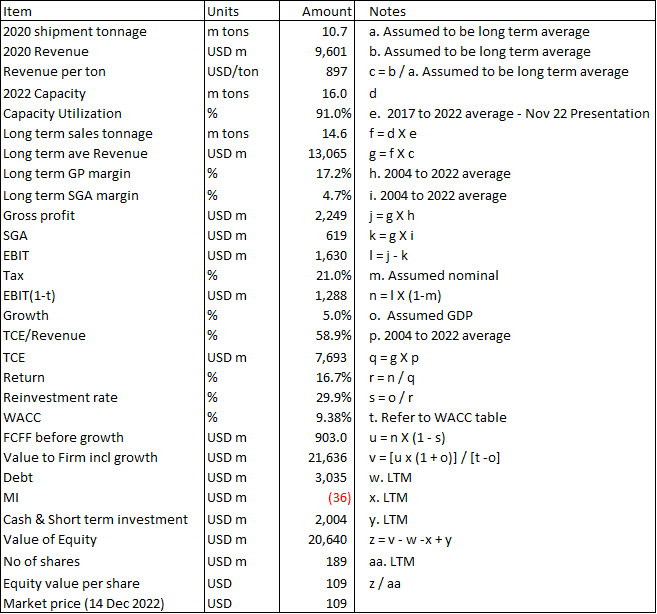
Value of STLD with the Aluminum venture
This USD 109 per share comprises of USD 98 per share for the Operating Assets and USD 11 per share Non-Operating Assets. The Non-operating Assets comprise Cash and Short-term Investments. These amounted to USD 2 billion which I have taken as the Book Value in my valuation.
But STLD had announced its plan to venture into the aluminum sector with a USD 2.2 billion investment using internally generated funds.
In other words, the USD 2 billion of Cash + Short Term investments are no longer Non-Operating Assets. Rather they are to be deployed as Operating Assets which STLD projected to earn “USD 650 to 700 million in through cycle EBITDA”. (Source: STLD Nov 2022 Investor Presentation)
The challenge then is determining the value of this USD 2 billion. I assumed that the aluminum venture would achieve the same operating efficiency as the steel operations. Based on this I could then use the steel operations ratios to convert the EBITDA to EBIT and then to FCFF.
Assuming the same 5% growth rate, I then estimated the Equity value of the aluminum venture. The details of my computation are shown in Table 3.
By deploying USD 2 billion, the Equity value of STLD would increase from USD 109 per share to USD 131 per share. Compared to the market price, there is now a 20% margin of safety.
Table 3: Estimating the value of the aluminum venture (Author)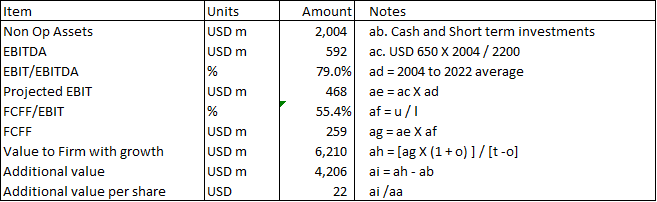
Note to Table 3: Some of the items in the Notes refer to those in Table 2.
Limitations and risks
When you consider my analysis and valuation, you have to bear the following in mind.
- I used the steel shipments to represent the whole STLD business.
- I used the 2020 price as the long-term steel price.
- There is potential for the long-term WACC to be lower.
- I assumed the aluminum venture would have the same operating ratios as the steel operations.
STLD has 3 business segments – steel operations, steel fabrication, and metal recycling. In 2021, the steel operations accounted for 73 % of the group revenue. In my valuation model, I assumed that the group business is represented by the steel operations shipment tonnage. The better approach is to do a sum-of-parts valuation for the 3 business segments. Unfortunately, there is not enough Gross Profit and SGA data to enable this.
The average ROA for the past 3 years for the business segments are as follows:
- Steel operations – 27%.
- Steel fabrication – 30%.
- Metal recycling – 6%.
Looking at the ROA, I would say that using the steel operations tonnage to represent the whole STLD business would result in a higher valuation.
My second point is about determining the long-term cyclical steel price. I have chosen 2020 cold roll price as the representative year. If you look at Chart 4, you could argue that 2016 could be a better representation. If so, then the average steel price is lower resulting in a lower cyclical Revenue and lower Equity value. This means that the USD 131 per share is on the high side.
Thirdly, the WACC was assumed to be 9.38%. In deriving these, many of the sources used the current risk-free rate. I am looking at the 2004 to 2022 period to determine the cyclical values for the various valuation parameters. For consistency, I should also l use the WACC over the same period.
Furthermore, the average risk-free rate over the 2004 to 2022 period would be lower than the current rate. At the same time, instead of using the current risk premium, we should also use the risk premium over the cycle. My point is that the WACC used is probably on the high side. If I factor this in, my current valuation is on the low side.
The final point is whether the aluminum venture would achieve the same operating efficiency as the steel operations. I guess a better approach would be to use the aluminum sector average as the input. My argument against this is that in the steel sector, STLD has one of the better-operating results. Using the average aluminum sector average may not do justice to the management track record. I guess to handle this, we should seek a higher margin of safety.
The general picture is that the USD 131 per share Equity value is probably an optimistic one.
Conclusion
The conventional valuation approach is to add the value of the Non-operating Assets to the value of the Operating Assets. The Non-operating Assets for STLD comprise Cash and Short-term Investments amounting to USD 2 billion.
In the case of STLD, the conventional valuation approach would result in an Equity value of USD 109 per share. This is valuing the Non-operating Assets at Book Value. Given the market price of USD 109 per share, there is no margin of safety.
But the company had announced its plan to venture into the aluminum sector using internal funds. Effectively the Non-Operating would be “transformed” into Operating Assets. Any valuation of STLD would then be based on the value of the steel operating assets + the value of the aluminum operating assets.
On such a basis, I estimated the Equity of STLD to be USD 131 per share. Compared to the market price, this would provide a 20% margin of safety.
However, my Equity value of STLD is likely to be on the high side. Given this, I would target my entry price based on a 30% margin of safety i.e. USD 100 per share or lower.
The key point about my valuation is that you must value STLD as the sum of the steel operations and the aluminum operations. Sure, we can debate about the assumptions used. But it would be a mistake to treat the Cash + Short Term Investments of USD 2 billion as Non-operating Assets.
Editor’s Note: This article was submitted as part of Seeking Alpha’s Top 2023 Pick competition, which runs through December 25. This competition is open to all users and contributors; click here to find out more and submit your article today!
Be the first to comment