

Monica Schipper/Getty Images Entertainment
State Street Corporation (NYSE:STT) is one of the largest global asset management firms with over $3.48 trillion in assets. STT has clients in 57 countries and over 2,100 institutional clients. If STT sounds familiar, you have probably seen their ETFs, as this is the asset management firm behind the SPDR indexes. SST’s SPDR S&P 500 Trust (SPY) is often regarded as the benchmark when tracking the S&P 500 index. In addition to managing a large portfolio of ETFs, STT works with employers to manage global pension funds and retirement accounts, providing products and management services for endowments and foundations. STT also partners with countries to implement monetary policy, central banks, and sovereign wealth funds.
I have had STT on my watchlist, and I missed the opportunity to add STT to my dividend account during the Covid crash. The volatility in 2022 has created some attractive long-term opportunities, and STT has fallen -25.78% YTD placing its yield above 3%. STT has declined by -33.16% since its 52-week highs, and when I compared STT to T. Rowe Price Group (TROW), and BlackRock (BLK) it looked undervalued. I believe the recent decline is creating a solid entry point for investors who missed prior opportunities to add one of the largest asset managers to their portfolio.
Seeking Alpha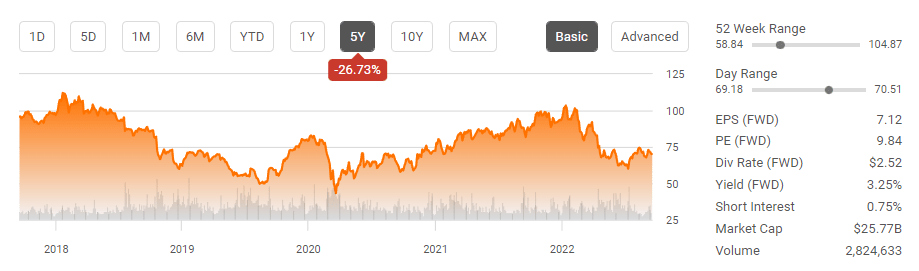
State Street’s EPS and Revenue have grinded higher, indicating that shares could be attractive
Using the trailing twelve months to represent the fiscal year 2022, STT has steadily trended upward on its revenue per share and EPS numbers. Over the past 5-years, STT has seen its EPS increase by 39.16%, from $5.26 to $7.32. In this period, there has only been 1 YoY decline in EPS, and that came in 2019. When I switch my focus to revenue per share, STT has simulated the trajectory of its EPS, as revenue per share has increased by $3.32 per share or 11.05% over the past 5 years.
Steven Fiorillo, Seeking Alpha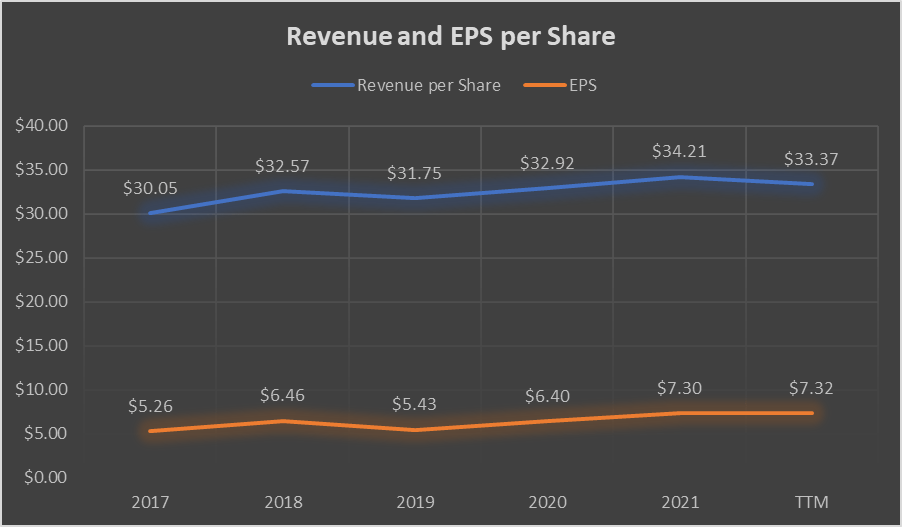
STT has beat earnings expectations in each of the previous 4 quarters. STT is projected to earn $7.12 in EPS for 2022, and see a significant increase in 2023. These estimates would create a YoY decline of -2.73% compared to FS 2021, but in 2023, STT’s EPS would increase by 20.08% ($1.43). Looking at the high side for EPS estimates, STT is projected to earn $7.34 in 2022 and $9.40 in 2023. If STT beats earnings estimates and comes in on the high side, it could generate a 3.09% YoY increase in 2022 for EPS and another 28.07% in 2023.
STT is projected to have a forward P/E of 9.84 for 2022 and 8.20 for 2023. If earnings estimates are in-line with the consensus, the level of EPS generated would be larger than its forward P/E multiple. I see this as a mispriced stock, and STT is currently trading at levels that are enticing, in my opinion. EPS has grinded higher and is projected to increase significantly in 2023, regardless if you’re using the consensus or high-side estimates. The last time STT missed the consensus estimate on EPS was Q4 of 2018, creating a 13 consecutive quarter streak of beating estimates. Based on this track record and how 2023 indicates STT’s trendline moving higher, I think this could be an indication that shares could rebound in the future.
Seeking Alpha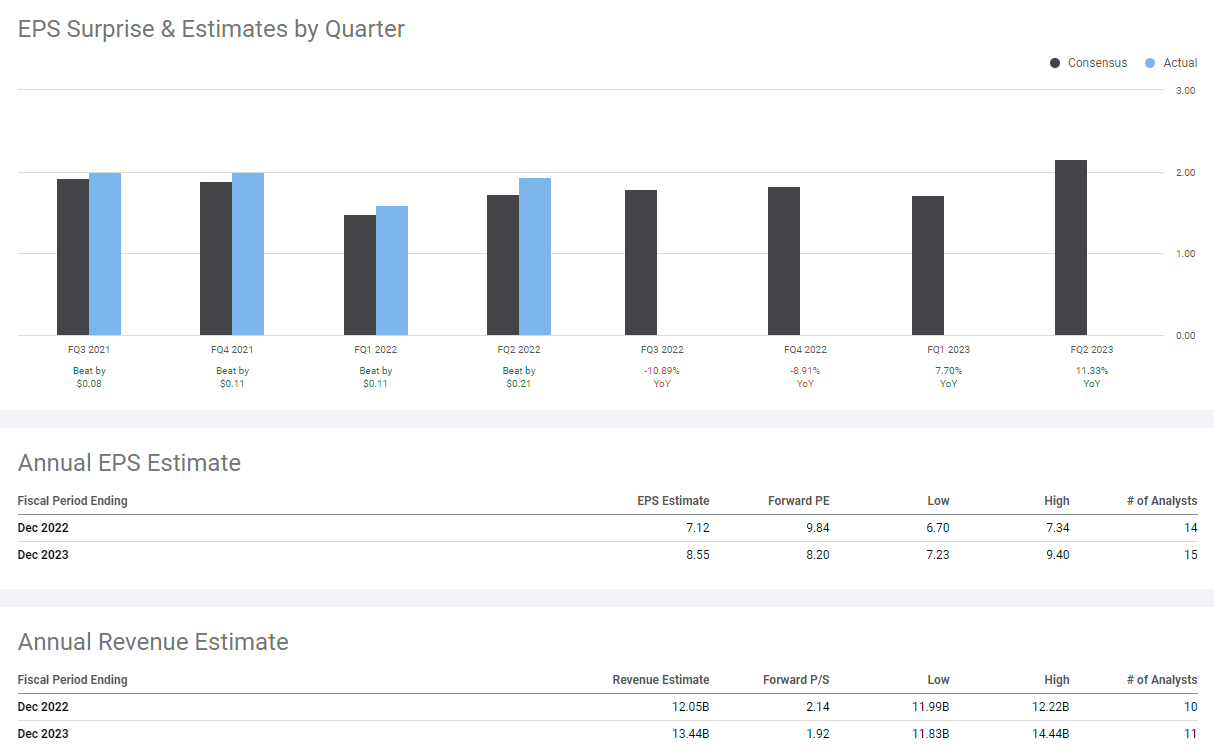
I compared State Street to T. Rowe and BlackRock and the numbers indicated that State Street was undervalued
I wanted to see how STT trades compared to its peers prior to making any decisions. While Vanguard is a private company, TROW and BLK are public so I was able to grab some numbers off their financials to conduct a comparison. STT trades for $70.10 with a market cap of $25.77 billion, while TROW trades at $110.13 with a market cap of $24.86 billion, and BLK trades at $626.74 with a market cap of $94.49 billion. I compared STT, TROW, and BLK across their P/E multiple, price to book (P/B) ratio, price to tangible book (P/TB), discount to P/B and P/TB, equity to market cap ratio, and dividend yields.
STT trades at the lowest P/E multiple of the group, with a 9.58 P/E. Even though this is a slow growth sector in regards to revenue, I think a single-digit P/E for STT is far too low considering some of the valuations companies are trading for today.
Steven Fiorillo, Seeking Alpha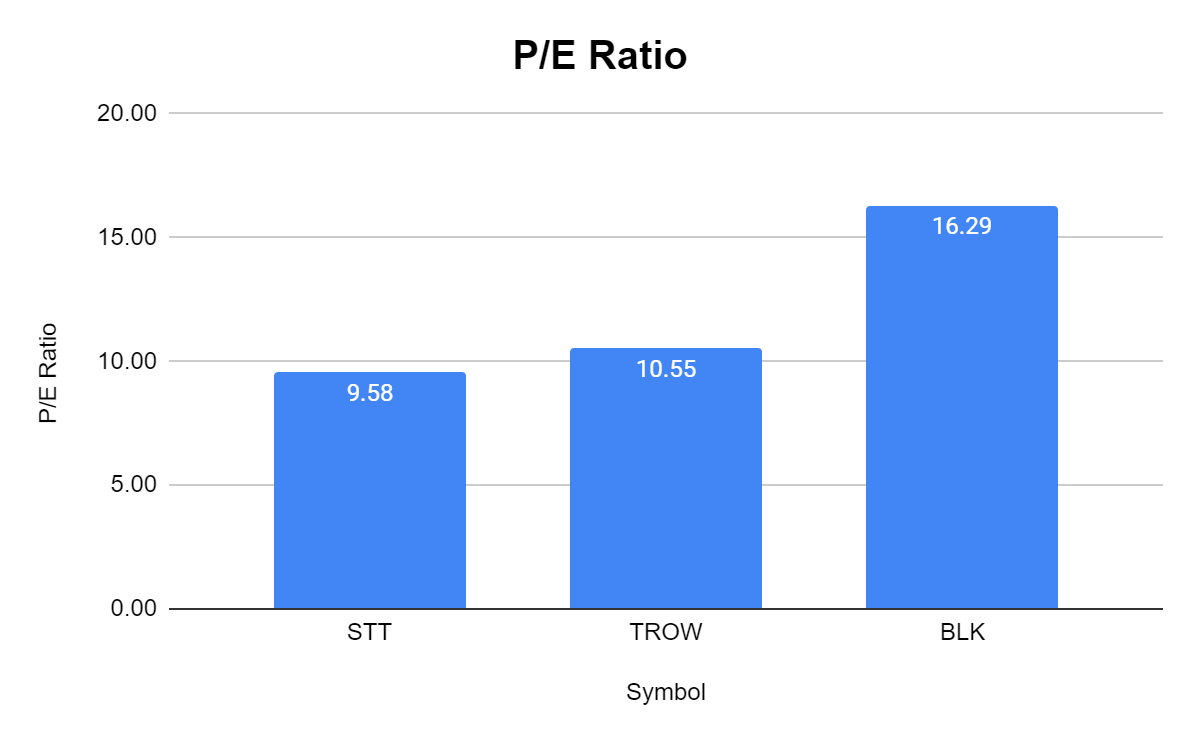
What was interesting to me was how much less the market has valued STT based on its book and tangible book metrics. STT trades at a 1.08 P/B while both TROW and BLK trade at more than a 2.5x valuation.
Steven Fiorillo, Seeking Alpha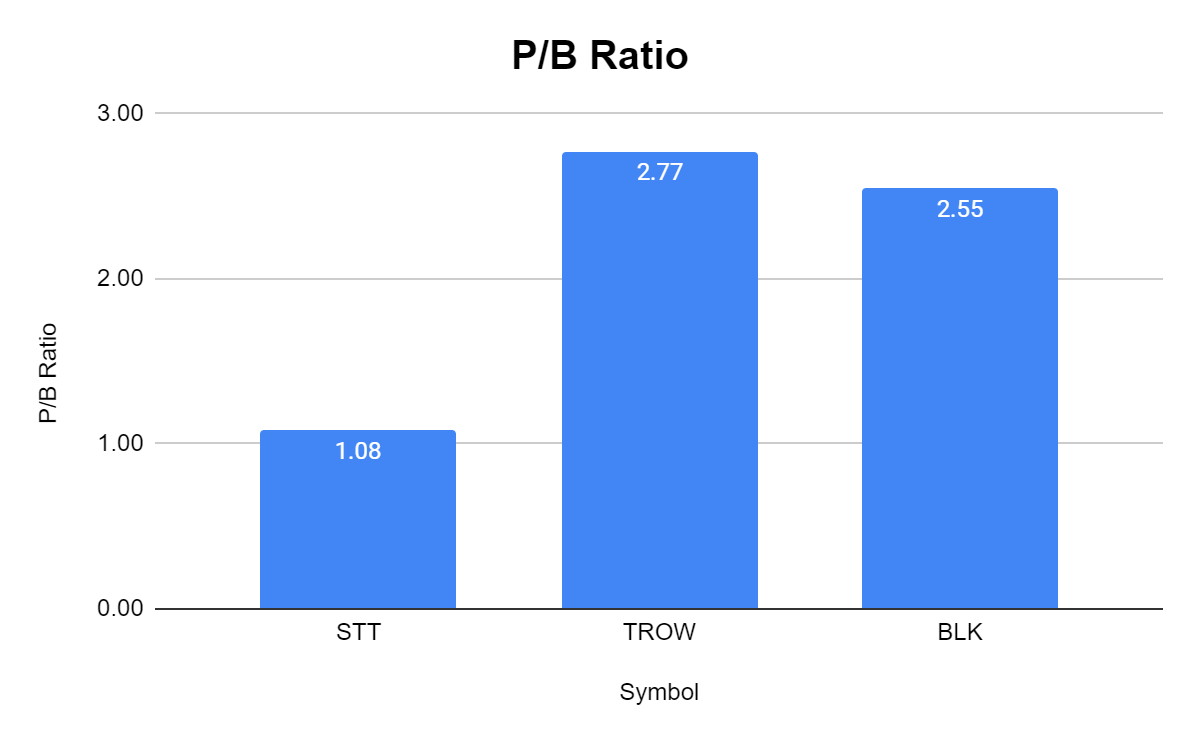
STT trades at an 8.31% premium to its book value of $64.72. BLK trades at 155.10% premium, while TROW trades at a 177.34% premium.
Steven Fiorillo, Seeking Alpha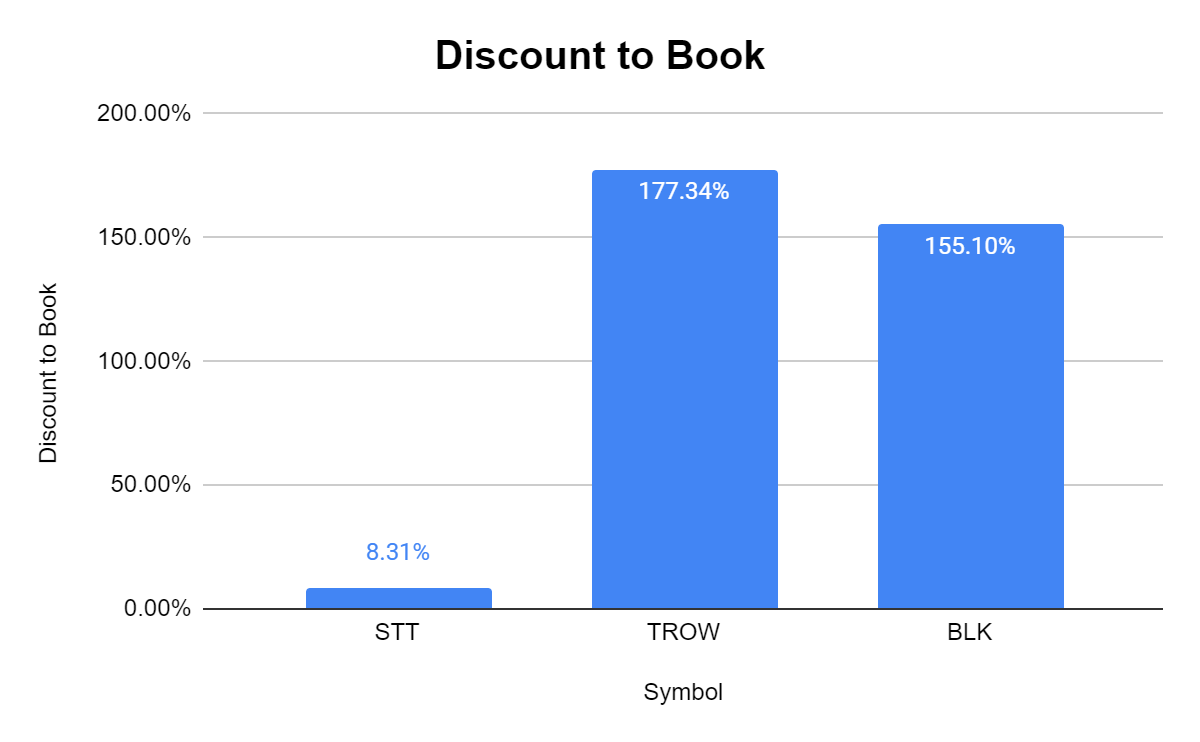
I checked the discount to tangible book value several times because I didn’t believe what I was seeing. BLK has a tangible book value of $22.30 per share, placing its premium on tangible book value at 2,710.49%. TROW trades at a 355.84% premium to tangible book value, and STT trades at a 75.65% premium. STT looks significantly undervalued based on the premiums that TROW and BLK trade.
Steven Fiorillo, Seeking Alpha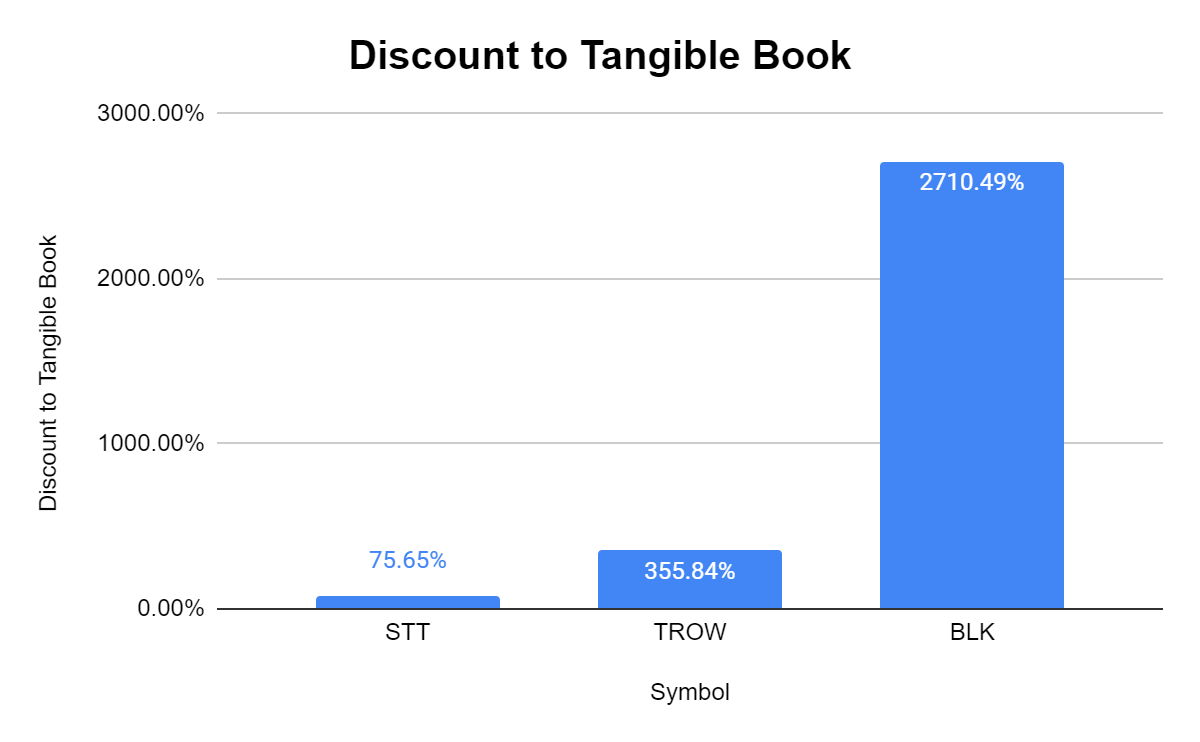
Of these three companies, STT is the only one that isn’t given a premium on its equity. STT has $25.77 billion of equity on its balance sheet, and its market cap is $25.77 billion. It trades at a 1:1 ratio. TROW has 0.39x its market cap in equity, and BLK has 0.41x its market cap in equity. Both TROW, and BLK trade at significant premiums to the total equity on their balance sheets.
Steven Fiorillo, Seeking Alpha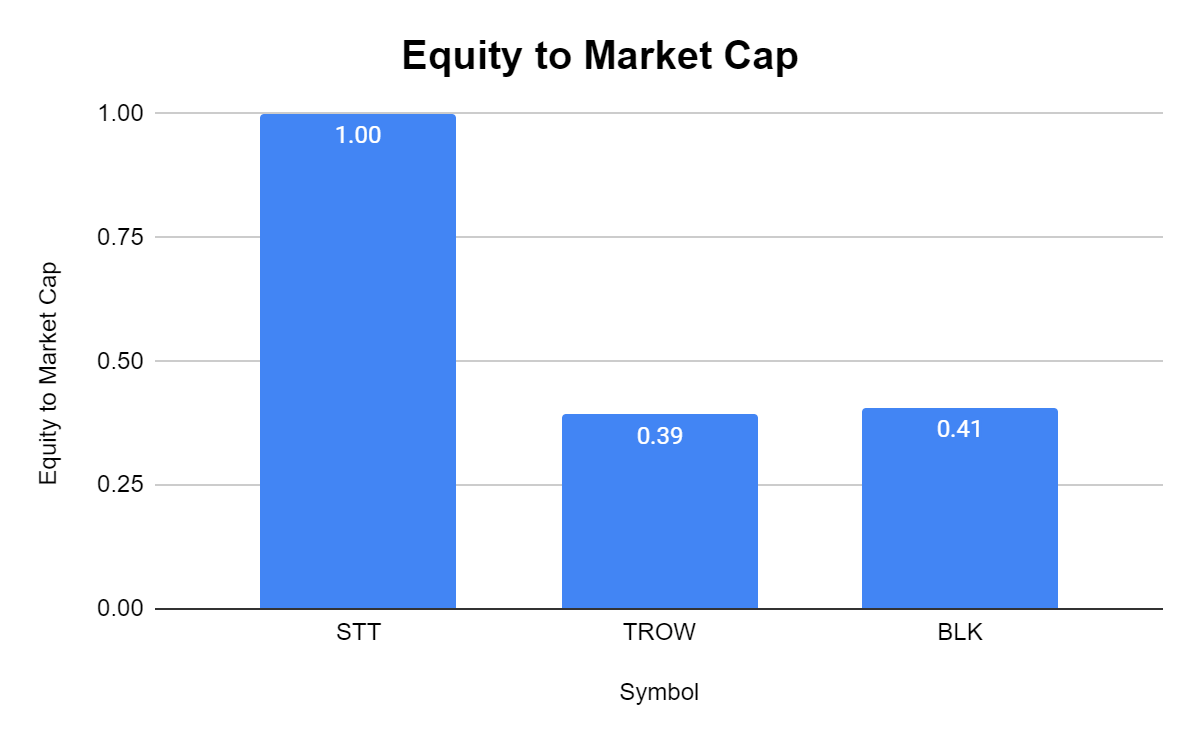
All 3 companies have a robust dividend that is significantly larger than what can be found in a standard index or total market fund. STT has a 3.59% yield compared to BLK’s 3.11%, and TROW’s 4.36% yield.
Steven Fiorillo, Seeking Alpha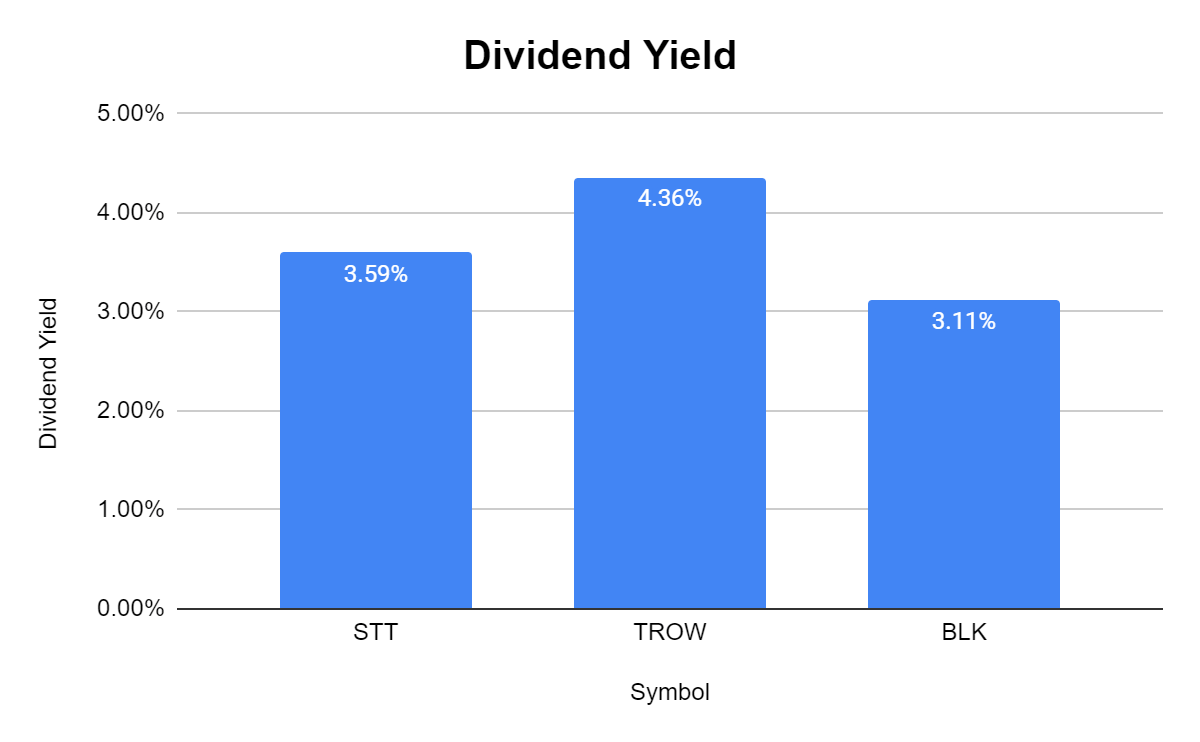
STT has been a dividend growth gem
STT’s dividend can be traced back to the 1990s and has a solid history of dividend growth. Every financial institution fell on hard times during the financial crisis, so I won’t hold the dividend reduction in 2009 against them. The real story is how they were able to navigate through hard times, and once again implement a dividend growth policy.
STT has increased its annual dividend for 11 consecutive years and provided investors with more than 2 decades of dividend payments. Today, STT’s dividend is $2.52 per share, placing its forward yield at 3.59%. STT has a payout ratio of 30.28%, which suggests that there is more than enough room for dividend increases in the future. STT’s dividend has a 5-year average growth rate of 8.45%. I think that STT is a buy in any dividend portfolio with a yield that exceeds 3% as you’re getting a quality company that should continue growing its dividend for years to come.
Seeking Alpha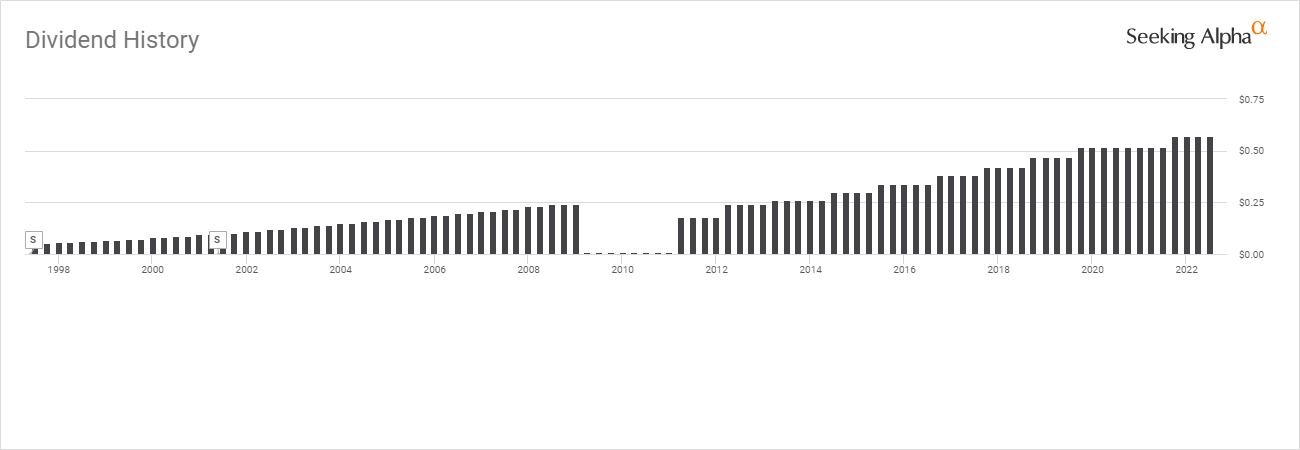
Conclusion
STT is getting very close to coming off my watchlist and finding a way into my dividend portfolio. I think shares have fallen more than they should have, and the decline will be short-lived. STT is projected to have a strong 2023 and has established a long track record of beating earnings estimates. When the markets rebound, I can see STT going back to $90 – $100 per share as the comparison between STT, TROW, and BLK indicates that shares of STT are undervalued. I am planning to add STT sometime in the next several weeks, depending on how the markets absorb the news coming out of the Fed as this is a dividend growth company I want to own.
Be the first to comment