

Joe_Potato/iStock via Getty Images
Intro
When we last wrote about Star Group, L.P. (NYSE:SGU) (Heating oil & Propane provider) in November of last year, we discussed the company’s very attractive dividend yield as well as the aggressive buybacks which continue to bring down the number of shares outstanding sharply. There are now under 37 million shares outstanding and the forward dividend of $0.61 per share now equates to a yield of almost 6.5%. In saying the above, shares have declined more than 16% since we penned that piece approximately seven months ago. Long-term investors though will not mind this as long as SGU’s profitability & free cash flow can stabilize if not increase over the long haul. This will ensure that shareholders will continue to get rewarded handsomely due to significantly higher yields in due course. In the present high inflation environment, this is much easier said than done though as we see below.
Q2 Earnings
Well if we look at the company’s recent second quarter, we see that sales increased by a whopping 30% to hit $782.5 million but gross profit, as well as net profit both, decreased over the same period of 12 months prior. Suffice it to say, although better pricing led to a significantly higher top-line print, lower volumes and higher costs overall led to less profit over a rolling quarterly basis. This is essentially the problem in this industry in that as prices soar higher, customer churn also increases as buyers become much more selective. Furthermore, you also have elevated operating costs in areas such as bad debt and credit card fees as customers struggle to pay the higher tariffs in this new normal. From SGU’s perspective, it is all about ensuring that strong fuel margins are there on the front-end and then working tirelessly on the back-end to ensure churn levels are at an absolute minimum and overheads continue to come down.
Smart acquisitions (which the company continues to undergo) also are vital to ensure SGU’s competitive position remains at the forefront in this industry. These endeavors ensure SGU will be better able to cope with the trading conditions the company is witnessing at present. In these conditions, price is a far more sensitive metric to buyers which is why Star Group’s value proposition and customer experience must be evident in spades to ensure the firm can distance itself from the competition somewhat.
Dividend Ramifications
From a dividend standpoint, although free-cash-flow trends improved in the second quarter, this key profitability metric came in at -$1.14 per share in Q2. SGU’s cash-flow statement really shows the ramifications of the price volatility in the present market as over $80 million of net profit in the quarter resulted in a mere -$40 million of operating cash flow. Accounts receivables & short-term borrowings both grew by over $80+ million in Q2 as working capital requirements rose significantly. This means (at present) fresh external debt (which was issued in the first two quarters of this fiscal year) is essentially paying the dividend. Going forward, it will be interesting to see if liquidity continues to be an issue as cash flows will be adversely affected if this indeed remains so. Furthermore, negative free-cash-flow numbers, if they persist (Which is not normal for SGU) may mean that the company may become less aggressive with share buyback repurchases to consolidate cash.
Valuation & Technicals
With respect to the company’s valuation, SGU’s trailing earnings yield surpasses 17% but this yield really is subjective unless the company can begin to start generating cash once more. From a technical standpoint, as we can see below, shares have very strong support at the $9 level and then even stronger support below this. The question then becomes (if indeed shares drop to these support levels) if investors will enter in here on mass if extreme volatility persists. Historically, it would be the correct decision but as we know, the market is a voting machine in the short term which means investors’ emotions invariably can get out of control.
Technical Chart of Star Group (Stockcharts.com)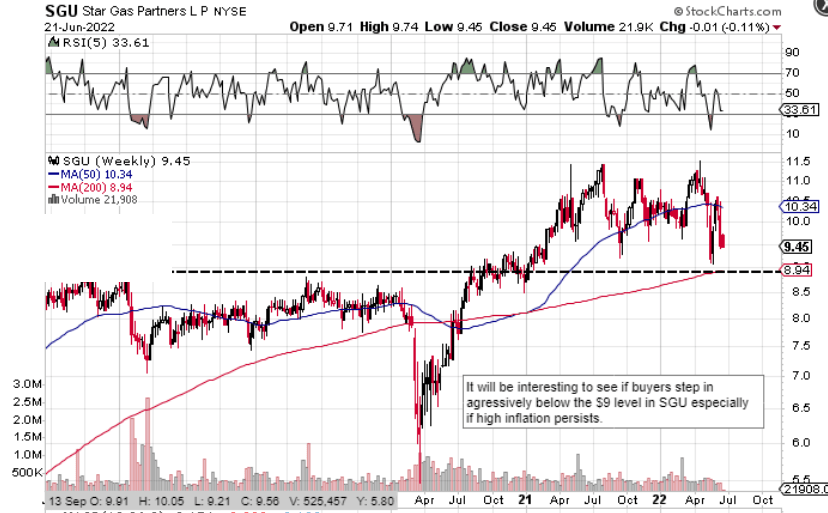
Conclusion
Therefore, to sum up, Star Group had a rough second quarter where we witnessed much higher working capital requirements and falling profits compared to the same period of 12 months prior. Although price volatility and the climate are completely out of the company’s control, the company is working hard to add value, increase customer retention and reduce costs overall. Let’s see how Q3 numbers turn out. We look forward to continued coverage.
Be the first to comment