

Fritz Jorgensen
SQM is a core holding
Sociedad Química y Minera de Chile S.A. (NYSE:SQM) is a long-term core holding in the EV (electric vehicle) sector with a 25% share of the global Lithium market. The company is a low-cost producer operating in Chile’s Salar de Atacama with 20+ years of reserves. SQM should increase LCE (Lithium carbonate equivalent) capacity by 30% annually to YE25 and maintain market share leadership. Valuation is compelling at 8x EV/EBITDA, a 30% discount to 10yr average and its main peer Albemarle (ALB). LCE prices could decline in YE23 forward to US$20k/ton from over US$50k/ton today which still drives a US$143 price target for 50% upside.
SQM Financial and Valuation Summary (Created by author with data from SQM)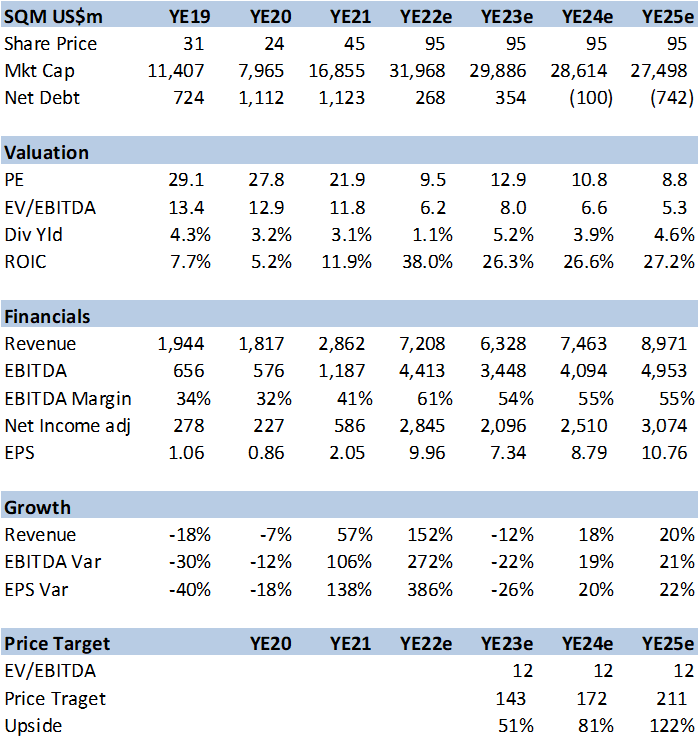
Peer Comparisons
SQM compares well on many metrics vs relevant peers, including valuation, production, margins, and growth. Note that peer comps are based on consensus estimates. My estimates are below consensus, most likely due to lower long term LCE prices and perhaps fertilizer and potash pricing as well. Livent (LTHM) and Lithium Americas (LAC) have higher valuations and greater operating risk with mines based in Argentina.
SQM peer comps with consensus estimates (Created by author with data from Capital IQ)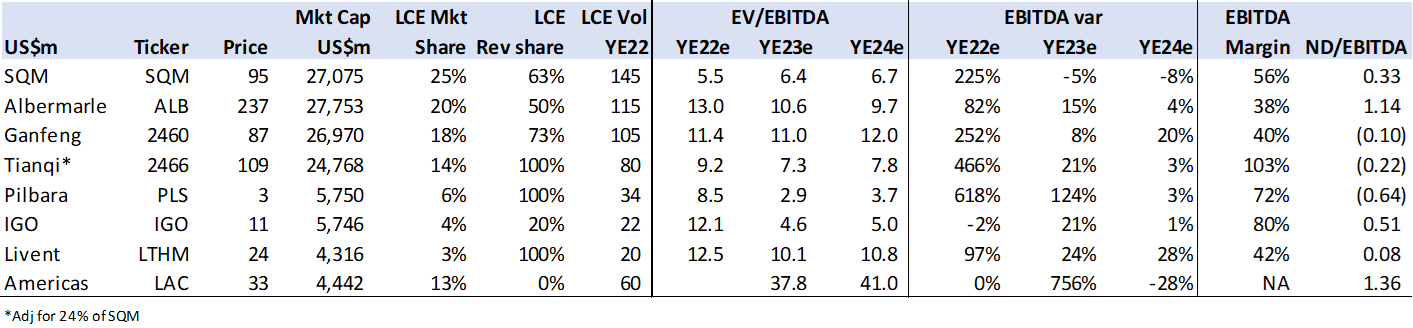
EV and Lithium market overview
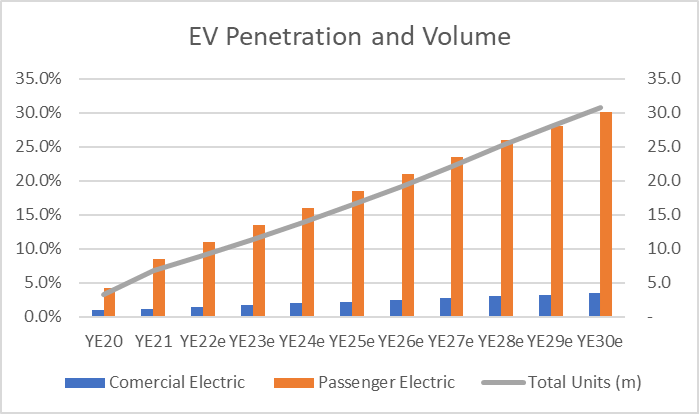
USA, Europe, and China are mandating an end to ICE (internal combustion engine) new car sales by 2030-2040. The market estimates that this will push EV penetration to 30% of new car sales by YE30 vs 8.5% in YE21. This translates into about 1.9m tons of LCE or a 15% annual growth rate. There are many studies suggesting that EV metal capacity may hinder this target, which means that raw material suppliers are in the driver’s seat and may dictate terms, seek high prices and long-term contacts, to assure capital returns.
LCE market demand forecast (Created by author with data from IEA, Mckinsey and ACEA) EV Penetration and Unit Volume (Created by author with data from IEA and Mckinsey)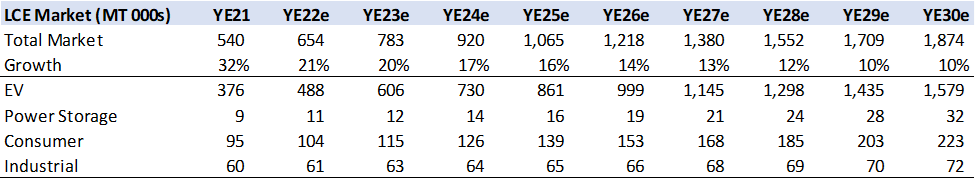
LCE prices: Back to US$20k/ton
LCE prices have climbed out of the lows seen during the pandemic shutdowns in mid-2020, increasing from US$6.5k/ton to US$50k/ton currently. This is due to basic supply demand equation: EV units sales grew 50% in YE21 and continue to perform, while the many EV battery production facility startups are all looking to lock in scarce raw materials. However, I do not think these price levels are sustainable and estimate a decline to the US$20k/ton level in YE23 going forward in line with a recent Fitch estimate. However, higher price as seen at Pilbara’s (OTCPK:PILBF) Battery Exchange Market (see page 12), provide upside risk.
Goldman Sachs LCE Estimates
Goldman Sachs (GS) recently forecast that LCE price would drop to US$16k/ton in 2H22 and US$11k/ton in YE23. The rational is that supply / capacity is coming on fast and the market will go from deficit to over supply by end of YE23. Key to this assumption is a significant increase from Chinese lepidolite (mica) mines, a hard rock lithium resource different to traditional spodumene. This has about half the lithium concentration and thus has a higher cost to extract according to a white paper.
The research also assumes significant capacity increase in Argentina, which poses high risk given capital controls, arbitrary regulation and 70% inflation.
Goldman Sachs LCE Volume Forecast (Created by author with data from GS)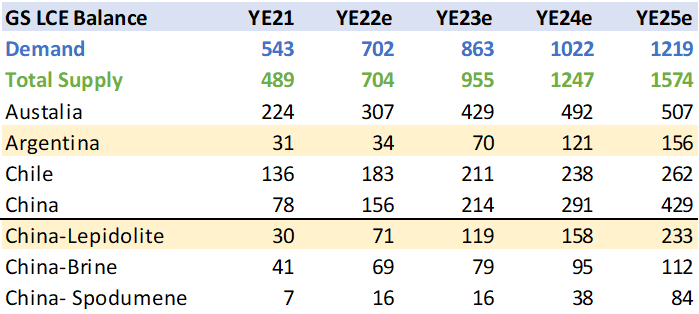
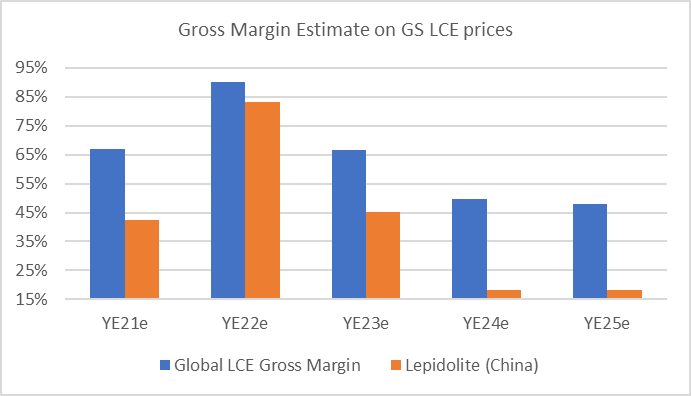
Using GS estimated LCE prices the lepidolite based production would have around an 18% gross margin vs brines and spodumene of over 50%. Would that cover the cost of capital and provide a positive return? Perhaps not but Chinese companies may benefit from government subsidies or have lower return hurdles.
Goldman Sachs LCE Price Forecast (Created by author with data from GS and Roskill) Gross Margin per LCE source mine (Created by author with data from SQM and Roskill)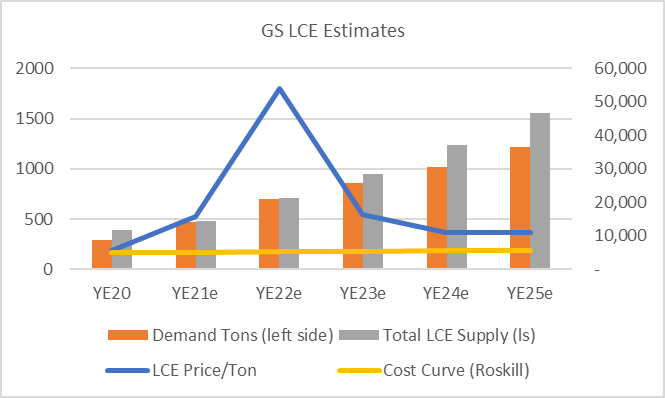
Impact on SQM: Using GS price forecast of US$16k/ton in 2H22 and US$11k/ton in YE23 forward reduces SQM EBITDA by 27% and a price target to US$100 for YE23.
Political Risk: Impacts Valuation
Much has been written and implied regarding SQM’s political risk, which also applies to ALB. The fact is that both have concession agreements to YE30 with Corfo, Chile’s development authority and this should not be altered. I have covered SQM since 1997 and have lived in Chile for over 15rys which I believe provides me with an educated insight into the political and regulatory situation. The government and a new constitution may attempt to establish a national champion to “compete” with SQM but this does not alter the company’s growth plans or cost structure. Talk of stimulating “value added” production, such as battery assembly in Chile, is a positive. Post YE30 expropriation risk exists but it’s very unlikely the government in power will have the funds or expertise to manage SQM and ALB. Plus, expropriation of any company kills future FDI (foreign direct investment). I view the main risk as increased taxation but quite frankly 2030 is just too far away to worry about or predict.
SQM and ALB had similar EV/EBITDA valuations, averaging 12x until the end of 2020. The gap seen in ALB seems irrational given that both derive the bulk of EBITDA from Chile Lithium operations. My YE23 price target of US$143 is based on a reversion to mean of 12x EV/EBITDA for SQM.
SQM and ALB historic EV/EBITDA multiple (Created by author with data from Capital IQ)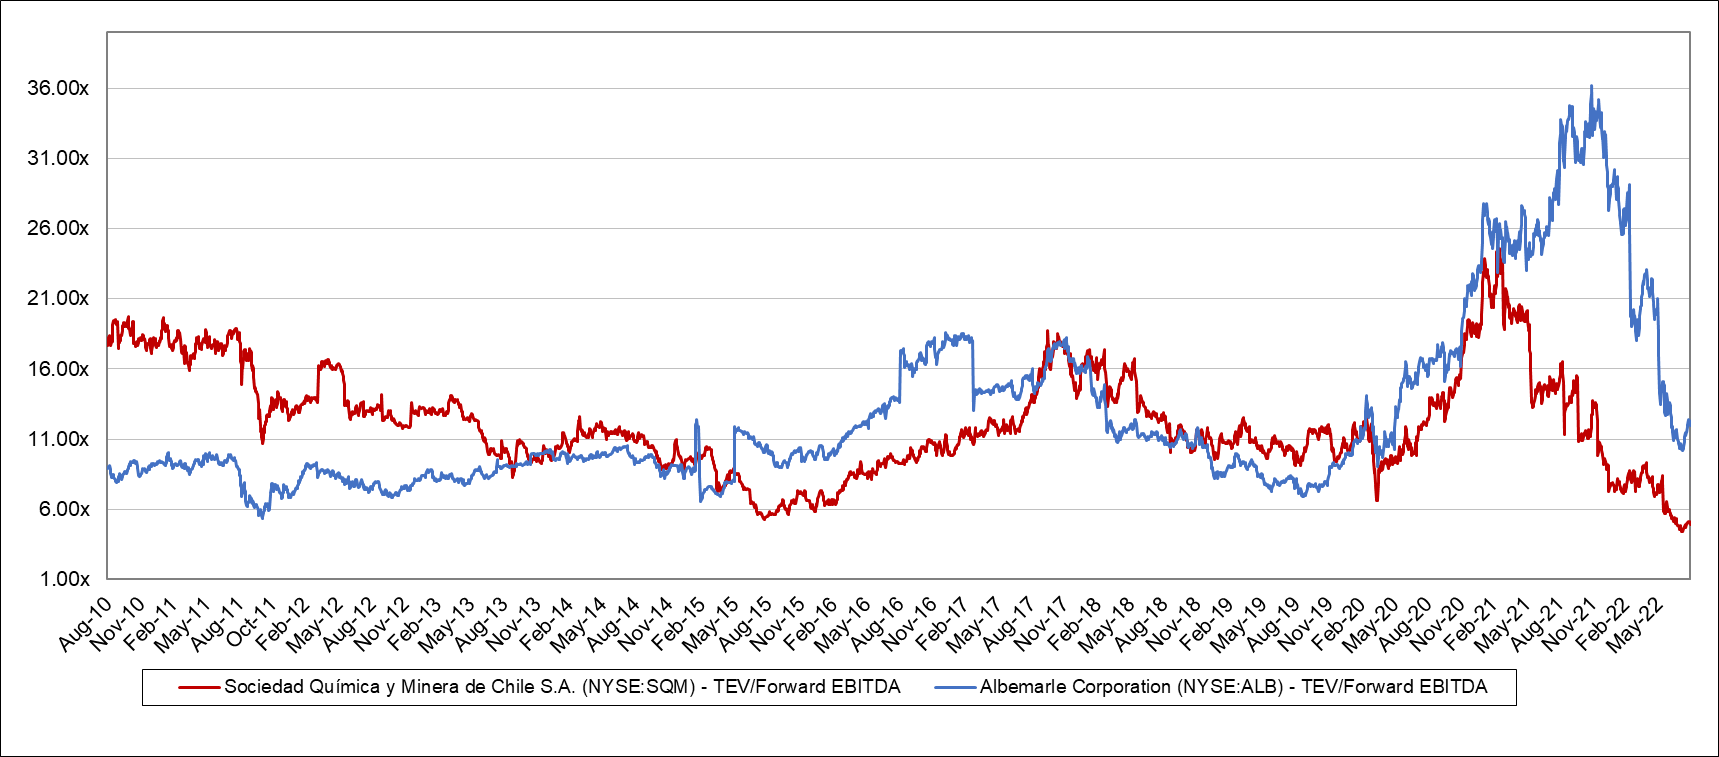
Operating Business Segments Forecasts
SQM has five business segments located in Chile’s Salar de Atacama and are integrated and benefit from overlapping synergies. The company “mines” Caliche which is about 10 feet below the surface from which it extracts Iodine and Sodium Nitrate. From the salt brines it extracts Potassium Nitrate and Lithium that form the companies building blocks for its fertilizer and chemical products (LCE).
SQM Mine Assets and Production (Created SQM) SQM Revenue and Gross Income Breakdown by product segment (Created by author with data from SQM)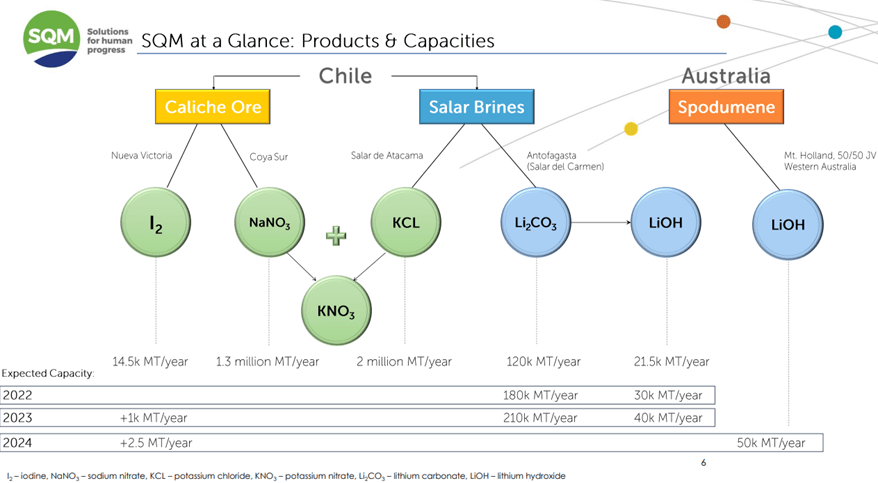
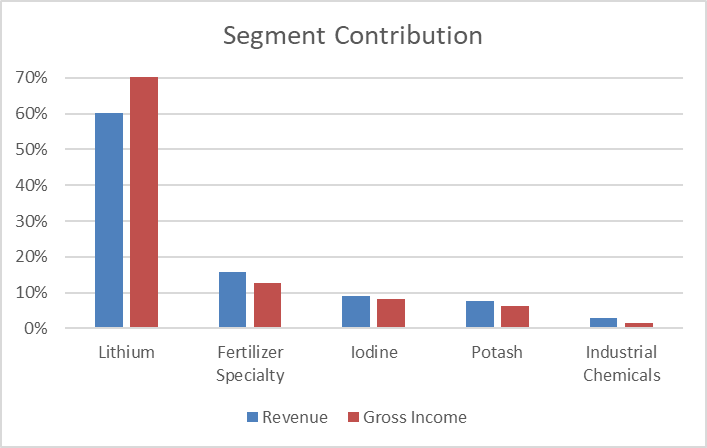
I forecast each segment as per disclosed by the company, to the gross margin level. Revenue is driven by volume and price projections, while COGS is based on unit cost. Lithium is now 60% of revenue and 70% of gross income. However, since I assume lower prices in YE23, gross margin should decline. The company is investing heavily in LCE expansion to 245m/ton by YE24 on a capex of over US$1bn.
SQM LCE Operating Model Estimates (Created by author with data from SQM)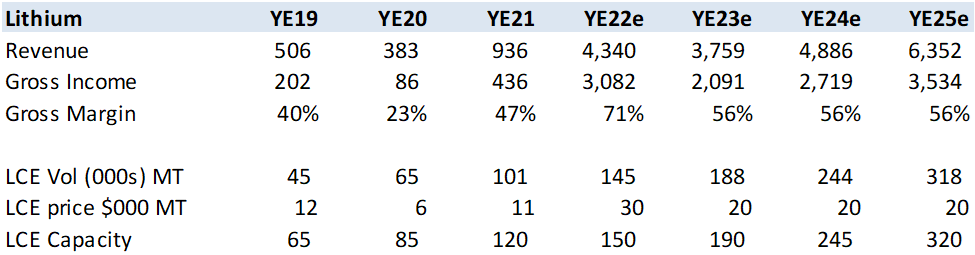
Conclusion: SQM is a core EV value chain investment
SQM is a lowest cost producer of LCE that should grow volume by 30% a year on EV adoption. The stock’s valuation has not kept up with EBITDA growth or LCE prices due in part to Chile’s political risk perception as well as expectations of a decline in LCE prices. I believe the shares should recover to 12x EV/EBITDA multiple as this political risk wanes and LCE prices stay higher for longer.
Be the first to comment