

freemixer/E+ via Getty Images
Technicians are revisiting previous market (NYSEARCA:SPY) bottoms much as scuba divers visit ships that have fallen to the bottom long ago. The SPY’s first guess for a bear bottom was $364. That looked like a nice guess, as the SPY bounced up to $428. Now it is not looking that good anymore, and the SPY is looking for a new bottom.
The Bottom Is Here
We know that bottom is probably shown on the chart below, but the market has to tell us exactly where the bottom is. This will be no secret to technicians that have studied previous bottoms. We will be able to identify the bottom for you when it appears on the chart. There are definite bottoming patterns that can be seen on a chart. It doesn’t matter if it is a 5-minute chart, a daily chart or a weekly chart, bottoming patterns are identifiable, contrary to the popular Wall St. myth that says you cannot identify bottoms. We have consistently indicated here that at $428, there was no bottom in place and that $364 needed to be revisited.
Identify The Bottom
Why can’t we identify it right now? We can’t predict the future. We don’t know when the Fed will stop raising rates. When it stops, we will probably be close to seeing a bottom. We can’t identify when the war will end. When it ends, the SPY will be close to a bottom.
We don’t know if COVID is finished. Do we have another mutation? Does COVID join the annual flu shots we may take in the future? Look at the recent lockdowns in China.
We don’t know if this is going to be a soft landing or hard landing recession. We think 2023 is a very tough year and 2024, a presidential year, will see improvement. Nobody wants a hard landing and one professor is already warning the Fed about overdoing the “pain” in 2023. The pendulum swing that overdid the stimulus is about to overdo the pain to the economy, as the pendulum swings back.
We don’t know how much analysts and CEOs are going to cut earnings forecasts. We do know that when this happens, it will not help the stock market. Inflated costs can rise a lot faster than the ability to hike prices, thus squeezing margins. FedEx (FDX) just announced they are cutting costs as revenues drop. This will be heard over and over again with other companies as the Fed created recession rolls over the country in order to reduce inflation to 2.2%.
Identify The Opportunities
We do know that the bear market is continuing and looking for a bottom. We can make money knowing this, without knowing exactly where the bottom is. When we see the bottom is in place, we can switch back from shorting the SPY to being long the market.
We know that certain stocks have already hit bottom. They have little downside risk left. They will move up ahead of this bear market and lead the bull market bounce from the final bottom of this bear. We have daily reports identifying these stocks.
We know that even in a bear market, there are stocks in uptrends. These are easy to identify and to make money. We come up with a daily list of these stocks that we publish to our subscribers, along with our daily article on the SPY.
We know that the war will eventually end. We know that the Fed will eventually stop raising rates. We know this bear market will bottom and a new bull market will start. We know stocks that will bottom early and start bullish moves before the market. It is time to accumulate cash for these investment opportunities. Right now cash is king.
Where Is This Market Going Next?
On the chart below, you will see the formation of the next bottom, much as you saw the formation of the market’s premature guess of the bottom at $364. You can see that the next targeted support level is $344. Will it go straight down to this level? Of course not, we will see technical bounces. But that column of falling “Os” may continue straight down to $344 as you can see it has done in previous drops below an existing bottom.
SPY Testing The Bottom At $364 (StockCharts.com)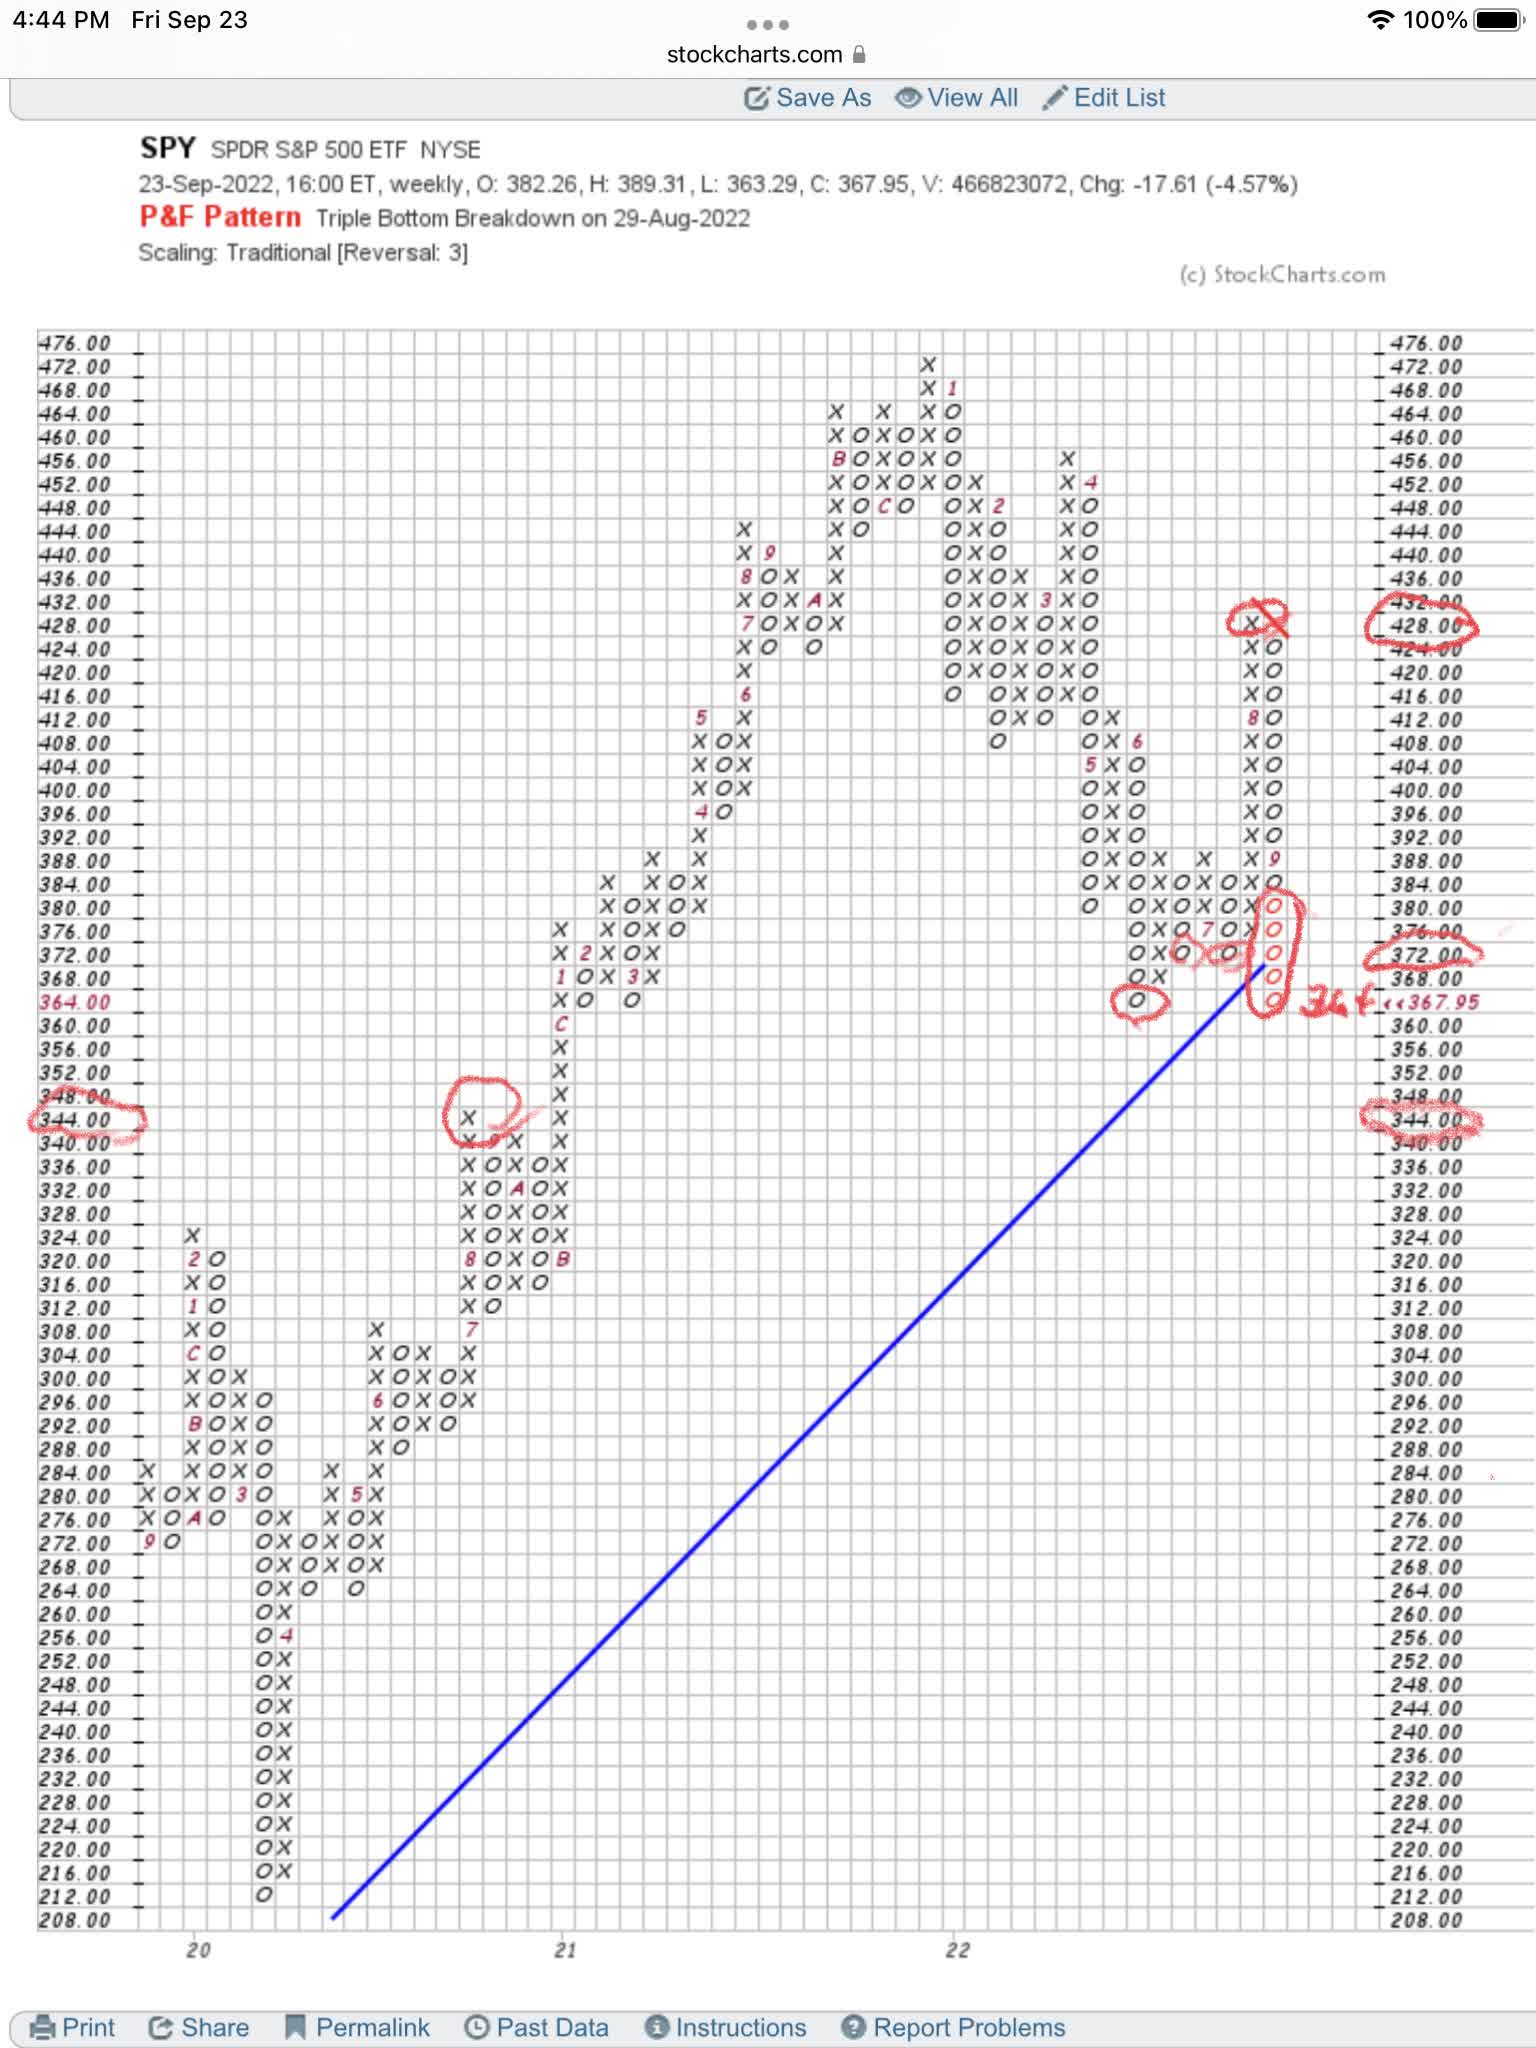
NOTE: We have circled the five, red “Os” identifying the broken price levels this week, taking us so suddenly to the bottom at $364. This tells us the market is going down. We have circled the next targeted support level at $344.
Be the first to comment