

Stagflation word cloud. The word Stagflation is framed by different words how describers the phenomenon, like rising inflation, rising unemployment and decreasing demand. Torsten Asmus/iStock via Getty Images
Given today’s high inflation, and the timidity of Federal Reserve’s policies to fight it, many are concerned that stagflation is going to reappear. Stagflation is a period of simultaneously high unemployment and high inflation, as occurred in the 1970s. During that decade, the nominal return on the S&P 500 (NYSEARCA:SPY) was 27.0%, and the real return was -37.4%. These negative real stock returns are indicative of what we could expect if stagflation reoccurs. This makes the possibility of stagflation a well-placed concern for investors.
Is the U.S. economy headed into a stagflation period? There are a few unknowns that complicate making a call on whether stagflation will reoccur. Two unknowns are the strength of the Fed’s actions to fight inflation and the response of the economy to those actions. Another issue is how we characterize stagflation. For example, one characterization of stagflation is unemployment above 7% and inflation above 10%. By today’s standards these numbers are unthinkable, so right away they should get you thinking that stagflation is unlikely in the near future.
My perspective is that, in the near term, there is no risk of stagflation; inflation will continue to rise and unemployment to fall. Because the Fed’s policy stance is currently not aggressive, as we look a little further out, it is questionable as to whether the Fed’s actions will have any substantive impact on inflation or unemployment, especially enough to push us into stagflation. But things could change; for example, if the Fed becomes more aggressive, as is necessary to fight inflation, stagflation is a possibility. The two other risks factors, both of which could override the Fed’s actions and push us into stagflation sooner, are the surge in oil and food prices and the uncertainty surrounding the Russia-Ukraine war.
Defining Stagflation
To understand stagflation, we look back to the 1970s—a difficult decade to analyze because there were so many different things happening: oil and food price shocks, spending on the Vietnam War, Nixon’s wage and price controls, volatile monetary policies, and two recessions. The 1970s were also a miserable decade economically, with an average unemployment rate of 6.2%, and an average inflation rate of 7.1%.
There are no agreed upon periods of stagflation during the 1970s; it depends on how we define stagflation. The question is, how high must unemployment and inflation be for us to agree that a period is stagflation? Focusing on the 1970s into the early 1980s, I varied the inflation rate between 5% and 11% and the unemployment rate between 5% and 9%, and then examined the economic statistics during the resulting stagflation periods.
When using a range of values for unemployment and inflation at the low ends, the data capture stagflation in one extended period between 1974 and 1982. The higher these values go, this period splits into two stagflation periods: one somewhere between 1974 and 1976 and the other somewhere between 1978 and 1982. Note that the lower the unemployment and/or the inflation rate I used, the longer the stagflation period will be and, of course, the opposite when I increase them.
For all the stagflation periods studied, real stock returns were negative, except when both inflation and unemployment were extremely high, on average 7.6% for unemployment and 11.5% for inflation. I found that if they were not collectively that high, then real stock returns were always negative, although less negative the higher these rates became.
In Chart I, I plot the unemployment rate and the 12-month inflation rate, along with two 1970s stagflation periods, assuming an unemployment rate of above 5% and an inflation rate of above 7% (the highlighted gray periods). For this example, the first stagflation period runs from January 1974 through December 1975 during which the average unemployment rate was 7.2%, the average inflation rate was 9.4%, the nominal return on the S&P 500 was 3.7%, and the real return was -13.9%. The second period ran from May 1978 through February 1982, and the average unemployment rate was 6.8%, the average inflation rate was 10.9%, the nominal return on the S&P 500 was 16.3%, and its real return was -20.8%.
We need to step back and ask ourselves if these numbers are possible for the U.S. in the future. From my perspective, inflation above 9% is foreseeable, although unemployment at 6.8% or higher is not on the horizon soon.
U.S. Bureau of Labor Statistics; Authors analysis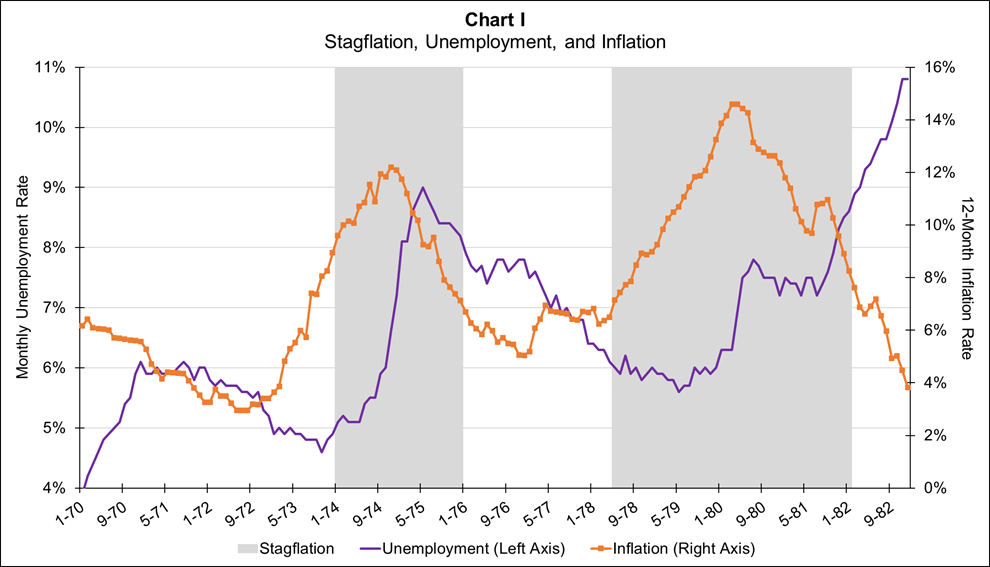
A statistical analysis of the data from January 1974 through the end of 1982 revealed that, during this period, unemployment was the main cause of the movements in real stock returns during the stagflation periods. In addition, inflation somewhat negatively influenced real stock returns..
In Chart II, I plot the unemployment rate and the real S&P 500 Index for the 1970s and the early 1980s, overlayed with the previous stagflation periods. As this chart shows, although this era is predominantly a period of stagflation, the unemployment rate did fall from mid-1976 through mid-1979, which, according to the statistical model, caused real stock returns to be negative. Furthermore, during the first stagflation the unemployment rate rose halfway in, and the S&P 500 Index rose with it.
U.S. Bureau of Labor Statistics; Center for Research in Stock Prices; Author’s analysis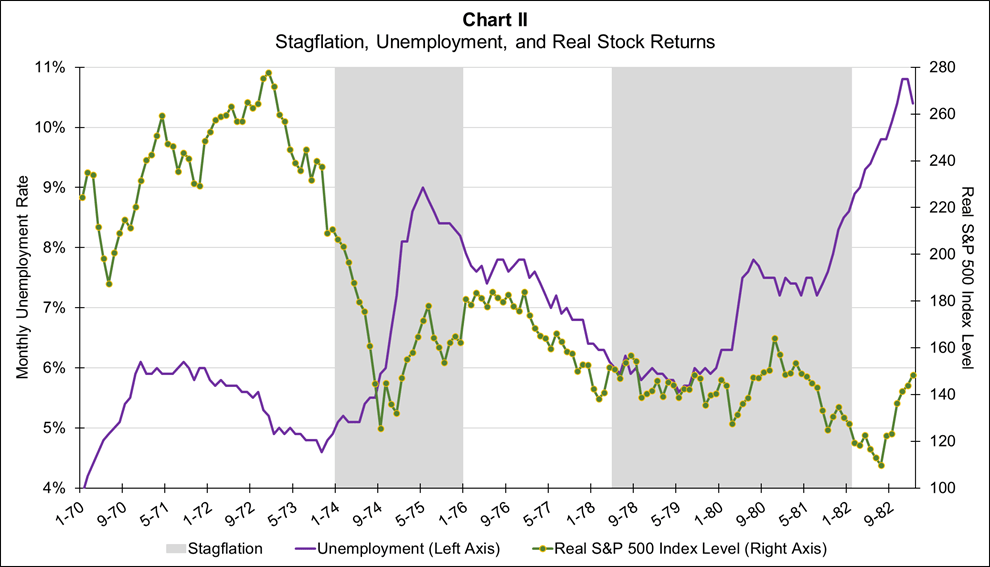
Economists have observed this positive relationship between unemployment and real stock returns before and it is a confusing one; however, they have offered an explanation. Because the stock market is forward looking, when the unemployment rate is high, there is anticipation that the Fed will respond with expansionary monetary policy to promote economic growth, thereby increasing stock returns in expectation of this. When the unemployment rate is low, it is a forecast that the Fed will feel free to respond to high inflation with contractionary monetary policies, thereby causing the real economy to contract, and real stock returns decrease in expectation of this.
Although we cannot observe it directly in Chart I or II, the Fed had expansionary policies followed by contractionary policies in place prior to both stagflations. Inflation responded to the expansionary policies with a lag before rising. The contractionary policies led to rising unemployment also with a lag. The two effects result in what you see in Charts I and II.
The bottom line is, when thinking about stagflation and stocks returns, do not just focus on the usual negative relationship between real returns and inflation. Rather, we must also take into account the positive relationship with unemployment. Furthermore, unemployment is the main driver of movements in real stock returns during and around stagflation. Contrary to our intuition, if the unemployment rate falls during a stagflation, then the real S&P 500 Index will fall with it and vice-versa.
Understanding Stagflation
There are many theories as to the causes of the 1970s stagflation—see this Seeking Alpha article for a list of them. Of these alternative theories, there are two that adequately explain the stagflations of the 1970s.
The first is the standard textbook argument that there were supply shocks throughout the 1970s caused not just by rising oil prices, but also by rising food prices, the end to Nixon’s wage and price controls, and the devaluation of the dollar. The argument is that these supply shocks reduced the aggregate supply of goods, pushing the general price level up, ergo inflation, and forcing output down, yielding rising unemployment, hence stagflation.
The monetary perspective is more convoluted. As I explain in this article, fundamentally it boils down to the Fed having expansionary monetary policies in the 1970s that led to the inflation during the decade. The Fed followed these expansionary policies with contractionary monetary periods to try to tame inflation, which led to rising unemployment. Together these policies caused the periods of stagflation.
The ultimate origins of stagflation in the 1970s were a combination of the above two, with, from my perspective, the monetary arguments dominating. In discerning the future, the price shock argument is important because of the current oil and food price shocks. The monetary argument is important because we are coming out of a period of the most rapid expansionary monetary policies we have ever seen, followed by today’s mild contractionary policies.
Will We Have Stagflation in Our Future?
There is a lot of disagreement about whether the headwinds are pushing the economy into stagflation or not, on Seeking Alpha and elsewhere. This Seeking Alpha article gives itself away with its title, “Stagflation Trap is Here and There is No Way Out,” and on the opposite side, “Stagflation without the ‘Stag’.”
Some argue that the inflation we are facing today is different than that which persisted in the 1970s. In the 1970s the stock market, consumers, and producers all had expectations that inflation was going to persist. For our current inflationary period, however, no one has strong expectations that inflation is self-perpetuating—yet. If the market had expectations of lasting inflation, then long-term Treasury yields would be rising sufficiently to take that into account, which has not happened, relative to short-term Treasuries. This is because short-term Treasury yields are rising to be above long-term yields. This indicates that the Fed may not have to raise its fed funds rate target too high to bring inflation down; hence, the Fed can avoid pushing us into stagflation.
Others, like myself, disagree with this perspective. One of the things we learned from the 1970s is that the Fed must be extremely aggressive in fighting inflation when it is as high as it is today. At the extreme end, this could mean increasing the fed funds rate to at least the level of the inflation rate if not higher. If this perspective is correct, and the Fed acts accordingly, we would enter stagflation.
Currently, the Fed’s policies are not aggressive, so we will see the outcome of this debate. The Fed has recently increased its fed funds target from 0.25% to 0.50%, a minor increase in the face of the recent inflation rate of 7.9%. They also indicated that the fed funds rate target will rise to 2.8% by the end of 2023. I consider this to be an insufficient increase to bring the current level of inflation down; therefore, these fed fund rate upticks will not have a significant impact on the real economy, nor inflation.
Time to Be Cautious
The bottom line is stagflation is not good for a portfolio of equities. Although you might see rising nominal returns on your portfolio, under most circumstances you will suffer real loses. Whether we are heading into stagflation is hard to know, hence so many differing opinions. My view is that the Fed’s initial tepid response to rising inflation will not be enough to slow inflation nor effect the real economy that much. If the Fed realizes its error and corrects its way by being more aggressive, then we could head into stagflation. Regardless of where we land, now is period of considerable risk for equity markets, and therefore you should be cautious with your portfolio.
Be the first to comment