

cagkansayin
No question that the market (NYSEARCA:SPY) is having strong bounces off $392 support in an attempt to reverse trends by breaking above $404 resistance. Now we have a positive, reversal signal on the Point & Figure chart below. How high will the SPY go?
Traders See Buy Signals
As you can see on the charts below, SPY has a rough road ahead of it to reach $412 resistance. Supply is showing on the daily and weekly charts. The traders are looking at the daily chart and the investors are looking at the weekly chart. Both charts show the Sell Signals and the Supply that is holding this bounce in check as it tries to break above $412 resistance, just the way it broke above $404.
The daily chart shows that the recent Demand, that took price up to test resistance, has improved the Supply Signals and turned them up on the chart. Traders are buying the change in signals. This week higher prices will probably continue as the signals move up from oversold Supply to overbought Demand.
The increase of interest rates by 75 basis points in Europe, along with a bearish outlook on growth, did not dent the buying on Thursday or Friday. This probably means that similar action by the Fed will not stop the buying. No matter how much the market hears about “pain” from the Fed, it thinks the bottom is in place at $364. There doesn’t seem to be any pain right now.
What Is Already Priced Into This Market?
The market has already priced in rising interest rates with Europe and the Fed. What has it not priced in yet? Obviously, it is pricing in a soft landing and a mild recession, not a hard landing and deep recession. Gasoline prices have dropped in the US giving the illusion that inflation is under control and dropping. Apple (AAPL) did not raise prices.
However, higher prices during the year-end, holiday season may tame consumer demand this year. The US is not yet feeling the pain of higher interest rates nor higher unemployment. However, the housing market is definitely cooling, as buyers wait for lower rates. How far off is that? Is this the start of a 20-year secular cycle of rising interest rates? Eventually housing prices drop as the high interest rates stay in a secular trend going higher.
Will Earnings Drop Next Year?
What about corporate earnings estimates for next year? When are they going to drop? Analysts and CEOs are notoriously slow in announcing the bad news. Besides, CEOs are busy raising prices and are hoping that covers the rising costs. Apple seems to be an exception, but their prices were always too high.
A tough time in Europe this winter has to hurt the earnings of global US companies. The higher dollar will also put a dent in their earnings. The market is guessing what that will do to earnings. That market guess is part of the reason we are seeing a bear market.
Investors See Sell Signals
The weekly chart shows SPY is still in a bear market. It reflects the fundamentals of a slowing economy, higher interest rates and inflation or stagflation. Fundamentals are driving the market lower and we can see this clearly in the weekly chart signals.
What we see in the daily chart and the Point & Figure chart is simply another rally in a bear market. Why are we convinced of this? This bear market does not have a bottom in place, nor has it started a bottoming process that forms the basis of the next bull market.
A Technical Rally In A Bear Market
This current rally looks like a normal 50% retracement of the drop from $430 to $390. This is just a normal, technical bounce from oversold, that was surprisingly strong enough to trigger a reversal signal. There will be a return to the fundamentals that are driving this bear market. This bear market is still obvious in the signals appearing in the longer term charts. These signals are more reliable than the short term, daily chart, which changes quickly with technical swings in demand and supply.
Conclusion
What we have is a short term swing in demand creating a little bounce, stronger than we expected. As a result, we have to change our short term signal from a “strong Sell” to a “Sell” just to reflect the short term, improving signals. We expect to go back to a strong sell signal by the end of September.
Here is the Point & Figure chart showing the reversal, buy signal that traders are buying. You can see the dropping column of “Os” has reversed to a rising column of “Xs”.
Traders Positive Reversal Signal (StockCharts.com)
Also here is the daily chart showing the improving signals as oversold Supply switches to overbought Demand and higher prices.
Traders Buy Signals (StockCharts.com)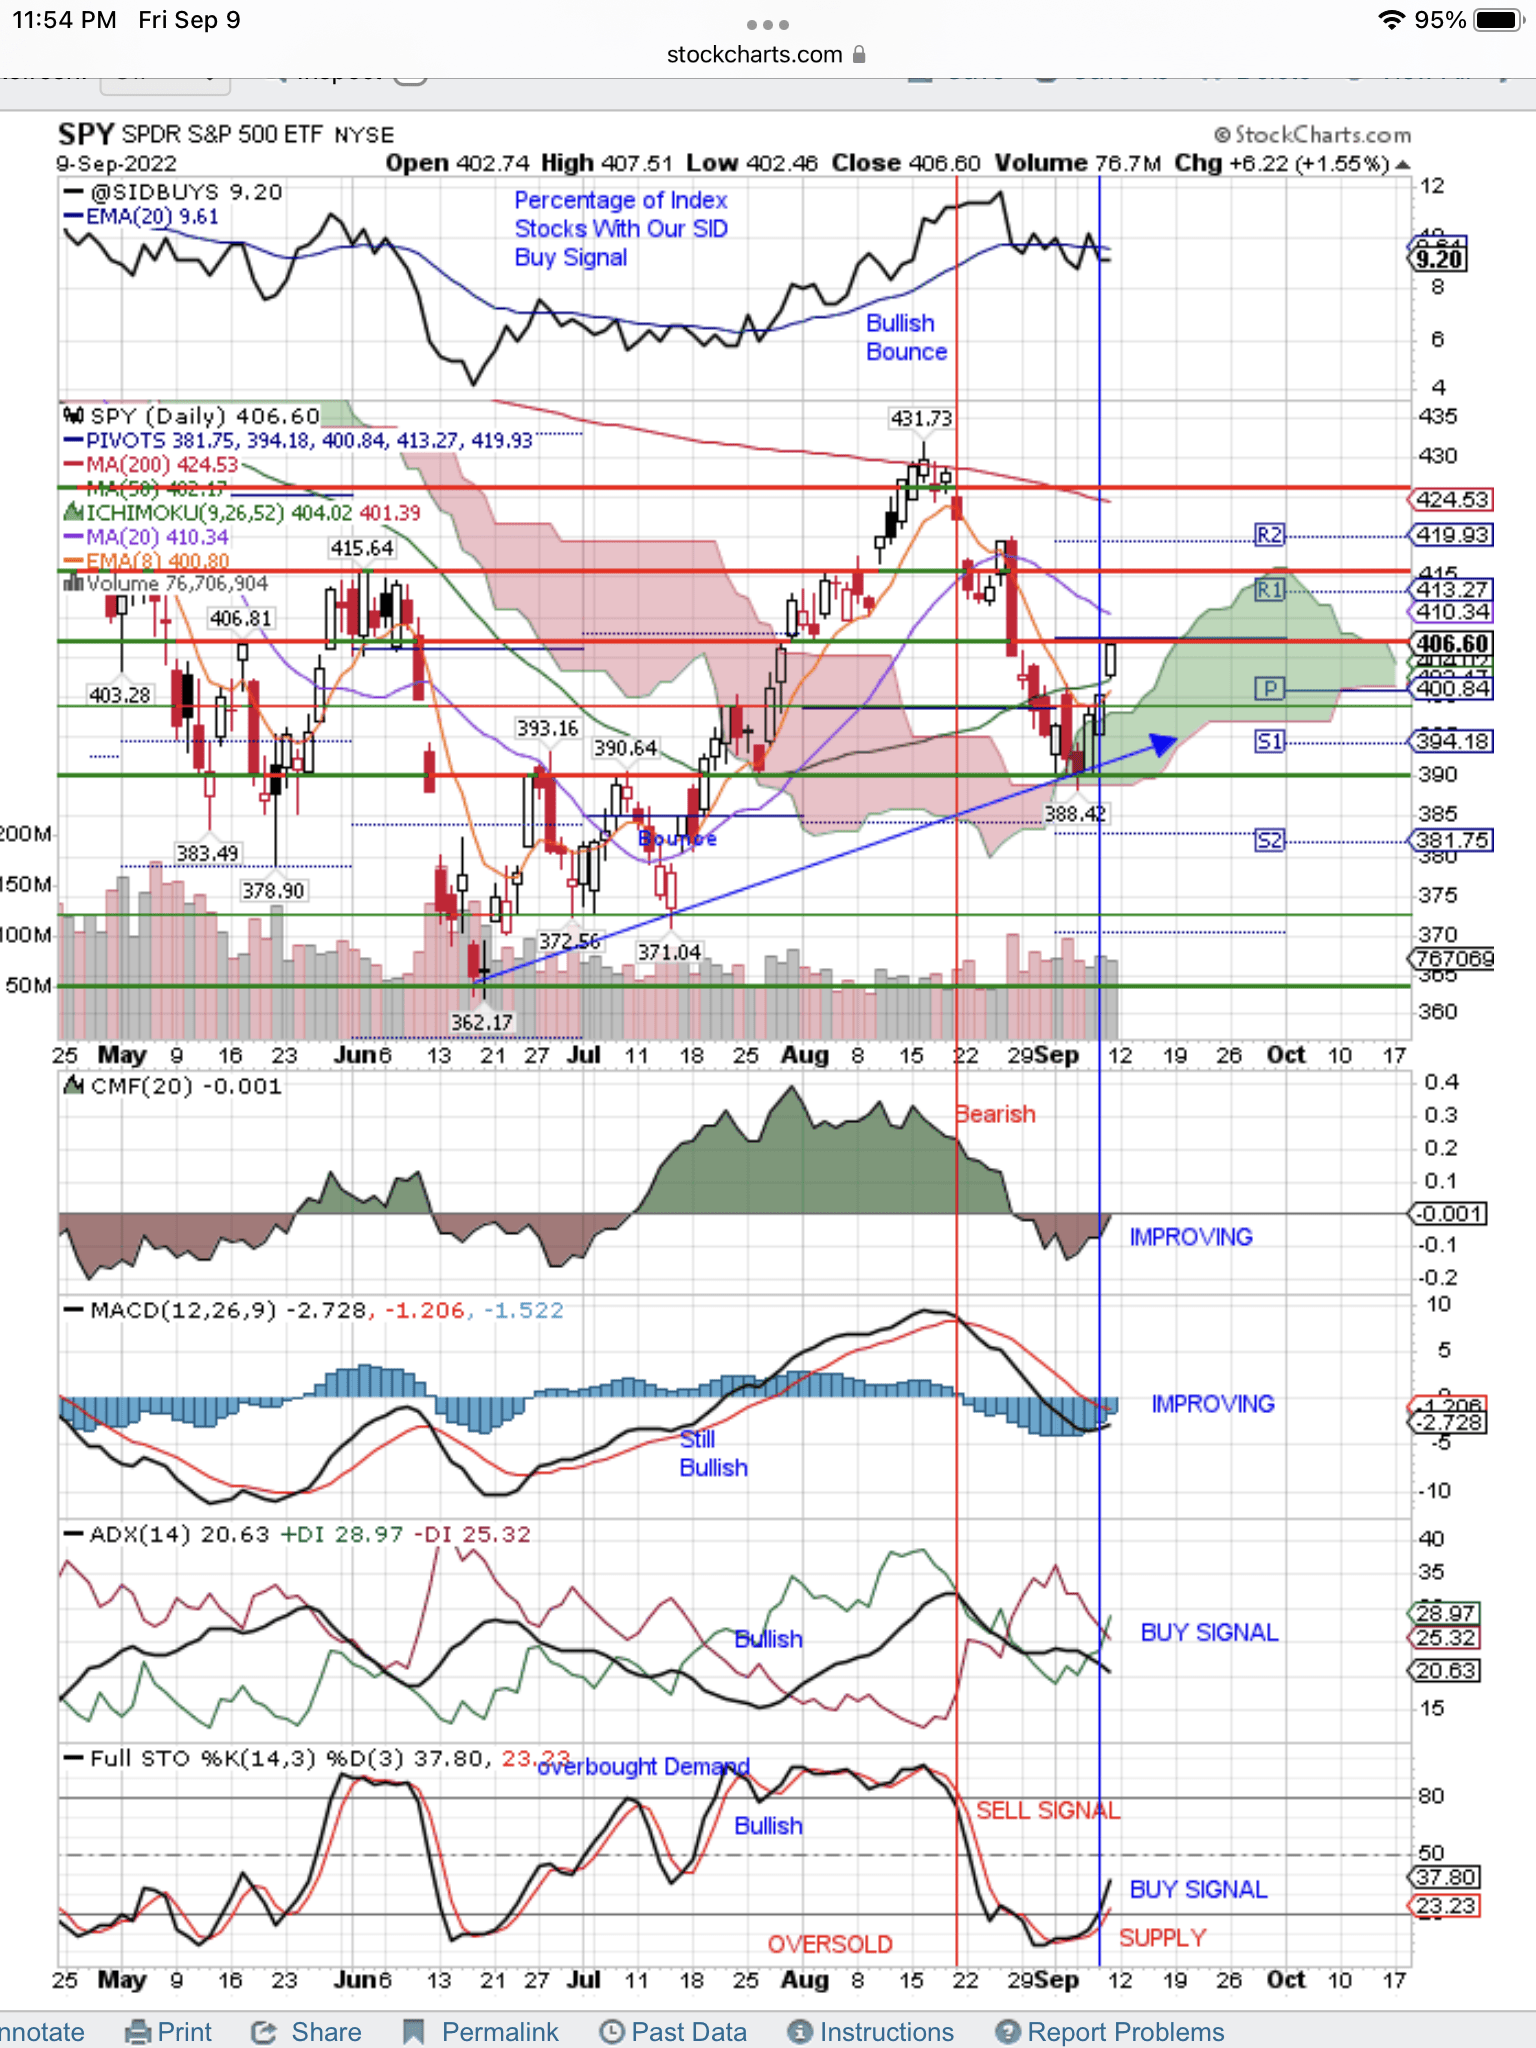
Be the first to comment