

Scott Olson/Getty Images News
Article Purpose
The S&P 500 Index needs a boost, preferably a sustainable one not controlled by expert guesses on inflation and interest rate expectations. Instead, the boost I’m looking for will be supported by good old-fashioned earnings and, more specifically, earnings surprises. Over the last three quarters, S&P 500 aggregate earnings surprises were 5.9%, 7.3%, and 5.8%. These are respectable numbers compared to the ten-year average, but they’re far from the 23.4%, 16.9%, and 10.8% earnings surprises from Q1-Q3 2021. While I don’t expect these double-digit surprises to return, a reversal of the downward trend would be welcome news, especially for high P/E stocks near the top of the S&P 500 Index like Amazon (AMZN).
The SPDR S&P 500 Trust ETF (NYSEARCA:SPY) has declined 20% YTD, nicely correlating with these negative earnings surprise trends. Therefore, this article outlines analysts’ sales and earnings expectations for SPY’s top 25 holdings, which the vast majority are scheduled to report this month. In addition, I’ll provide a set of fundamentals for the Index and look at several median metrics by industry, including volatility, growth, and valuation. It’s a data-rich article that I hope you’ll end up referencing as we move through the Q3 earnings season, and as always, I look forward to discussing this further in the comments section afterward.
S&P 500 Earnings Surprise Trends
Earnings surprise trends are a good way to measure overall market sentiment. Compared with technical analysis, I find the results less ambiguous and more reliable. Of course, there will always be a debate about whether these Wall Street analysts know what they’re talking about. Nevertheless, I’ve learned to accept their influence rather than fight it, and I now closely follow how “surprised” analysts are each quarter.
Since the Great Financial Crisis, there were two periods where analysts experienced abnormally high aggregate earnings surprises for S&P 500 constituents: 2009 and 2020 when surprises were in the double-digits for two or more consecutive quarters. These results corresponded with a strong risk-on sentiment where market participants favored speculative stocks over fundamentally-sound “safe” stocks. The timing isn’t exact – it’s not like market participants collaborate each quarter and decide what stocks to favor next. Instead, it’s a bit more of a judgment call, which you can gain an appreciation for by looking closer at the data. Let’s start by examining aggregate S&P 500 earnings surprise trends since 1987, courtesy of Yardeni Research.
You can see that negative earnings surprises coincided with the recessions in 1990 and 2008. In addition, in 2001, earnings surprises were downward-trending, resulting in the normalization of valuations for high P/E and non-profitable stocks. Some readers may be surprised to learn that a portfolio of low P/E stocks gained 27.70% and 5.60% in 2000 and 2001. In comparison, non-profitable stocks lost 34.61% and 32.56%, and high P/E stocks lost 12.98% and 13.80%. My source for these figures is the Kenneth French Data Library, which you can download to Excel here.
Q1 2020 saw earnings surprises dip to 3.9% but then skyrocket to 23.4%, 19.7%, 17.1%, 23.4%, and 10.8% in the subsequent quarters. These unprecedented surprises led to the valuation explosion of risky stocks like Tesla (TSLA) and the acceleration of thematic investing. The last three earnings surprises of 5.9%, 7.3%, and 5.8% were disappointing.
Notice how from Q1 2016 to Q2 2022, the percentage of S&P 500 companies with positive earnings surprises was almost always above 70%. As a result, it’s much more likely the average investor would come across more positive news headlines than negative ones, potentially leading to a fear of missing out. The figure peaked at 87.1% in Q2 2021 before settling at around 77% a year later. With only 17/500 companies reporting for Q3 2022, it’s too early to draw conclusions. If the trend continues downward, the S&P 500 could be in for additional declines. However, if earnings surprises improve to around 8% and the number of companies with positive surprises remains in the mid-high 70% range, I think that will be enough to support a sustainable rally.
Yardeni Research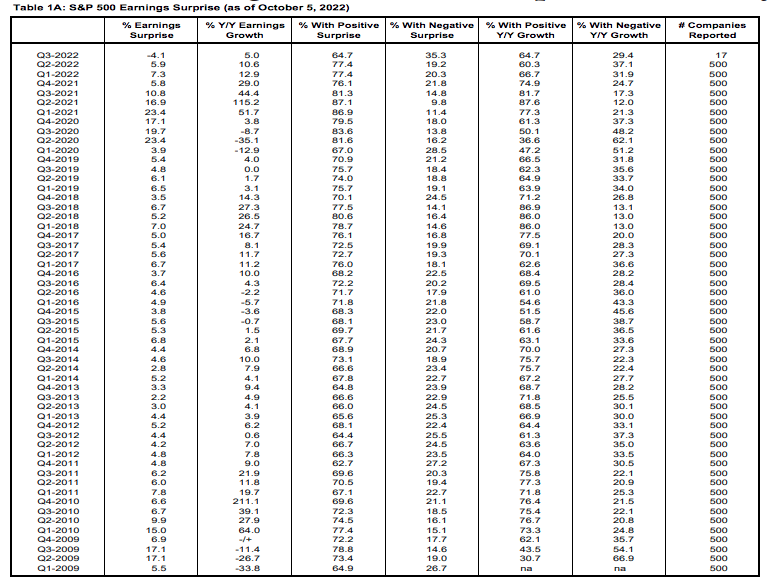
S&P 500 Q3 Earnings Expectations
As mentioned, few companies have reported Q3 earnings so far. One of them was Costco (COST), which missed consensus earnings estimates by 24%, its fifth disappointment over the last eight quarters. In the Technology space, Accenture (ACN) and Adobe (ADBE) effectively matched expectations with a 1.09% and 1.66% positive surprise. Finally, the biggest disappointment came from FedEx (FDX), which delivered quarterly EPS of just $3.44 compared to the $5.14 analysts expected. Shares immediately sunk 21% after that announcement, which included the withdrawal of guidance for the next year.
That’s the big news from September, but looking ahead to October, here are the top 25 names set to report. I’ve included earnings surprise trends for the last eight quarters and what analysts expect for Q3. Pay particular attention to the companies in danger of missing expectations for consecutive quarters and expected to have year-over-year declines, which I’ve bolded. They are Microsoft (MSFT), Alphabet (GOOGL) (GOOG), Amazon, JPMorgan Chase (JPM), Meta Platforms (META), Procter & Gamble (PG), Bank of America (BAC), and Verizon Communications (VZ).
The Sunday Investor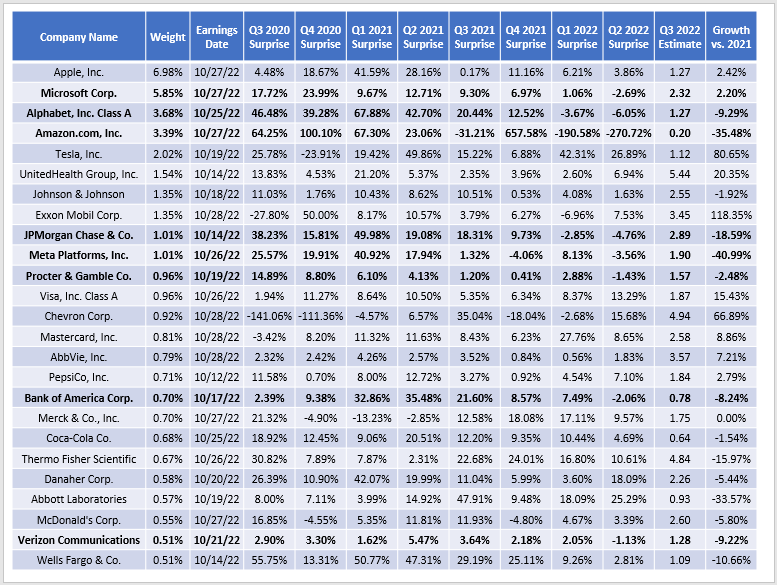
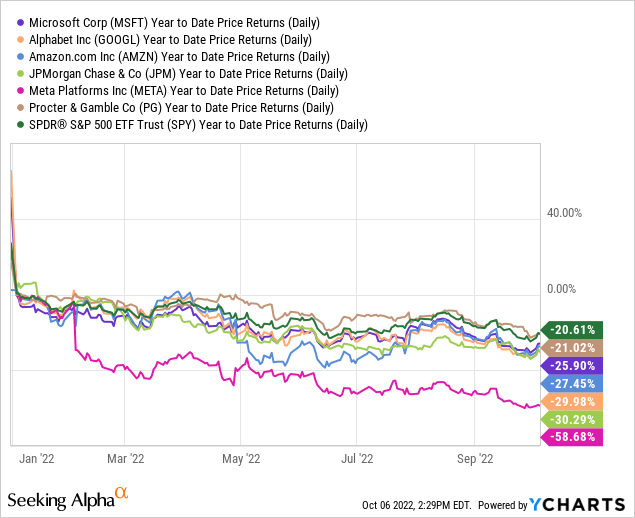
The first six bolded stocks have underperformed SPY YTD, with price losses ranging from 21.02% to 58.68%. I consider these the most vulnerable this earnings season and, at the same time, the ones that could support a rally if expectations are exceeded.
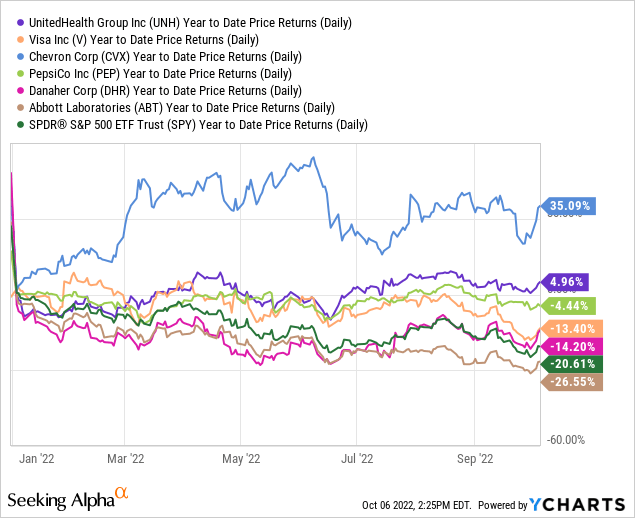
On the other hand, stocks with positive earnings surprise trends, like UnitedHealth Group (UNH), Visa (V), Chevron (CVX), PepsiCo (PEP), Danaher (DHR), and Abbott Laboratories (ABT), are doing well. All but Abbott Laboratories have outperformed SPY, so I think it’s a statistic worth watching.
S&P 500 Fundamentals
Company Snapshot
The following table highlights selected fundamental metrics for the top 25 constituents of the S&P 500 Index. I’ve included basic ones like sales growth, earnings growth, historical volatility, and valuation. However, I’ve also included Seeking Alpha EPS Revision Scores normalized on a scale from 1-10. The entire Index has a score of just 5.35, driven by poor scores among the top four stocks. Just six months ago, the Index scored 6.57, so it’s a pretty good reflection of how negative sentiment is on Wall Street today.
The Sunday Investor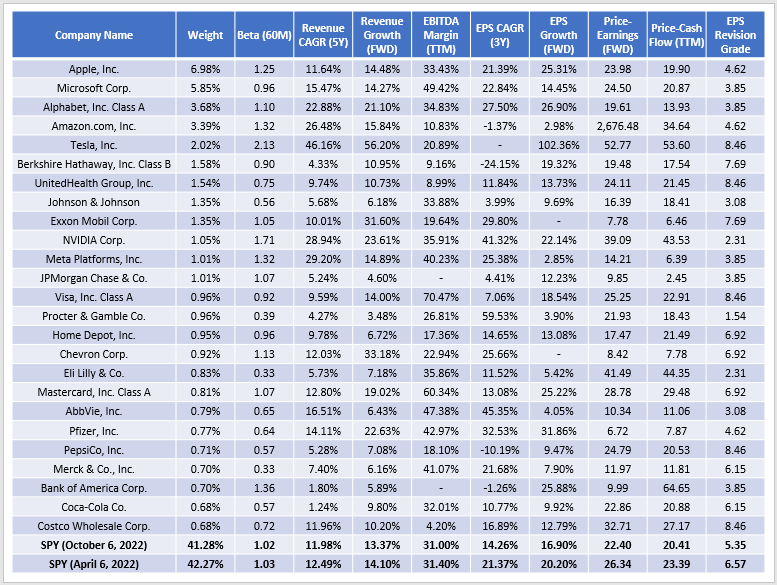
Apple (AAPL), Microsoft, and Alphabet currently trade at 23.98x, 24.50x, and 19.61x forward earnings after starting the year at 29.08x, 35.95x, and 27.48x. In the case of Microsoft, analysts estimate earnings growth to be just 14.45% over the next twelve months compared to 23.06% six months ago, so that’s a key factor weighing on the stock this year. An earnings beat is needed to improve the weak 3.85 EPS Revision Score.
Amazon and Tesla are two stocks whose valuations bounce around regularly, but Tesla looks the better of the two now. Its 8.46 EPS Revision Score stands out, analysts still expect earnings to double over the next year, and it trades at 52.77x forward earnings, which is undoubtedly low for the stock. Meanwhile, Amazon is at risk for a third consecutive miss, even as analysts downgrade expectations across the board.
Seeking Alpha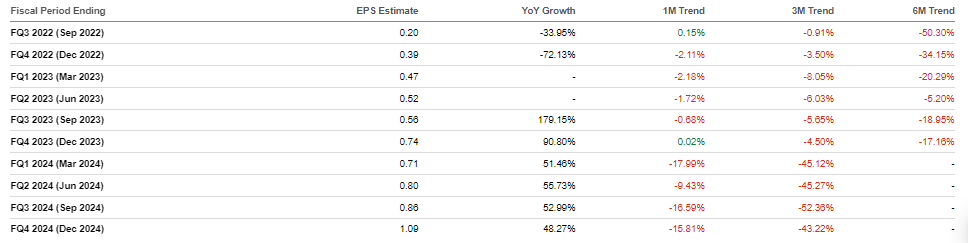
On the positive side, SPY’s overall forward price-earnings ratio has declined to 22.40 compared to 26.34 on April 6, 2022, and there hasn’t been a significant drop in estimated sales growth (13.37% vs. 14.10%) nor trailing twelve-month EBITDA margins (31.00% vs. 31.40%). Instead, it’s earnings per share growth (16.90% vs. 20.20%) that’s been most impacted, highlighting the impact of additional expenses and inflation. It’s a challenge, but it’s worth noting how SPY constituents have an overall “A” Seeking Alpha Profitability Grade, or 9.36 / 10. This figure was 9.28 six months ago, so these companies are still in a great position to weather any economic downturn. SPY’s top 25 holdings, except for Bank of America, have an “A+” Profitability Grade, so it’s likely not a good idea to bet against them for long.
Median Metrics By Industry
For a moment, let’s assume companies don’t deliver this earnings season, and you’re looking for a reasonably safe place to allocate some capital to equities. I’ve prepared a table highlighting median metrics by industry for SPY’s top 25 industries to assist. This view represents 185 companies and 67.35% of the total Index weight, and I’ve bolded what I think some of the more exciting plays are now.
The Sunday Investor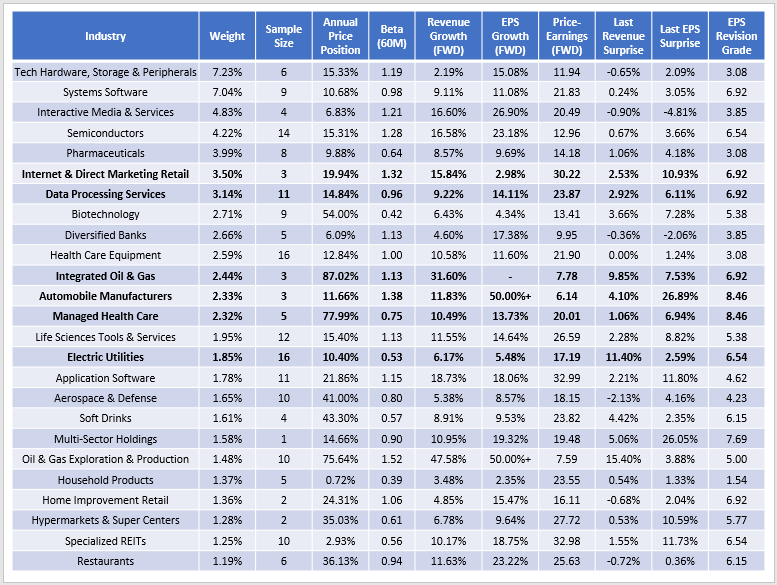
Internet & Direct Marketing Retail: Amazon controls this space, but there’s also eBay (EBAY) and Etsy (ETSY), which are both trading near their 52-week lows after 40%+ declines YTD. However, 41% of analysts made upwards earnings revisions for eBay over the last three months, and 57% have done the same for Etsy. On the other hand, analysts are almost universally united against Amazon, and I would expect more of the same if the company disappoints again this quarter.
Seeking Alpha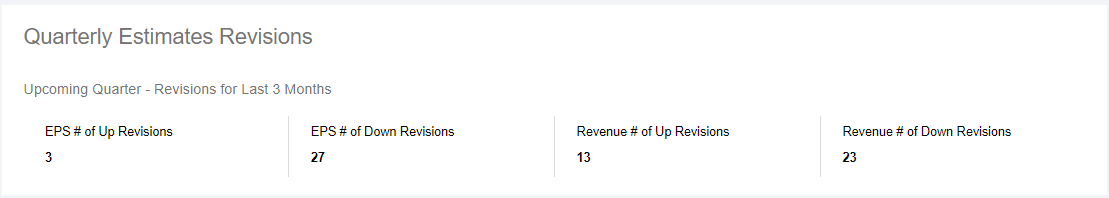
Data Processing & Outsourced Services: There are 11 companies in this industry inside the S&P 500, with Visa (V), Mastercard (MA), PayPal (PYPL), and ADP (ADP) leading with a 2.43% combined Index weight. All 11 companies had positive earnings surprises last quarter, and except for Global Payments (GPN), they had positive sales surprises, too. The industry trades at a median 23.87x forward earnings, and although its sales and earnings growth rates are slightly below the Index, its 6.92 EPS Revision Score is relatively attractive. Visa is aiming for its 11th consecutive positive earnings surprise after barely coming up short in Q4 2019.
Seeking Alpha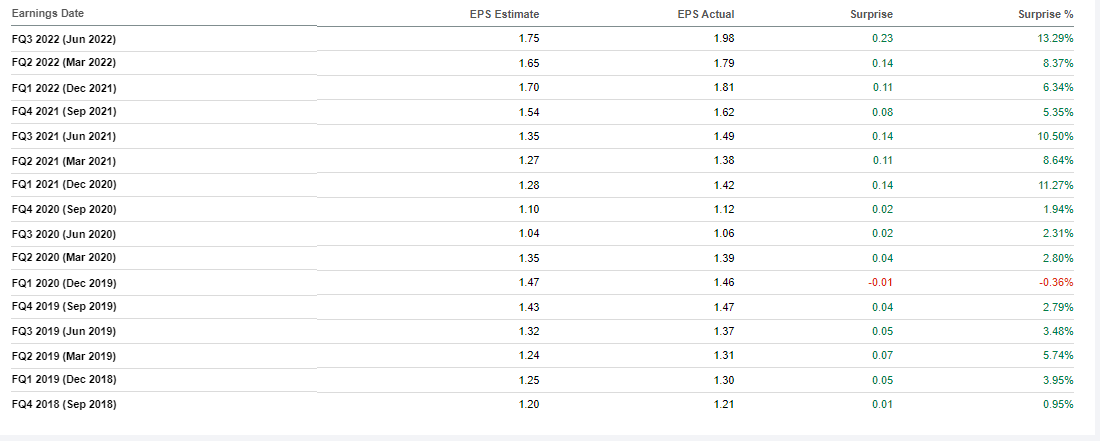
Integrated Oil & Gas: Exxon Mobil (XOM), Chevron (CVX), and Occidental Petroleum (OXY) are the three names in this industry, and in my view, remain essential holdings in case inflation remains high. I think about 10% total Energy exposure is appropriate. The S&P 500 only has 5.04%, so a low-cost ETF like the Energy Select Sector SPDR ETF (XLE) is probably the simplest solution. Regardless of your choice, these companies are highly profitable, trade at cheap valuations, and have good EPS Revision scores. Think of them as good hedges in case things get worse.
Automobile Manufacturers: I’ve already discussed Tesla, but Ford Motor (F) is potentially a good value play after being beaten down 43% YTD. Its annual price position, which measures its current price in relation to its 52-week high and low price, is just 11.47%. Furthermore, an analyst at Morgan Stanley expects management’s third-quarter warning to be largely priced in by now, hopefully setting the stage for a third consecutive normalized EPS beat. Ford is estimated to report earnings on October 26, 2022, post-trading.
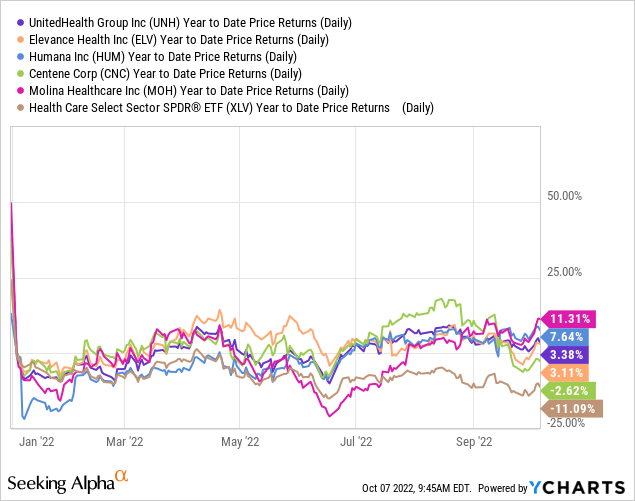
Managed Health Care: UnitedHealth Group (UNH), Elevance Health (ELV), Humana (HUM), Centene (CNC), and Molina Healthcare (MOH) form this industry, which has been one of the better performers over the last year, as indicated by its 77.99% Annual Price Position. The median EPS Revision Score is a strong 8.46, the industry trades at 20.01x forward earnings, and it has a reasonably defensive 0.75 five-year beta. Sales and earnings growth are solid at 10.49% and 13.73%, and all have outperformed the Health Care Select Sector SPDR ETF (XLV) YTD. For a momentum / low-risk play, it fits the bill.
Electric Utilities: There are 16 S&P 500 companies in this industry, led by NextEra Energy (NEE), Southern (SO), and Duke Energy (DUK). I’ve listed selected fundamental metrics for all companies below, and it’s clear that NextEra Energy is the outlier. The clean energy leader doesn’t trade like a typical Utilities stock, as demonstrated by its 10% estimated sales and earnings growth rate alongside a relatively expensive 28.49x forward earnings valuation. It was also one of the few Electric Utilities stocks to miss sales expectations last quarter (-1.55%), but overall, it enjoys a favorable view among analysts.
The Sunday Investor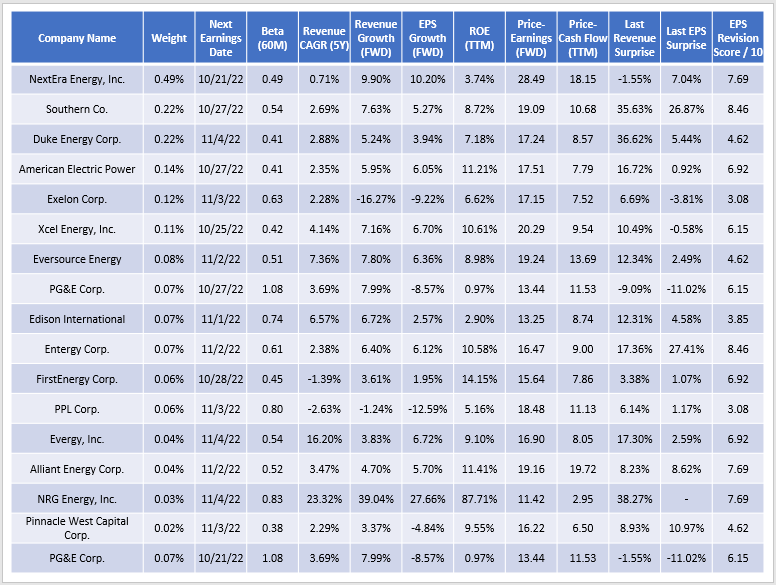
There are plenty of slower-growing options with cheaper valuations offered as compensation, but I don’t see much of an advantage in diversifying away from the largest companies. Therefore, ETFs like XLV, VPU, and FUTY should work. Per the table below, the Virtus Reaves Utilities ETF (UTES) has the best five-year total and risk-adjusted returns track record and looks to be a nice actively-managed alternative.
The Sunday Investor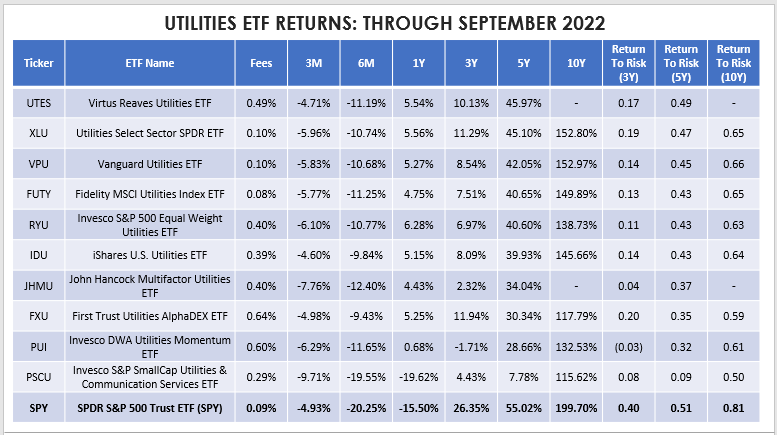
Conclusion
We’re close to what could be one of the more critical earnings seasons in recent memory, when companies like Apple, Microsoft, Alphabet, Amazon, and Tesla report. Earnings surprise trends are down, and overall analyst EPS revisions have fallen considerably even from six months ago. Market sentiment is negative, but a boost in earnings surprises is what investors need right now. Despite their excellent profitability levels, these top companies still need to prove how well-equipped they are to handle a possible recession.
Certain industries are likely to outperform should sentiment remain negative, including Integrated Oil & Gas, Managed Health Care, and Electric Utilities. SPY only has a combined 6.61% exposure to the 24 stocks in these industries, which is less than Apple’s 6.98%. Investors would do well to improve their portfolio’s diversification through some of the sector ETFs I mentioned throughout this article.
As far as SPY is concerned, the stocks high on my watchlist, along with their estimated reporting dates, are:
- Microsoft: October 27, 2022
- Alphabet: October 25, 2022
- Amazon: October 27, 2022
- JPMorgan Chase: October 14, 2022:
- Meta Platforms: October 26, 2022:
- Procter & Gamble: October 19, 2022:
- Bank of America: October 17, 2022:
- Verizon Communications: October 21, 2022
These eight companies missed earnings expectations in the last two quarters, have an average 4.75 / 10 EPS Revisions Score, and are about 8% away from their 52-week low prices. They also have a combined Index weight of 17.09%, so solid earnings beats should improve market sentiment. Mark these dates on your calendar, and I look forward to checking in on them after the dust settles. Thank you for reading.
Be the first to comment