


JuSun/iStock via Getty Images
As I wrote about more extensively in my latest market analysis SPY And QQQ Are Likely Set For A Reversal, since the Second World War, bear markets have been less frequent, with only two since the market crash during the financial crisis, while there have been multiple strong and lasting bull markets. Stock market corrections are instead quite common, with pullbacks of 10% or more in 10 of the past 20 years, but none of them has been disastrous as the market crash in 2008. With the actual market turmoil, memories of the crash in 2008 tend to come back, and we now often read about comparisons of the two situations, with some investors thinking that history will repeat itself, while others believe we are in a different market situation.
My approach is strictly pondering indicators that I consider the most important when assessing the situation of the major indexes in the US financial markets, as this is not a macroeconomic analysis and instead focuses on the SP500, it is consciously ignoring other economic indicators that may be relevant under another perspective.
The crash in 2008
Looking at the weekly chart of the SP500 tracked by the SPDR S&P 500 Trust ETF (SPY), we can indeed ascertain some similarities between the actual chart of the SP500 and the situation that led to the crash in 2008. The index has recently seemingly formed a double bottom while testing its EMA200, strong support, that the index hasn’t broken since the crash in 2020, while its relative strength, measured towards the broader small-cap market tracked by the iShares Russell 2000 ETF (IWM), is declining with increasingly negative momentum.
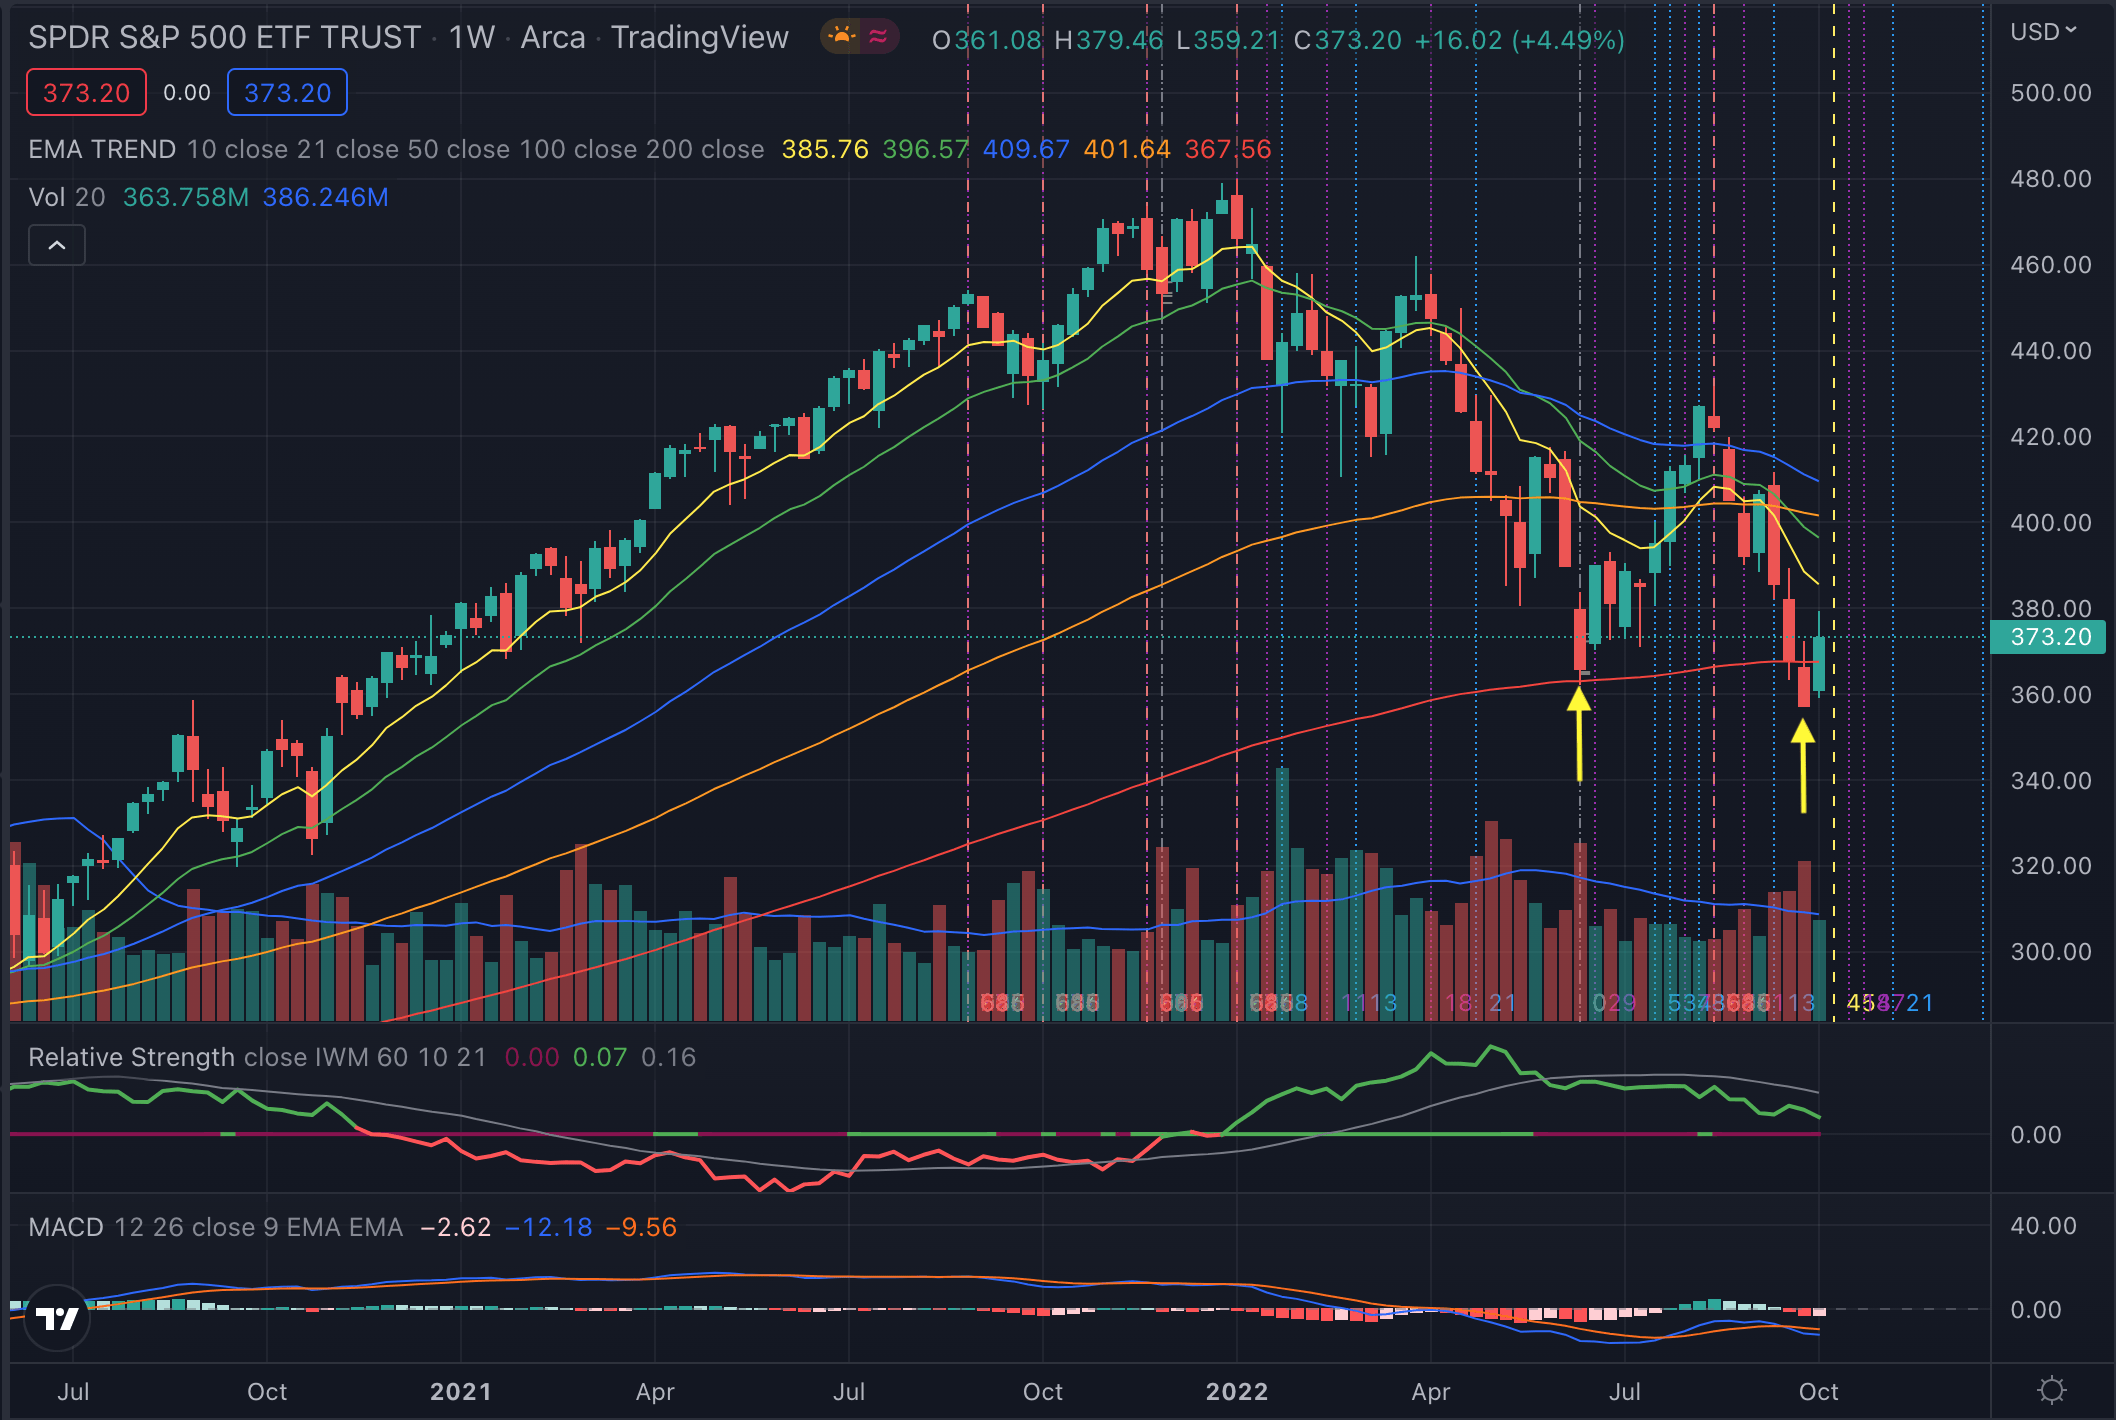
Author, using TradingView
Let’s have a look at what was going on in 2008. The S&P 500 was testing its EMA200 in its third attempt, hinting at a triple bottom, a situation that is notoriously likely a recipe for a disaster. The index was suffering major distribution weeks on increasingly high selling pressure while crossing its EMA200. The relative strength was also sharply declining and the momentum was increasingly negative.
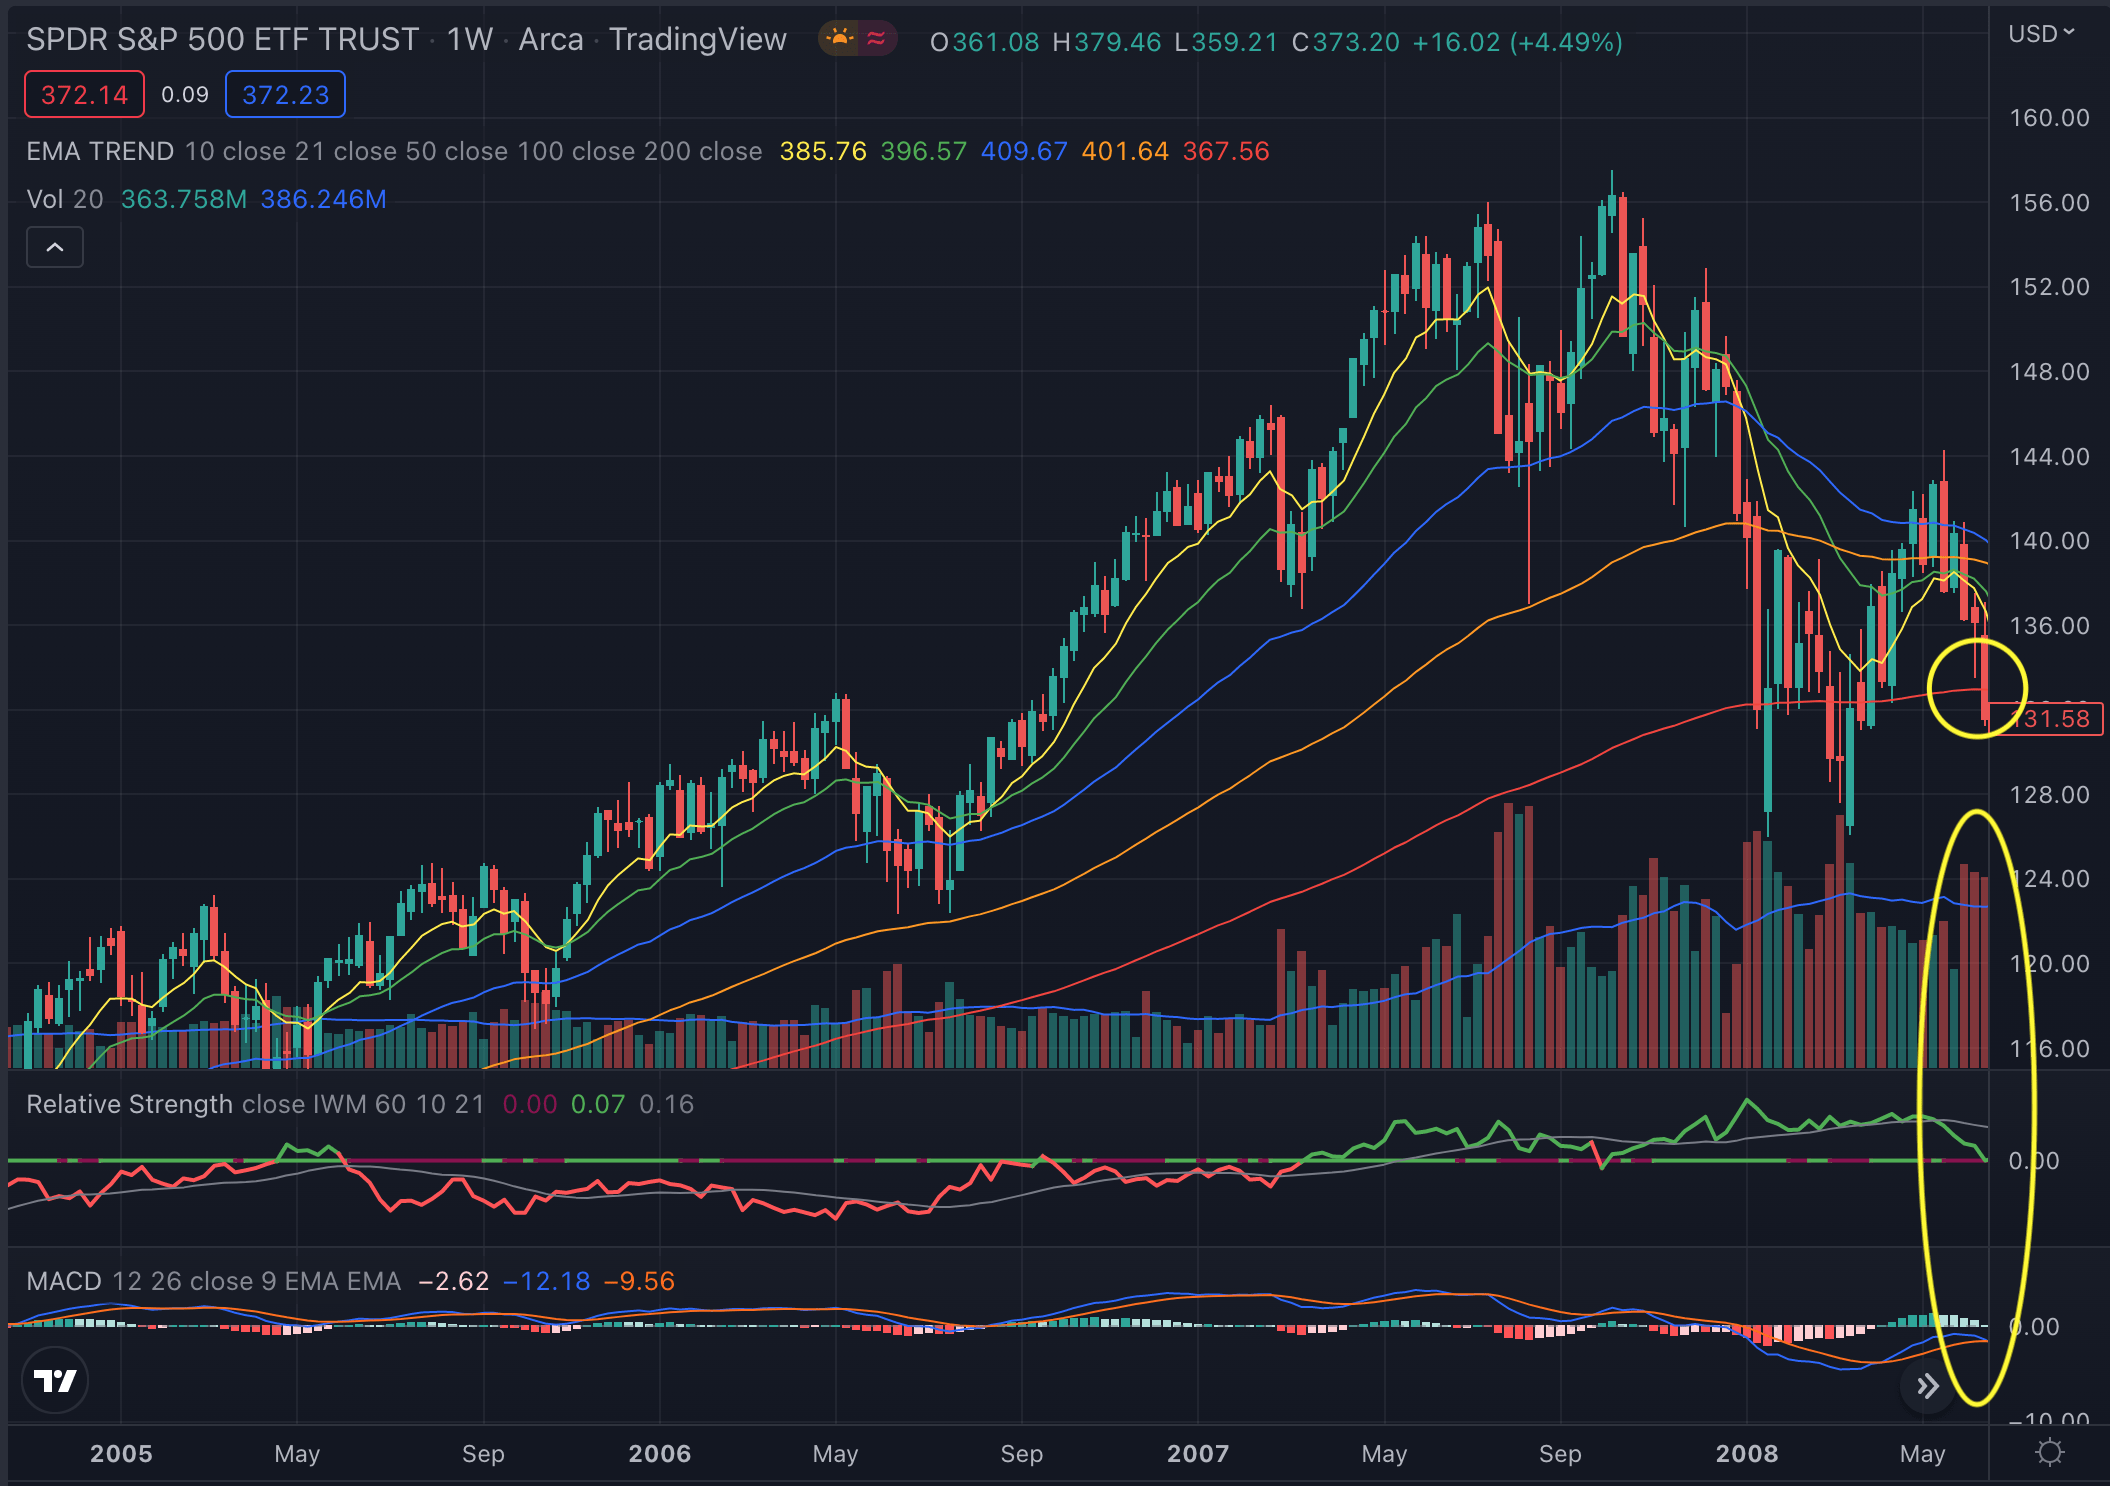
Author, using TradingView
Based on the chart of the SPY, it was indeed in a similar situation as it is now, but let’s see how it played out for the index in the next few weeks.
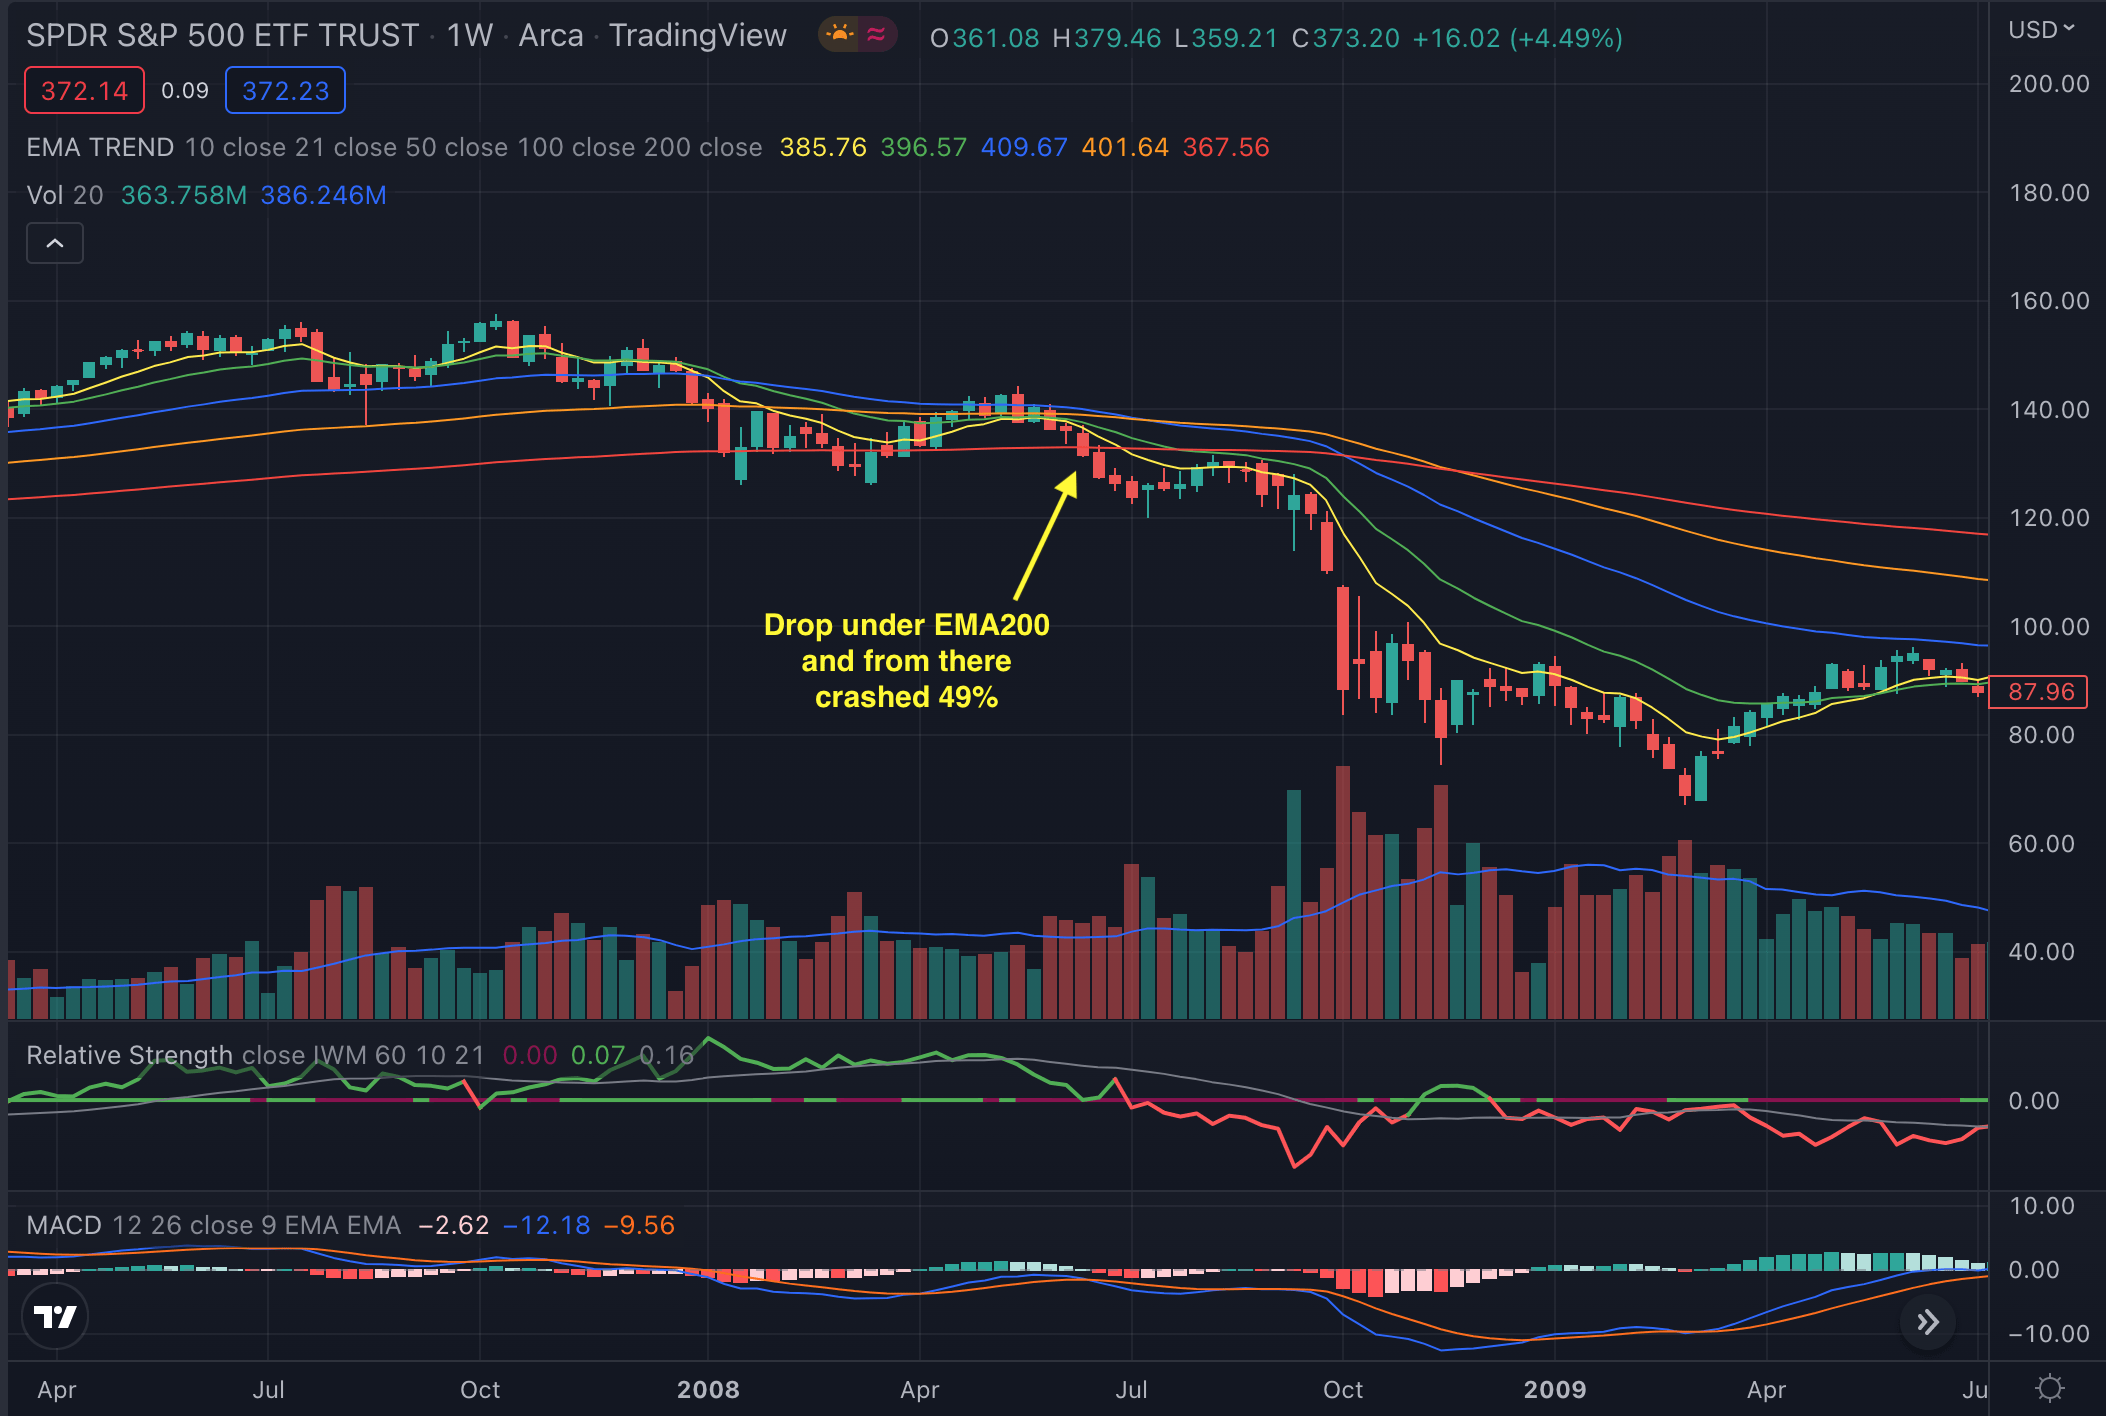
Author, using TradingView
The SP500 dropped under its EMA200 and crashed by almost 50%. It took the index 574 days to test the EMA200 again, and 840 days to consistently keep the price level over it, as the index recovered and broke even only 32 months later.
Key factors to watch
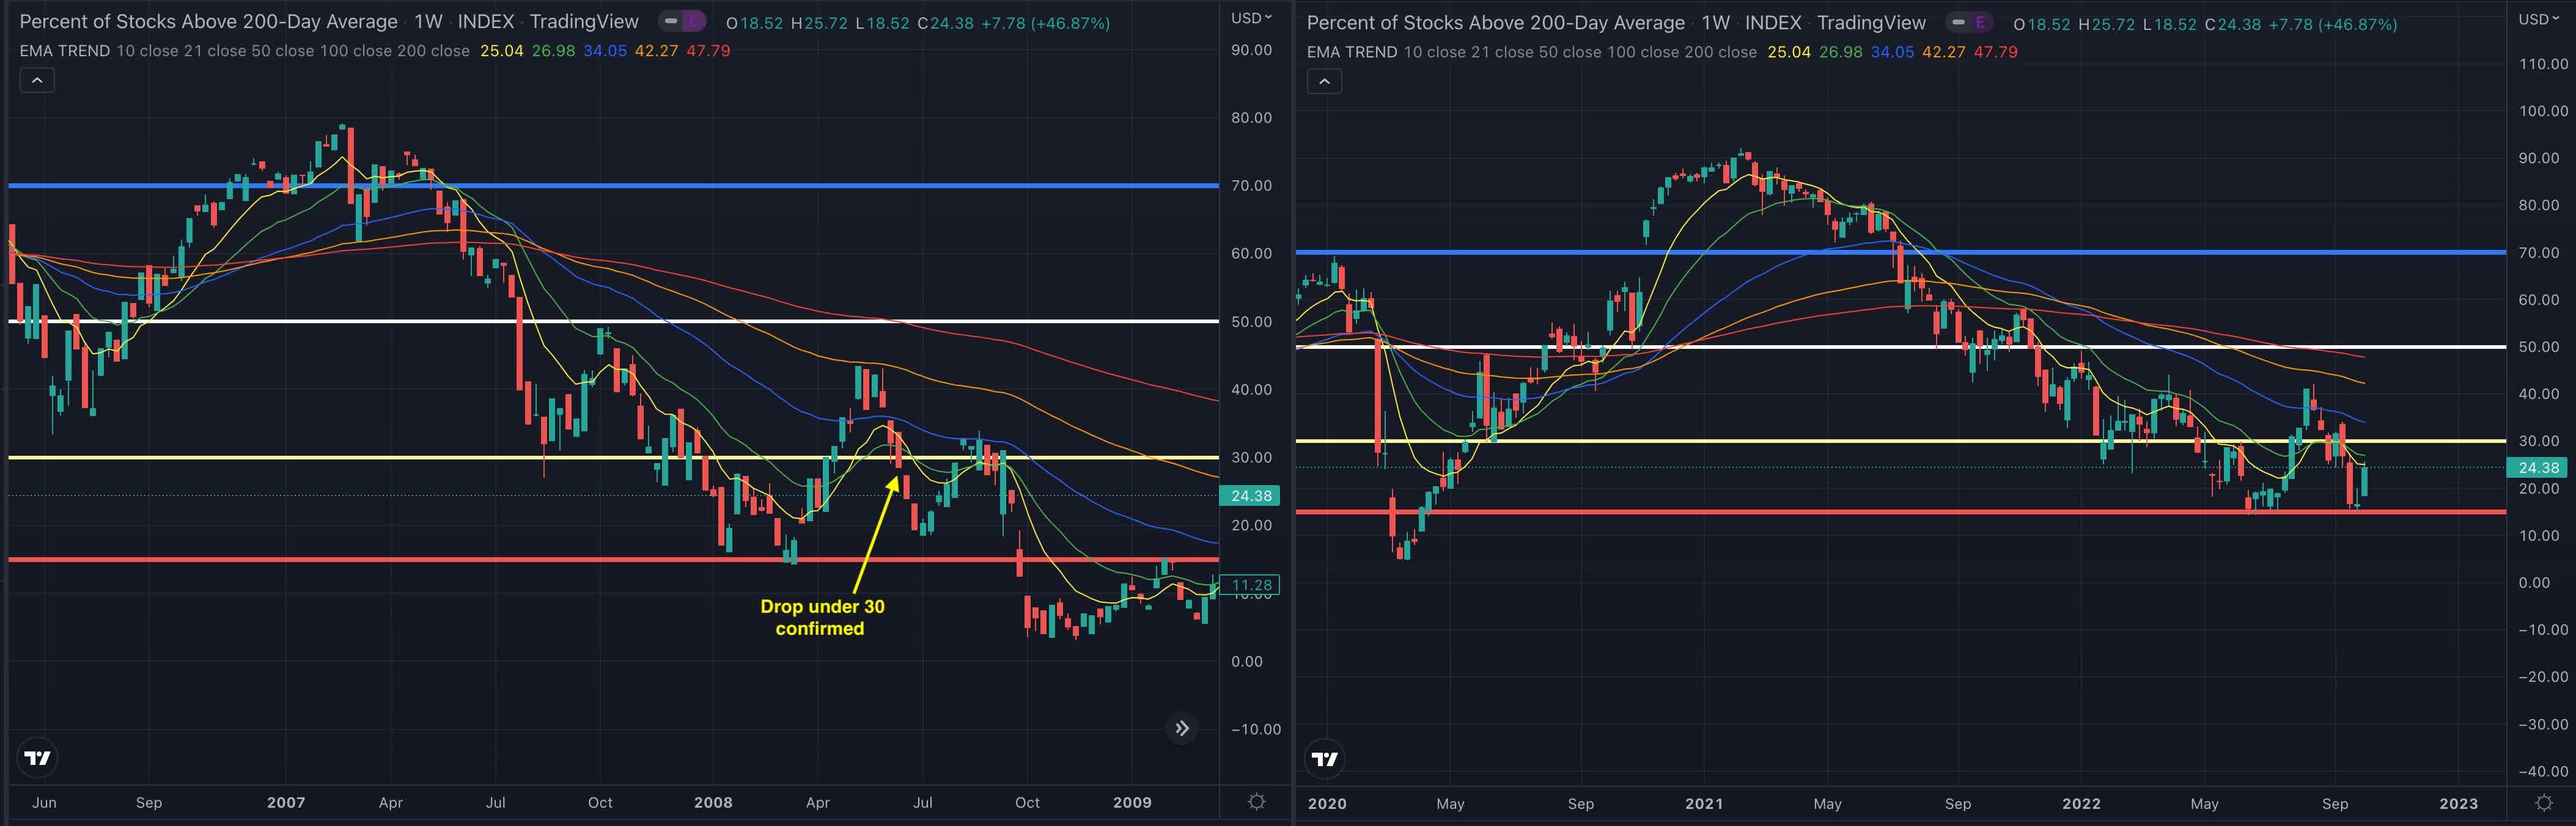
The Market Breadth is one of my favorite indicators to track the general market’s sentiment and momentum, as it refers to how many stocks are participating in a given move in an index or on a stock exchange. For this purpose, I consider two indicators. The MMFI index shows the percentage of stocks over their 50-day moving average (MAV), while the MMTH reports those over their 200-day MAV at the NYSE.
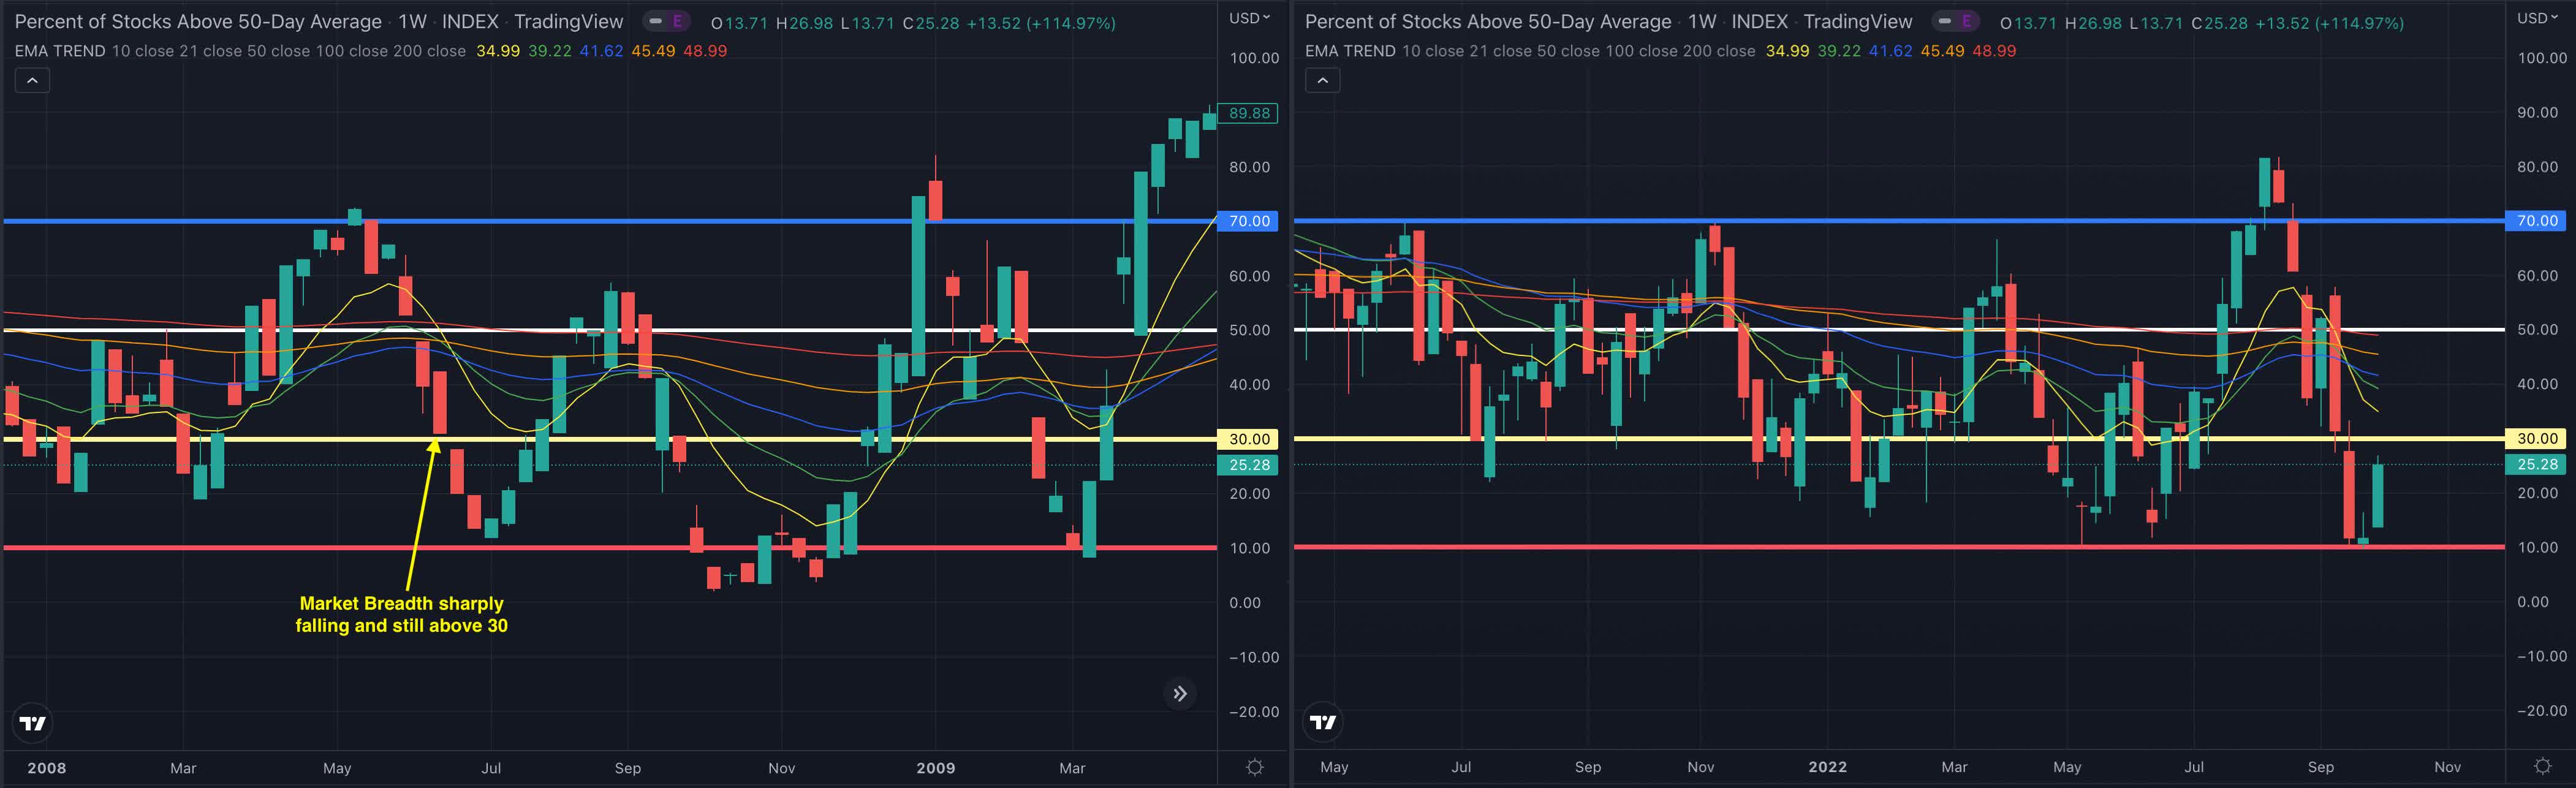
Author, using TradingView
At the time the SP500 was testing its EMA200 in 2008, the situation was quite different when considering the market breadth both the MMFI and the MMTH were rapidly declining from higher levels, as the stocks in the SP500 were still priced relatively higher than they are today, compared to their moving averages, while recently the stocks have been heavily sold off and are now giving signs of a possible reversal.
Author, using TradingView
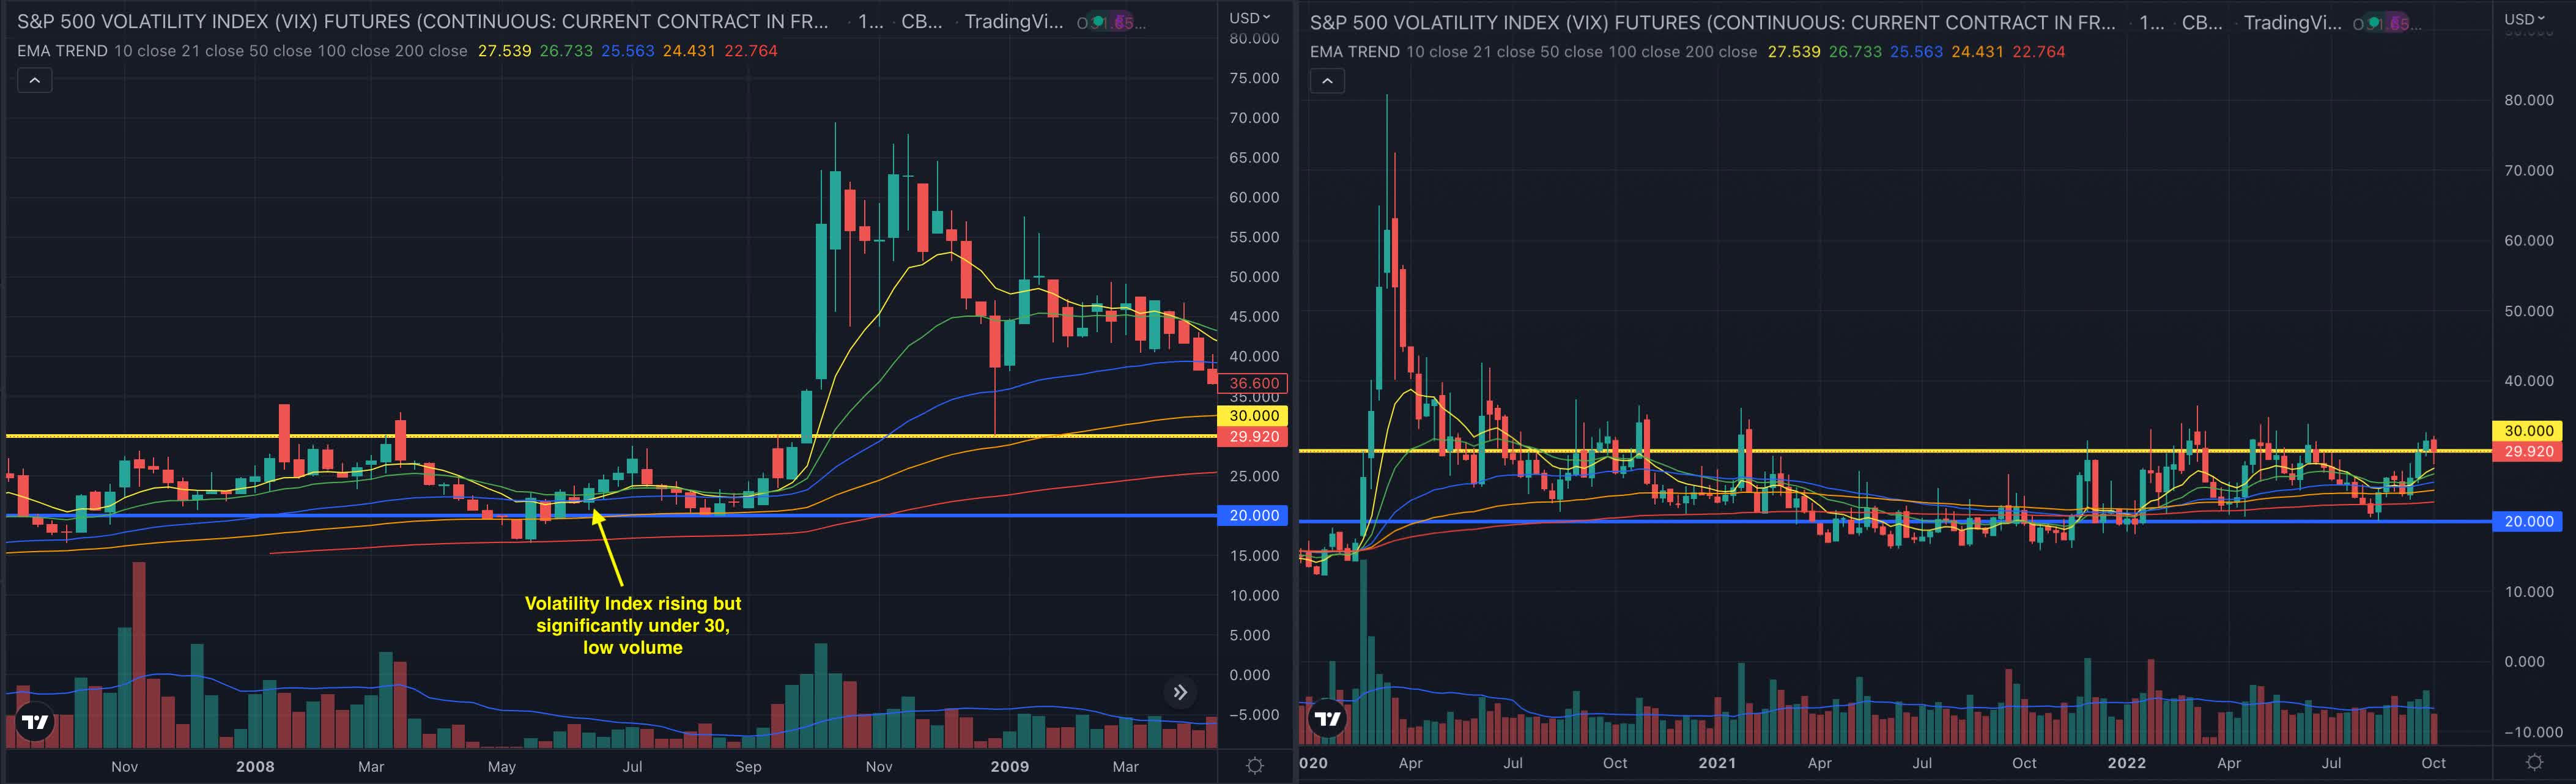
The CBOE Volatility Index (VIX) tends to be lower in bull markets and higher in bear markets, often dropping when the broader market rallies and soaring when stocks plunge. In 2008 the VIX was increasing but still significantly lower than in the actual situation, as in the past months the index was hovering between levels of 20 and 30, with sporadic spikes above as nervousness on the markets increased.
Author, using TradingView
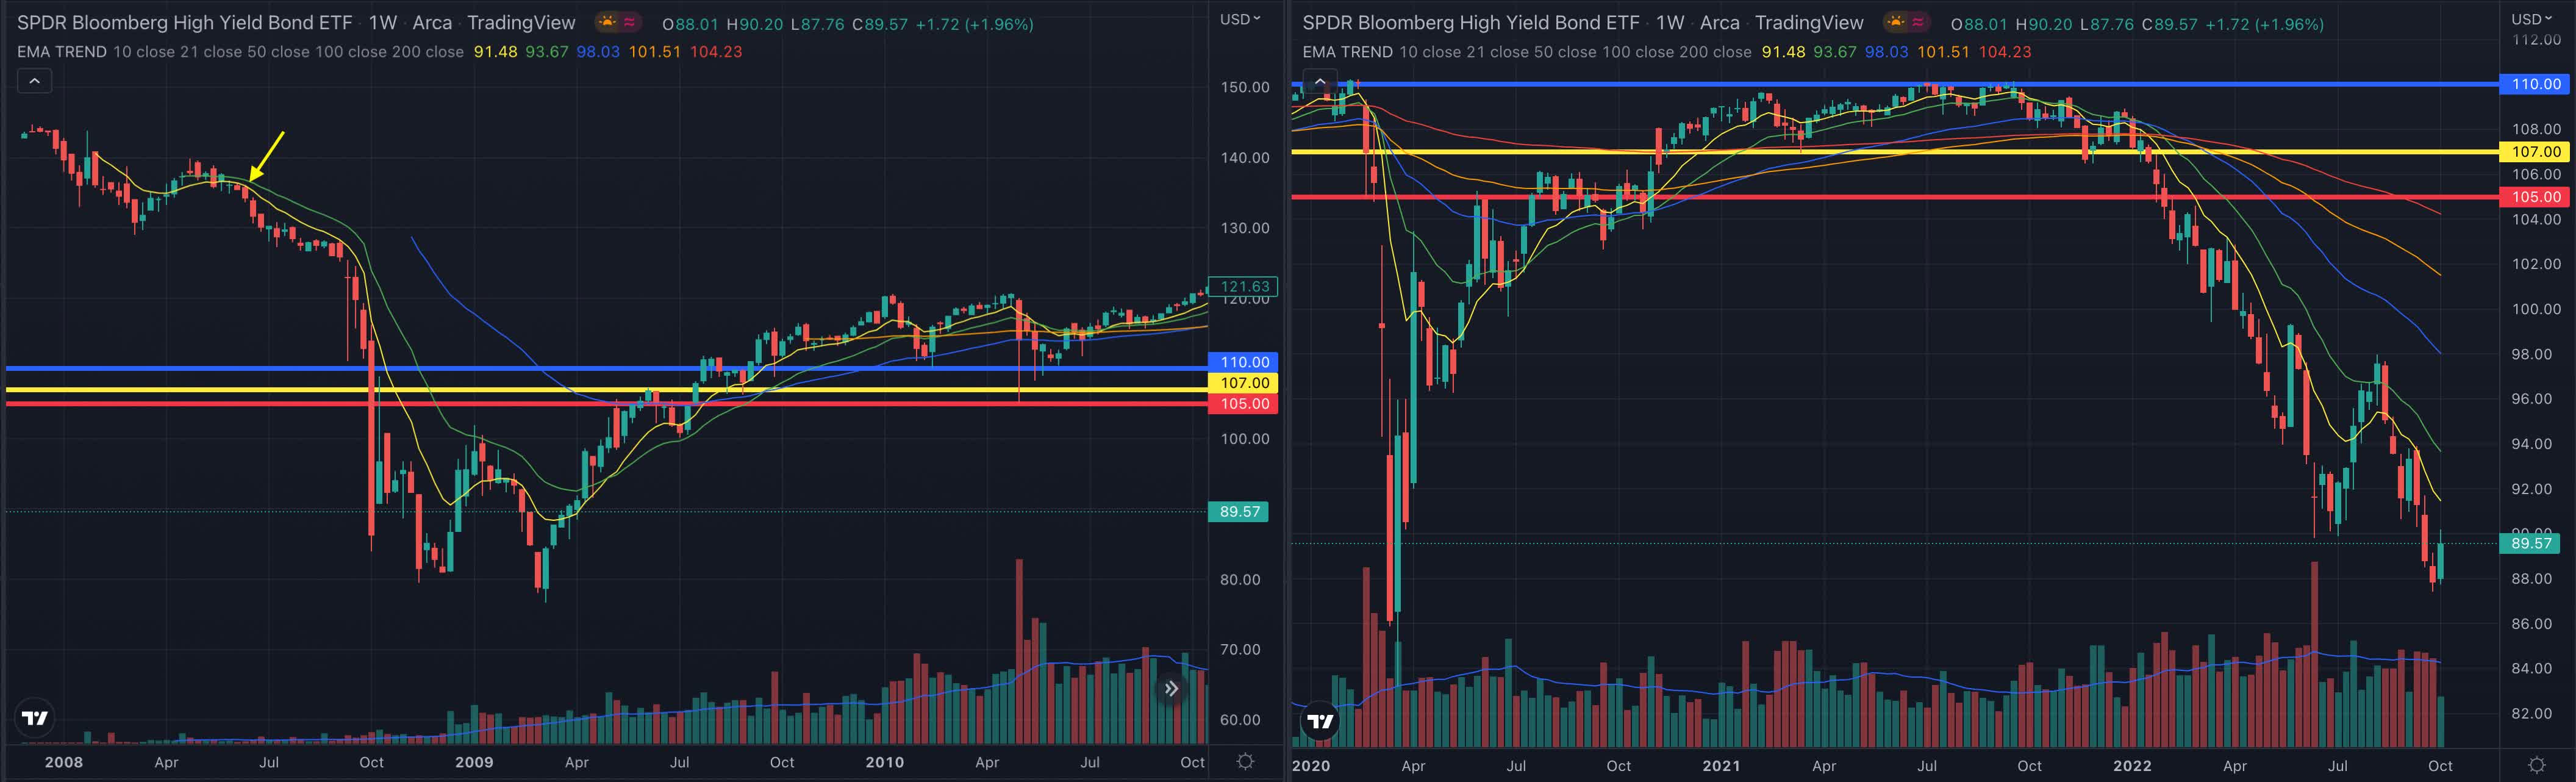
The SPDR Bloomberg Barclays High Yield Bond ETF (JNK), which tracks highly liquid, high-yield, US dollar-denominated corporate bonds, is normally dropping with increasing risk-aversion on the markets, as investors tend to sell high-risk corporate debt, causing the price of the bonds to drop as their yield increase. The recent levels are showing a high-risk aversion and are close to the bottom levels recorded during the pandemic market crash. In 2008 instead, the risk appetite was seemingly still very high, as high-yield bonds were still in demand and their price significantly higher.
Source: Author, using TradingView
In 2008 the JNK crashed in the months after the SP500 crossed its EMA200 to the levels we already saw in the pandemic crash and we see again today, underscoring the magnitude of the crash in 2008, but the actual price of the index is also hinting at the extremely high risk aversion we are already experiencing in the last few months.
The bottom line
The S&P 500 has recently suffered its worst week since March 2020, with the index reporting a three-week losing streak and the worst September since 2022, pushing the SPY under its EMA200 which is now being tested as possible resistance. Although the chart of the S&P 500 is hinting at some similarities in the price action, the underlying situation in the markets cannot be considered similar when comparing the pre-crash in 2008 with the situation we have today. Not only are there huge differences in the risk aversion of the market participants, but the components of the S&P 500 were also priced differently at the moment when the index was testing its major support level given by its EMA200.
The average bear market extends over 288 days and despite more indicators needing to be observed to conclude in this sense, the likelihood of being already over the worst part of it is increasingly high, as the S&P 500 has been in a bear market for 275 days. Can it become worse? We are definitely in a high-risk environment where multiple exogenous factors such as the international crisis caused by the war in Ukraine which seems to escalate to unprecedented levels of tension, or the high inflation rates recorded in many economies around the world could still negatively affect the markets in the coming months, but the situation cannot be compared to 2008 as the underlying conditions are not the same.
Based on those indicators, I am considering a position in the SPY, especially as I already wrote in my former analysis, it seems to be oversold at the moment and the risk aversion may have peaked, but I would keep tight stop-losses to limit the downside, as the risks are still considerably high in this market environment.
Editor’s Note: This article was submitted as part of Seeking Alpha’s best contrarian investment competition which runs through October 10. With cash prizes and a chance to chat with the CEO, this competition – open to all contributors – is not one you want to miss. Click here to find out more and submit your article today!
Be the first to comment