

Pgiam/iStock via Getty Images
This survey of widely-traded exchange-traded funds (“ETFs”) with holdings of derivatives to cause their market price to move by 2x or 3x the price moves of their underlier index has its primary focus on the Direxion Daily S&P 500 Bull 3x Shares ETF (NYSEARCA:SPXL).
How may Leveraged ETFs Hope to Profit from Past Forecasts
Market prices are being forecast every day by self-protective, disruptive actions taken by Market Makers (“MMs”) negotiating big-volume block trades for institutional investors managing their $Billion equity investment portfolios.
Records of market outcomes following such daily forecasts make their trends visually follow-able, and their rewards and risk exposures explicit in graphic form. The pictures seen below are the negotiated forecast outcomes, not some hoped-for tools to guess at what may happen later. While there are no guarantees of the future, examples in hand are far better than hypotheses of assertion without evidence.
Moreover, the outcomes follow identical strategy disciplines for all stocks, making expectations of forecasts directly comparable. In that way, personal preferences can be carefully followed.
We start with comparisons of reward prospects and risk exposures.
Figure 1
blockdesk.com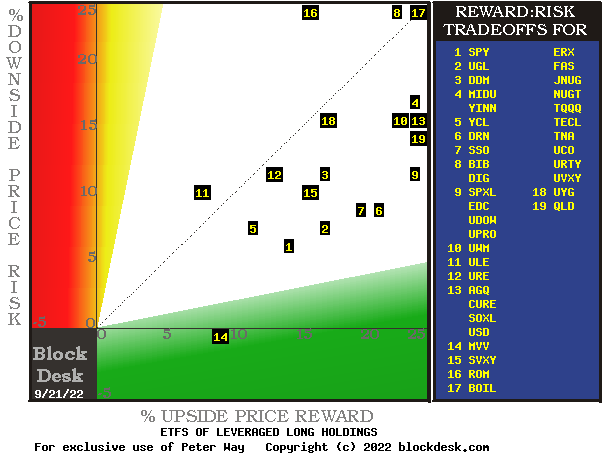
(Used with permission.)
Expected rewards for these securities are the greatest gains from current closing market price seen worth protecting short positions. Their measure is on the horizontal green scale.
The risk dimension is of actual price drawdowns at their most extreme point while being held in previous pursuit of upside rewards similar to the ones currently being seen. They are measured on the red vertical scale.
Both scales are of percent change from zero to 25%. Any stock or ETF whose present risk exposure exceeds its reward prospect will be above the dotted diagonal line. Capital-gain attractive to-buy issues are in the directions down and to the right.
Our principal interest is in SPXL at location [9]. A “market index” norm of reward-risk tradeoffs is offered by SPY at [1]. The most appealing (to own) by this Figure 1 view may be SPXL.
Comparing features of Alternative Investment Stocks
The Figure 1 map provides a good visual comparison of the two most important aspects of every equity investment in the short term. There are other aspects of comparison which this map sometimes does not communicate well, particularly when general market perspectives like those of SPY are involved. Where questions of “how likely’ are present other comparative tables, like Figure 2, may be useful.
Yellow highlighting of the table’s cells emphasizes factors important to securities valuations and the security SPXL, most promising of near capital gain as ranked in column [R]. Pink cell fills indicate inadequate proportions of essential performance competitive requirements, as in [T] where [F] Risk exposure exceeds [E] Reward opportunity.
Figure 2
blockdesk.com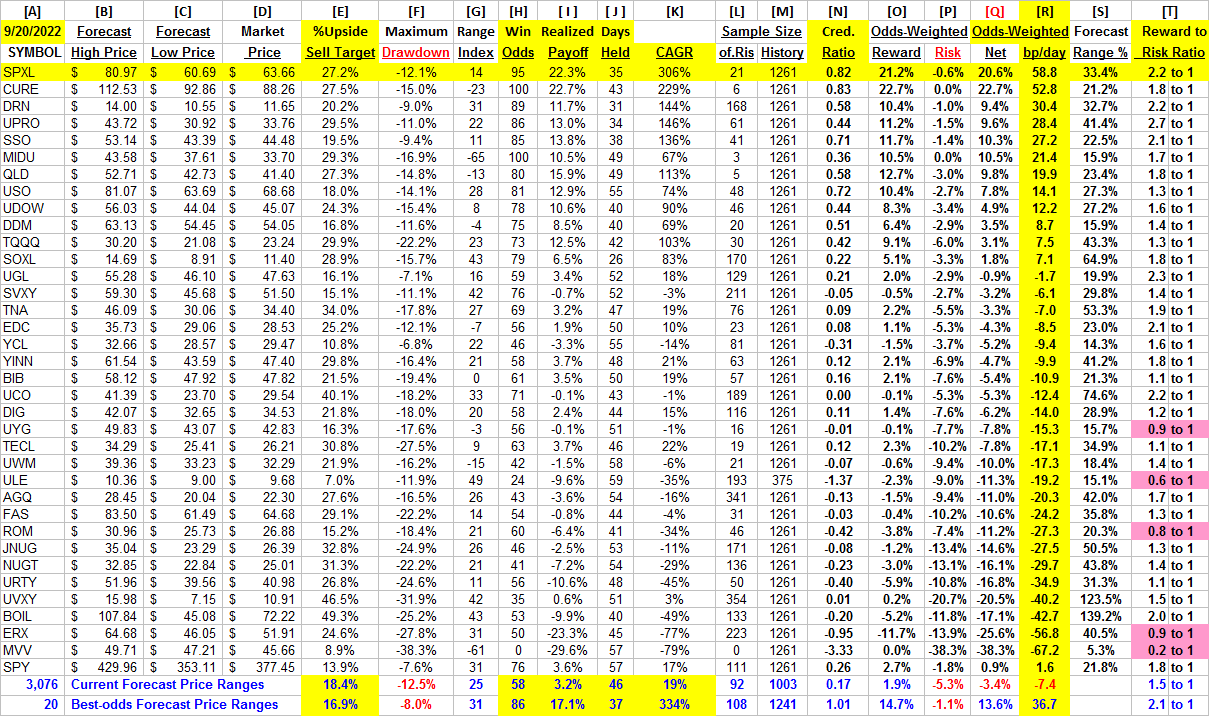
The price ranges implied by the day’s transactions activity are in columns [B] and [C], typically surrounding the day’s closing price [D]. They produce a measure of risk and reward we label the Range Index [G], the percentage of the B to C forecast range which lies between D and C.
Today’s Gs are used for each stock’s past 5-years of daily forecast history [M] to count and average prior [L] experiences. Fewer than 20 of Gs or a shorter history of Ms are regarded as statistically inadequate.
[H] tells what percentage of the L positions were completed profitably, either at range-top prices or by market close above day after forecast close price entry costs. The Net realization of all Ls is shown in [I].
[I] fractions get weighted by H and 100-H in [O, P, & Q] appropriately conditioned by [J] to provide investment ranking [R] in CAGR units of basis points per day.
Additional market perspective is provided by the 3,000+ securities for which price range forecasts are available. They currently suggest that while market recovery is underway, it is still far from generally attractive.
On the other hand, R column scores for SPXL and the top 20 forecast population support the primary candidate’s competitive capability.
Recent Trends of Price Range Forecasts for SPXL
Figure 3
blockdesk.com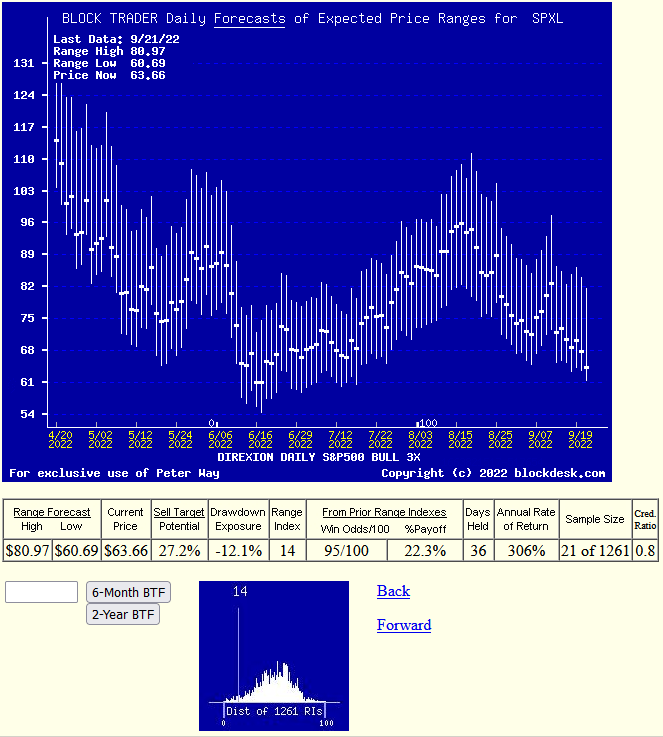
(Used with permission.)
This is not a typical “technical analysis chart” of simple historical (only) observations. Instead, it pictures the daily updated Market-Maker price range forecasts implied by live real-capital commitments in real time.
Its communicative value is present here by visual comparisons of the proportions of upside and downside price change expectations at each forecast date. Expectations of the market-making community, as influenced by the actions of an interested and involved big-$ institutional investing participants.
Those forecasts are typically resolved in time horizons of less than a half year, and often in two months or shorter. This one states that of the 21 prior forecasts like today’s, some 19 of every 20 were profitable, completed in 36 market-days (7+ weeks) profitably at average +22% gains, a CAGR rate of 306%. No promises, just fun with history.
Conclusion
Comparison of the performances of near-term Market-Maker forecasts for Direxion Daily S&P 500 Bull 3x Shares ETF with similar forecasts of other Leveraged-Long ETF securities pursued by investor referencing makes it seems clear that this ETF can be an attractive investment choice for investors pursuing near-term capital gain strategies.
Be the first to comment