

baona/iStock via Getty Images
Comparing The Two Cheapest And Highest Yielding Net Lease REITs
Spirit Realty Capital (NYSE:SRC) and Alpine Income Property Trust (NYSE:PINE) are the two highest yielding net lease real estate investment trusts (“REITs”) that are diversified by tenant industry.
Specialized net lease REITs that are concentrated in one particular tenant industry, such as EPR Properties (EPR) in movie theaters and Innovative Industrial Properties (IIPR) in cannabis cultivation facilities, currently have higher yields, but SRC and PINE are the highest yielding and cheapest among their comparable peers.
| Spirit Realty | Alpine Income | |
| Price to AFFO | 12.0x | 11.4x |
| Dividend Yield | 6.2% | 5.9% |
| YTD Payout Ratio | 74% | 57% |
Other than being diversified by tenant industry, SRC and PINE share a few other things in common. For example, both are active in capital recycling, and both raised their AFFO per share guidance for 2022 in the second quarter.
In this article, we will compare and contrast these two high-yielding net lease REITs and try to determine which one makes the best buy today.
Basic Facts
While SRC is internally managed, PINE is externally managed by the management team at CTO Realty Growth (CTO), a shopping center retail REIT. Though external management structures often misalign interests between management and shareholders, PINE’s structure avoids this pitfall with relatively low quarterly management fees. CTO also owns 16% of PINE, which further aligns interests.
What’s more, management has stated their intention to internalize the management structure for PINE once the portfolio reaches a critical mass capable of making that financially viable.
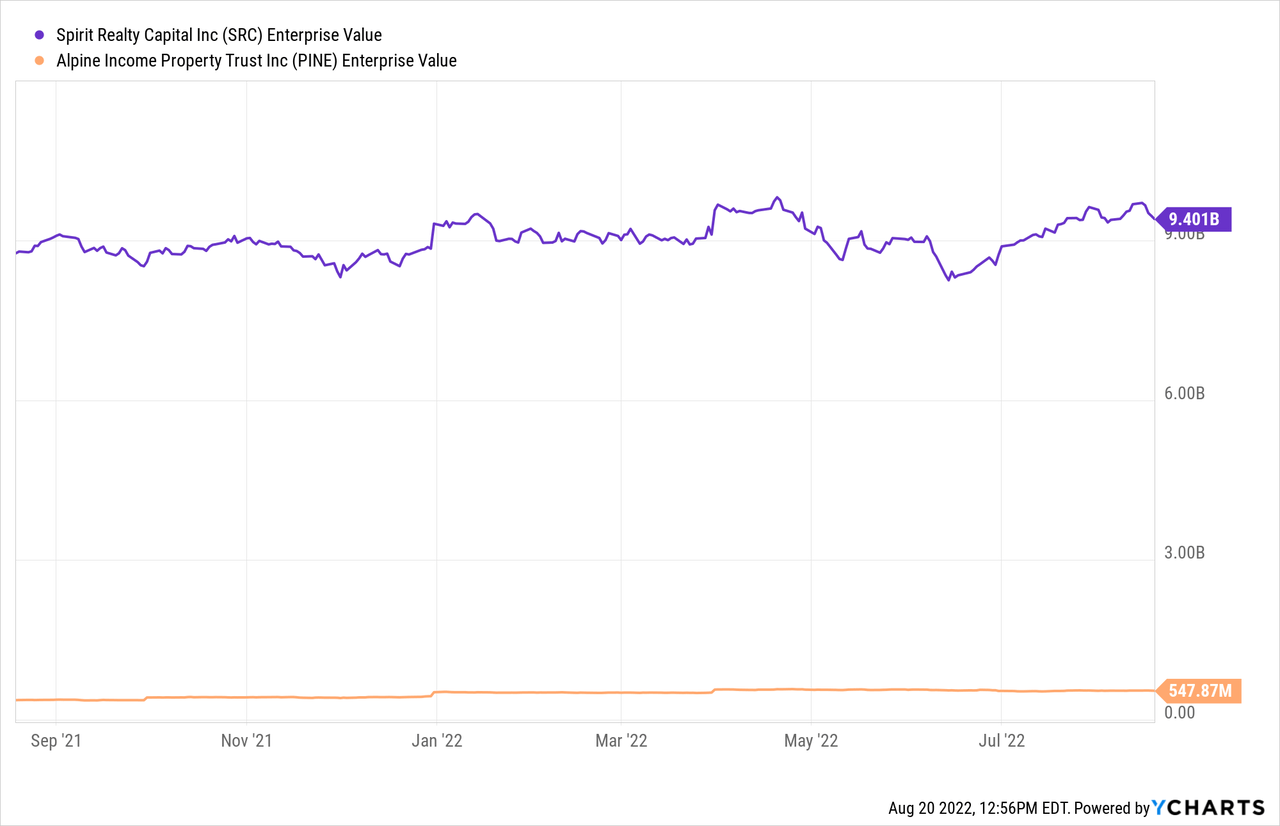
There is also a huge size difference between the two REITs, as SRC has been around for a long time, while PINE only went public in late 2019.
SRC is a little over 17x bigger than PINE by enterprise value.
Though both REITs are actively acquiring properties, the bigger a REIT’s portfolio is, the harder it is to grow via acquisitions. Hence, why PINE’s AFFO per share growth rate has been so much faster than SRC’s this year:
| Spirit Realty | Alpine Income | |
| Q2 ’22 AFFO/sh Growth | 4.7% | 20.5% |
| 2022 YTD AFFO/sh Growth | 9.9% | 15.9% |
Though PINE’s double-digit growth is obviously impressive, SRC’s growth shouldn’t be ignored or minimized. For a REIT its size, a nearly 10% YTD AFFO per share growth rate is nothing to sneer at!
Portfolio Comparison
Below, we find a head-to-head comparison of some basic portfolio metrics:
| Spirit Realty | Alpine Income | |
| Property Count | 2,078 | 143 |
| Occupancy | 99.8% | 100% |
| WALT | 10.3 Years | 8.0 Years |
| Investment-Grade Tenancy | 21.8% | 49% |
| Portfolio Composition | 71% Retail / 20% Industrial | 100% Retail |
| Avg. Rent Escalations | 1.5% to 2% | 0.75% to 1.25% |
First, notice the difference in property count. SRC owns nearly 15x the number of properties as PINE. Despite that, SRC’s occupancy is virtually identical to that of PINE.
Second, notice that SRC’s weighted average lease term is over 10, while PINE has two years less of term at 8 years. SRC wins here.
Third, notice that PINE has over double the investment grade tenant exposure as SRC. It is somewhat easier to have a higher IG exposure when one’s portfolio is as small as PINE’s, because management can be more selective about acquisitions. PINE wins here.
Fourth, notice that while PINE is 100% retail, SRC’s portfolio has grown its industrial segment to 1/5th of the NOI. These properties typically have higher rent escalations and experience greater rent growth over time. SRC wins here.
Fifth, notice that SRC’s weighted average annual rent escalations are nearly double those of PINE (largely because of the latter’s focus on IG tenants and retail properties like pharmacies, which frequently feature flat leases). SRC wins here.
When it comes to property types and tenant industries, SRC boasts a greater amount of diversification in accordance with its much larger portfolio. It owns both retail and industrial properties as well as a few select office properties, country clubs, and data centers. Within retail, its portfolio is split across service-oriented, discretionary, and essential properties.
Spirit Realty Q2 Presentation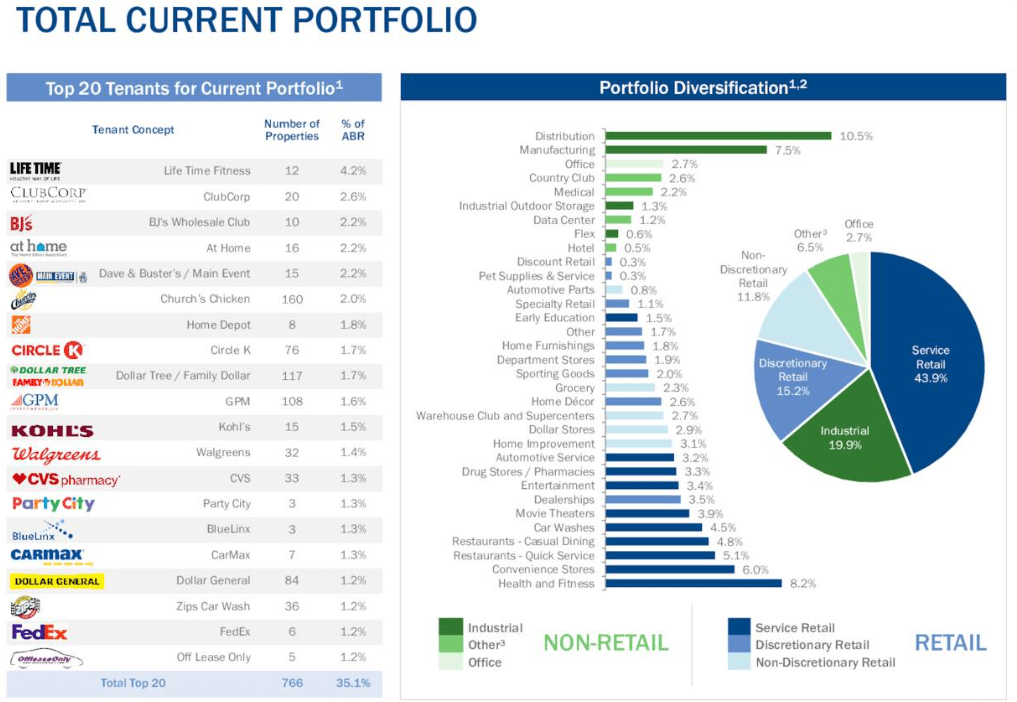
The REIT’s top tenants list demonstrates management’s willingness to look virtually anywhere they can find a good deal.
SRC’s top 10 property types are:
- Distribution (10.5%)
- Health & fitness (8.2%)
- Manufacturing (7.5%)
- Convenience stores (6%)
- Quick service restaurants (5.1%)
- Casual dining restaurants (4.8%)
- Car washes (4.5%)
- Movie theaters (3.9%)
- Car dealerships (3.5%)
- Entertainment (3.4%)
Compare these to PINE’s top 10 property types:
Alpine Income Q2 Presentation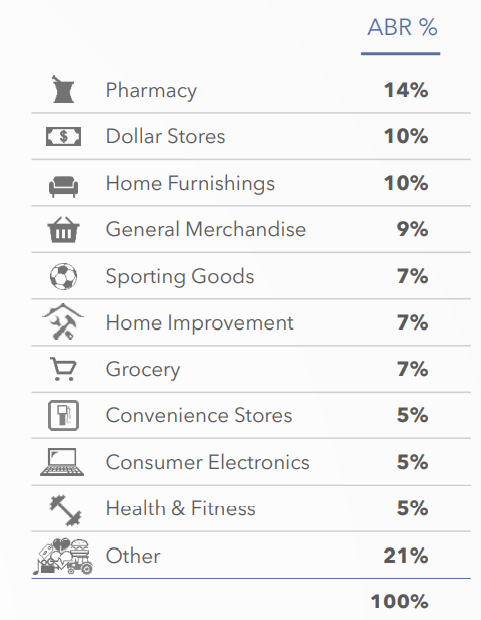
By tenant credit quality and the essentiality of its retail tenants’ industries, PINE’s portfolio is significantly stronger than that of SRC. One can see the difference when comparing top tenant lists. Here is PINE’s:
Alpine Income Q2 Presentation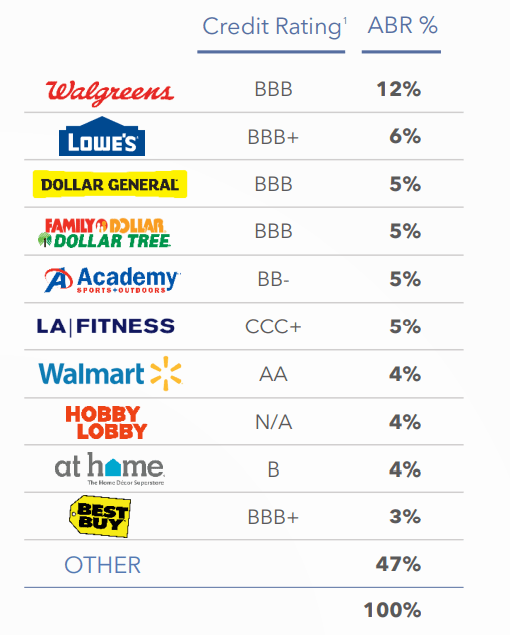
There are pros and cons of each REIT’s portfolios. PINE’s strength is undoubtedly in its tenant credit quality. But SRC’s strength is in its industrial exposure, higher rent escalations, and longer weighted average remaining lease term.
Balance Sheet
If PINE wins in overall portfolio quality, SRC is indisputably the winner in balance sheet quality.
While SRC sports an investment grade credit rating of BBB, PINE does not have a credit rating. The company is simply too small to pursue one at this point.
SRC’s weighted average interest rate on total debt sits at 2.92%, and the remaining years to maturity averages over 6 years. Virtually 100% of debt is unsecured, and the REIT has no debt maturities until 2026. What’s more, SRC has the second-highest fixed charge coverage ratio in its peer group, behind only W.P. Carey (WPC), at 6.0x.
Spirit Realty Q2 Presentation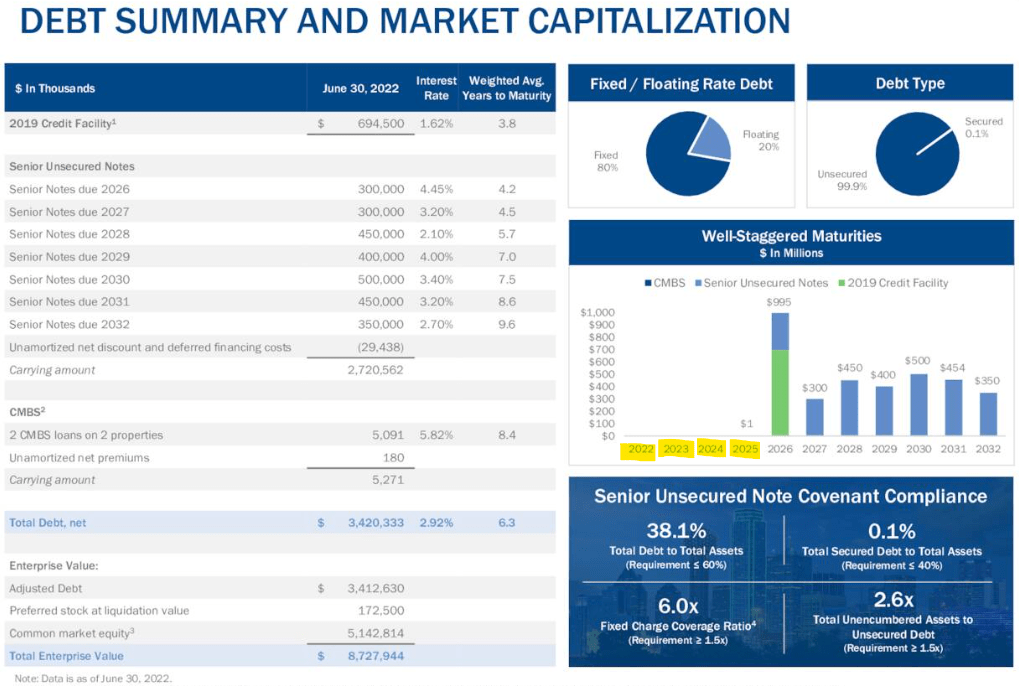
Not shown in the above image is SRC’s net debt to EBITDA of 5.2x.
Compare that to PINE’s net debt to EBITDA of 8.3x.
Alpine Income Q2 Presentation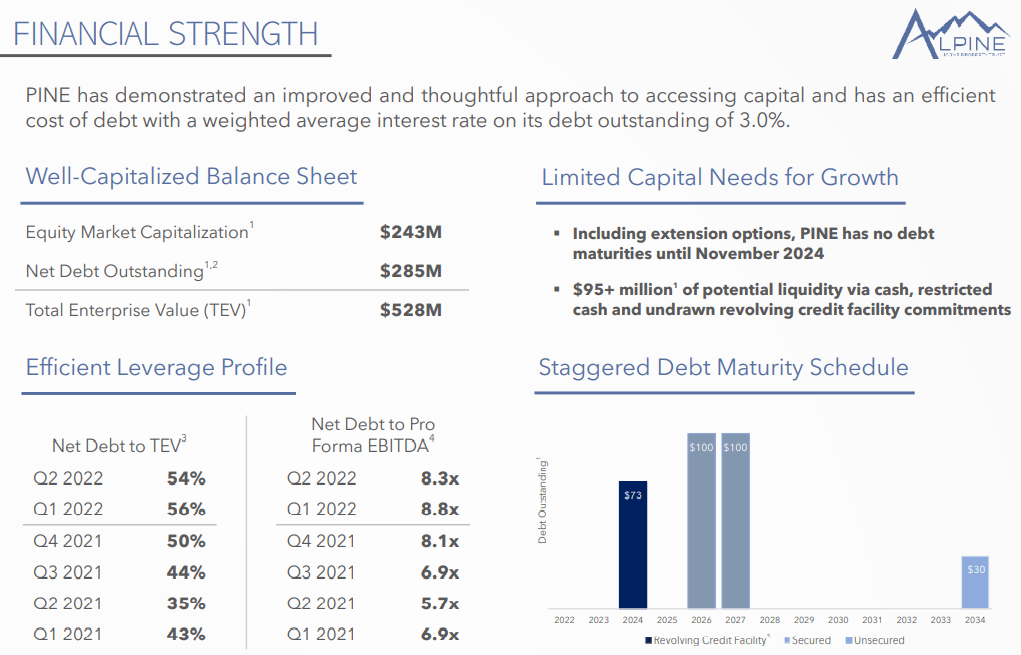
Compare also SRC’s net debt to enterprise value of 36% to PINE’s 55%.
Meanwhile, SRC’s credit facility borrowings make up 20% of total debt, while PINE’s credit facility borrowings make up 24%. And compared to SRC’s weighted average interest rate of 2.92%, PINE’s 3.0% is slightly higher. What’s more, that rate should rise a little bit faster for PINE than for SRC because PINE has drawn more on its credit facility.
In almost every way, SRC boasts the stronger balance sheet than PINE.
Bottom Line
Surely an argument could be made for the superiority of either of these REITs over the other.
But it is also important to note that both REITs are disadvantaged in their pursuit of external growth due to relatively high costs of equity. Generally speaking, net lease REITs use a larger share of equity than debt to fund growth investments. With high dividend yields equating to high cash costs of equity, both REITs’ weighted average cost of capital is higher than it is for their peer group.
To compensate for this, both REITs generally buy higher cap rate properties that are perceived by the market to bear higher risk. SRC has sought out higher cap rates from sale-leasebacks with niche tenants like LifeTime Fitness and ClubCorp (a golf course/country club operator). PINE has sought out higher cap rates by purchasing retail properties with less remaining term on the lease and/or with less appealing locations.
Though I acknowledge that PINE’s tenant credit quality is higher, I favor SRC because of its stronger balance sheet with no debt maturities until 2026 as well as its increasing portfolio tilt toward industrial properties.
With a dividend yield of 6.2%, SRC only needs to generate growth of around 4% annually to deliver 10%+ total returns, even if the market never awards the stock a higher AFFO multiple. I believe that between rent escalations, external growth, and accretive capital recycling, SRC should easily be able to generate that level of growth, and thus I am confident in its ability to perform well over the long term.
What’s more, if the economy does fall into a recession in the next few years, SRC will have no debt maturities to have to deal with. And the dividend payout ratio in the low 70% range, along with the recent ~4% hike, indicates that the dividend will likely remain safe even through a difficult economic environment.
Be the first to comment