

Oselote
As we do each Monday, in last night’s Closer we recapped the latest Commitments of Traders data from the CFTC. This data set provides a look at how speculators have positioned themselves (long or short) in various futures. We show those readings as a net percentage of open interest. In other words, higher positive values indicate a much larger share of open interest is positioned long, and vice versa for negative readings.
In the commodities space, after longs backed out in a big way earlier this year, readings have risen rapidly in gold, silver, copper, and palladium futures. As for how sharp of turnarounds they have been, the increase over the past two weeks rank in the top decile of all periods in data going back to the mid-1980s for each of the previously mentioned metals.
Speculator Net Position (% Of Open Interest, Futures Only) (Author)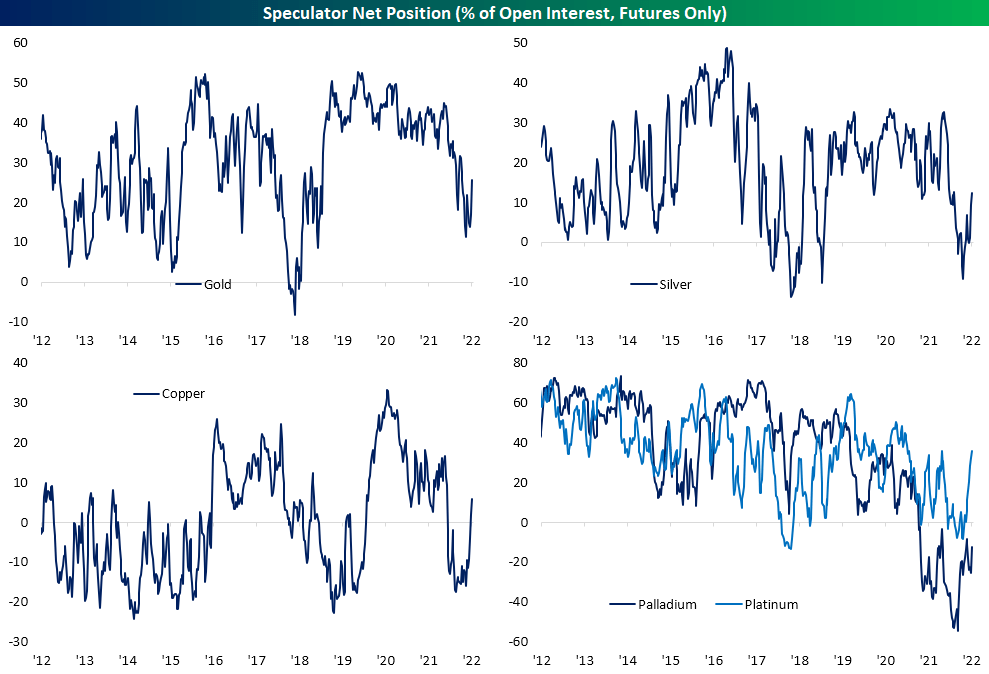
For the most widely followed of these metals (gold, silver, and copper), this is only the 14th time on record each of their two-week changes ranked in the 90th percentile or above in the same week without another occurrence in the prior three months. The most recent occurrence of such a large broad increase in major metals positioning was in July 2014.
Although these readings indicate that speculators are increasingly placing long bets on these futures, such data actually can be a bit of a messy indicator for forward performance. Although these readings indicate bullish sentiment, forward performance is the opposite in the near term with dramatic underperformance relative to the norm one week later (which we have seen play out so far). One-month and three-month performance tends to see further declines in these commodities as well, which is not exactly unheard of for precious metals, while it is dramatically weaker for the industrial metals. Six-month performance is generally more in line with historical norms, while the bullishness in positioning only seems to come through to price action one year out. One-year average returns for gold, silver, and copper are much stronger than the norm, although positivity rates are still just barely above 50/50. (Past performance is no guarantee of future results.)
Metal Commodity Performance After Bullish Positioning Surges (Author)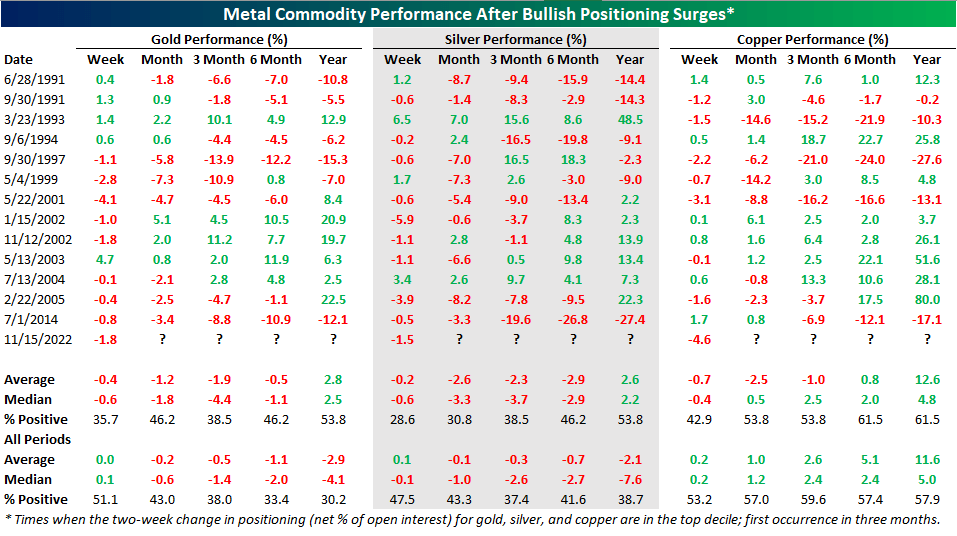
Editor’s Note: The summary bullets for this article were chosen by Seeking Alpha editors.
Be the first to comment