

alvarez/E+ via Getty Images
The Theoretical Investment Edge Of Bulldog Investors
The Special Opportunities Fund (NYSE:SPE) is a closed-end fund that holds many other CEFs, and the manager is Bulldog Investors. Often when this is explained to investors, the first reaction is to question why would one pay fees to invest in other funds that charge fees?
The answer might be because you can buy a discounted fund that itself owns other discounted funds.
CEFs are a section of the market that many traditional fund managers ignore, yet retail investors gravitate to in the hunt for yield. There are plenty of market inefficiencies to exploit. This is an important point to note as discussed in this old CEF academic paper.
Bulldog Investors have decades of experience focusing on CEFs, so it is not unreasonable to expect they could add plenty of alpha due to their focus on this niche. They also have the legal expertise and fight, hence the name Bulldog Investors. This is required to use shareholder activism techniques to close the discounts to NAV on their targeted holdings.
The large discounts they acquire the CEFs at should more than compensate for the fee drag that occurs by owning them. The same theory can be used for the investors that buy SPE itself, which usually trades at a large discount to NAV.
In terms of the fees of SPE, their annual management expense ratio is approximately 1.6%.
Time to judge Bulldog Investors over the cycle
I am willing to view the recent relative performance from the perspective of the fund’s stated risk / return objectives. They aim to achieve equity like returns with much less risk.
Now that the first half of 2022 has seen large declines in the S&P 500, I thought this was an opportune time to check back on my SPE thesis from 3 years ago. At the time of my last SPE article in 2019, we had experienced a stock market bull run a decade long with little interruptions to the trend.
Today however we have more of a full cycle to judge SPE on. A cycle that has seen some significant downside volatility not only this year, but also during 2020. Was the fund’s aims achieved in the context of drawdowns that occurred in such bear markets?
Performance in recent bear markets
SPE still looks to have struggled to keep pace with the S&P 500 on a total return basis over this 3-year volatile period I just mentioned.
Seeking Alpha – SPE Returns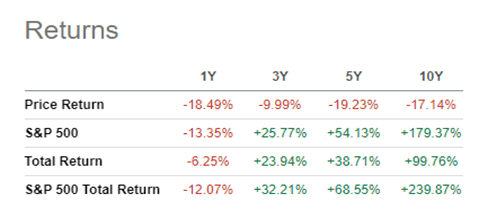
In terms of the last 12 months however, we can see that the fund as fared better than the returns of the S&P 500. This offers some support to suggest that SPE might be delivering on their objective of less risk. I also however wanted to explore if their drawdown during the 2020 covid crash was milder than the index.
In the case of the index, the S&P 500 suffered a 34% drawdown. This drawdown was very fast, only about 6 weeks. For SPE I simply went to CEF Connect and looked at how much the SPE NAV fell in the same period and allowed for one distribution payment that was paid out. That led me to conclude that the drawdown for SPE shareholders was more like 43%, quite a bit worse than the S&P 500.
Performance in bear markets of prior decades
It is very rare these days that we can analyze some fund managers over a period of almost 30 years! Although SPE was born out of an activism opportunity itself if 2009, the three investment professionals involved here were also working together in the late 1990s. Bulldog Investors was established in 1993 so the original hedge fund has a longer timeframe to examine. A 2018 interview with founder Phil Goldstein and co manger Andrew Dakos explored their strategy of equity like returns with lower risk.
It therefore makes sense to take into consideration how they performed during the bear markets of the years 2000 and 2008.
Here is a direct quote from the interview I referred to:
“Most importantly, from 2000-2002 they had their best market outperformance (+5% vs. -22% for the S&P 500) and in 2008 they had what was likely the only long only equity fund that was positive (by 2%) – it was invested solely in SPACs — while the S&P 500 was down 37%. They typically lag performance wise when growth is in favor such as now and leading up to the 2000 market debacle, but they more than make up for it during major market swoons.”
Is the SPE portfolio therefore less risky?
The 2020 bear market saw SPE suffer a worse drawdown than the S&P 500, yet in 2022 the bear market has seen SPE outperform. Why such a difference? I put this down to 2020 being considered a unique type of bear market (pandemic related), that initially led to further outperformance in tech related beneficiaries of the stay-at-home theme.
Having said that, the fund’s objective of taking less risk to get their equity like returns should be examined closer given this contradictory experience in 2020. Let’s keep this in mind when examining a few factors with their latest asset class exposures.
SPE asset class exposures
The data I refer to will be from the Annual Report and as at 31st December 2021. In the context of assessing drawdown risk, I think this is a useful snapshot as it was prior to the 2022 bear market.
SPE Annual Report 2021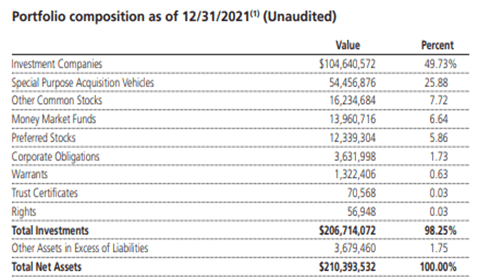
The investment companies’ exposures can help lower risk in some ways. For instance, during a market downturn, it can assist activist investors in their campaigns. Shareholders in other CEFs may be more willing to vote to wind up funds or to conduct tender offers when recent performance is weak. Another factor to lower risk is that some of the CEFs that SPE hold are in the fixed income sector. These bond CEFs can often hold up relatively better during an equity bear market.
The 2020 & 2022 bear markets however occurred when the fixed income sector started with historically very low bond yields. The 2000 & 2008 bear markets were quite different in that respect. This also could be in part some explanation why SPE did not manage to produce a lower drawdown in the 2020 covid crash.
SPE leverage
In this case the December 31st balance date of the 2021 Annual Report is not the best snapshot in time to use. SPE issues convertible preferred stock to use leverage to enhance their returns but in July 2021 this was all redeemed. It was not until January 2022 that they completed a rights offering of a new class of convertible preferred stock. This new class pays a 2.75% annual dividend and has a redemption date 5 years later in 2027.
For some context of the leverage SPE likes to use, this rights offering raised approximately $58 million. The net assets of the fund as shown earlier in the table above was about $210 million.
The initial reaction might be that the borrowings SPE use may be inconsistent with the goal of producing equity like returns with less risk.
They have timed this rights offering reasonably well though in the context of the difficult market environment since January this year. Such fixed rate funding looks reasonably attractive now as we have seen inflation and interest rates rising since then.
If you note the fund’s 26% exposure to Special Purpose Acquisition Vehicles (SPACs), this is not that dissimilar to the amount of preferred stock funding. I would therefore not necessarily conclude that leverage is increasing the overall levels of risk. The long history of expertise Bulldog Investors have in SPACs, and their underlying risk / reward characteristics should be considered.
SPE SPAC exposure
For those that do not follow SPACs closely, it might raise concerns if you have noticed articles in the last couple of years referring to the SPAC boom. This does not however preclude rational participants making good risk adjusted returns in the same area.
Bulldog Investors have identified this niche asset class as an area suitable for their level of funds under management to exploit. To quote from their 2020 Annual Report, they were “into SPACs when SPACs weren’t cool”.
More recently in the 2021 Annual Report, they reemphasized why they continue to make significant allocations to this area of the market. Below is a direct quote:
“Bulldog continues to expect the Fund to achieve a return of between 5% and 8% per annum from a diversified portfolio of SPACs with minimal or no loss on any individual SPAC investment primarily because of the redemption feature that is baked into every SPAC.”
On balance, the strategy of SPE using leverage, and then allocating a similar amount to SPACs is consistent with aiming to achieve equity like returns with lower risk.
Are the current CEF activism opportunities special?
It has been a difficult year in 2022 for CEFs not only due to the equity bear market, but Bond CEFs have also suffered. This is evident from the table below:
Refinitiv Lipper CEF Report June 2022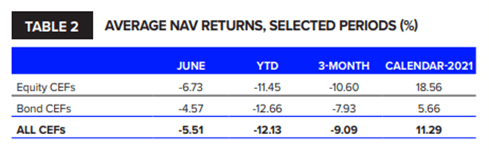
This environment might well be a good hunting ground for an activist like Bulldog Investors. Activism campaigns can resonate more with shareholders during such difficult times.
Below is a recent snapshot of SPE’s top holdings.
CEF Connect SPE Portfolio Characteristics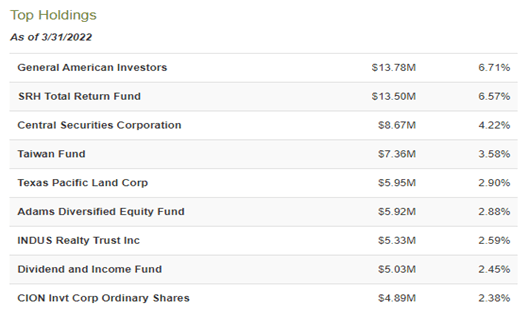
General American Investors Fund (GAM), Central Securities Corporation (CET) and Adams Diversified Equity Fund (ADX) are broad based exposure to U.S. equities. These are not so much likely to be activism targets, but lately offer attractive discounts to NAV of circa 15%.
The Taiwan Fund (TWN) is an example of a CEF holding that has seen discounts of 15-20% over the last few years, which may lead to activism. SPE owns this amongst others where it notes significant level of institutional ownership in the CEF. Should discounts further widen in these instances, shareholders may push for a liquidity event.
Risks
The returns of SPE over the last decade might be viewed as disappointing to some even allowing for the objective of taking less risk. It is a large performance gap to the S&P 500 index, even though the fund manager does acknowledge the weakness of using this comparison.
This issue might further be compounded if one invests in SPE during the rare times it trades very close to its NAV. I doubt catalysts exist to close the discount gap on a sustained basis. Despite them trying initiatives such as monthly distribution payments a few years ago, the discount looks to be permanent.
Details of the fund’s monthly distribution plan – annual rate of 8% of the December 31, 2021 NAV, can be found here. Whilst this is producing a very high yield right now, it may not be sustainable long term. The 8% rate was lifted from 7% last year.
Below illustrates the pattern of the NAV discount over the last 5 years. The current discount of circa 9% is close to average.
CEF Connect SPE Pricing Information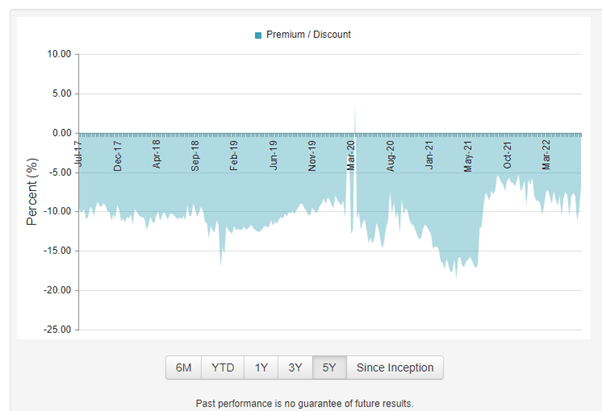
The fund regularly has announced tender offers to buy back shares at a level close to the NAV. If an investor does not monitor these events, in effect they might be subsidizing the more active shareholders who take advantage of these.
The manager appears suited to market environments where “value” outperforms “growth”. If the latter was about to outperform again, I suspect SPE’s performance will underperform.
Conclusion
The above risks I highlight are reason for me to be reluctant to view SPE as a set and forget type of long-term holding.
At this point in time however I see numerous reasons to maintain my current holding in SPE. After examining their history in the context of the last four bear markets, I accept their claim that they are producing equity like returns by taking less risk.
The comeback of “value” outperforming “growth” has only been a very recent trend. History suggests this may have a lot further to run and this environment suits Bulldog Investors.
The CEF sector has recently had a tough time thus far in 2022, which also suits this fund manager.
Even though I will continue to hold SPE I will be trying to monitor it more closely. I am not impressed by the performance enough to rule out opportunistic selling opportunities in the future. I may reconsider holding if equity markets have a good year or two from here and I see the SPE discount to NAV narrow to within 5%.
Be the first to comment