

valiantsin suprunovich
This dividend ETF article series aims at evaluating products regarding the relative past performance of their strategies and quality metrics of their current portfolios. As holdings and weights change over time, I post updated reviews when necessary.
SPDV strategy and portfolio
The AAM S&P 500 High Dividend Value ETF (NYSEARCA:SPDV) has been tracking the S&P 500 Dividend and Free Cash Flow Yield Index since 11/28/2017. It has 54 holdings, a distribution yield of 3.6% and a total expense ratio of 0.29%. Distributions are paid monthly.
As described on AAM website, to be eligible in the index, a company must be in the S&P 500 and have positive dividend yield and free cash flow yield. Eligible companies are ranked on a score based on these two yields, then the top five companies in each GICS sector are included in the index. There may be less than five companies in a sector if less than five have both yields above zero. The index is reconstituted twice a year with all constituents in equal weight.
The fund invests almost exclusively in U.S. companies (97% of asset value). It is balanced between the mid-cap (49%) and large cap (47%) segments.
By construction of the underlying index, the 11 sectors are in equal weight at 9.09% after every rebalancing, except when less than 5 companies in a sector pass the selection rules. There are only 4 eligible real estate stocks now, and the portfolio has 54 holdings on a theoretical maximum of 55. As a result of price action since the last rebalancing, 5 sectors are above the target weight now. The heaviest one is energy with 10.5%. Healthcare, consumer discretionary, financials and industrials are between 9.3% and 10%. Other sectors are underweight between 8.4% and 8.9%, except real estate, which is at 6.7%.
The top 10 holdings, listed in the next table with fundamental ratios, represent 22.48% of asset value. The largest holding weighs 2.52%, so risks related to individual stocks are low.
|
Ticker |
Name |
Weight% |
EPS growth %TTM |
P/E TTM |
P/E fwd |
Yield% |
|
Gilead Sciences, Inc. |
2.52 |
-54.90 |
33.31 |
12.42 |
3.32 |
|
|
Bath & Body Works, Inc. |
2.4 |
-32.35 |
12.02 |
14.69 |
1.73 |
|
|
Principal Financial Group, Inc. |
2.38 |
231.64 |
4.24 |
13.49 |
2.93 |
|
|
Exxon Mobil Corp. |
2.21 |
987.11 |
9.01 |
8.01 |
3.29 |
|
|
Viatris, Inc. |
2.2 |
134.66 |
18.34 |
3.57 |
3.97 |
|
|
Phillips 66 |
2.18 |
1991.59 |
4.84 |
5.44 |
3.67 |
|
|
Omnicom Group, Inc. |
2.17 |
-3.02 |
13.82 |
12.82 |
3.25 |
|
|
Hewlett Packard Enterprise Co. |
2.16 |
-74.71 |
26.33 |
8.42 |
2.81 |
|
|
Chevron Corp. |
2.13 |
240.94 |
10.05 |
9.24 |
3.22 |
|
|
Valero Energy Corp. |
2.13 |
2248.84 |
5.44 |
4.67 |
3.07 |
Historical performance
Since inception in November 2017, SPDV has underperformed its parent index S&P 500 (SPY) by 2.7 percentage points in annualized return (see next table). Moreover, SPDV shows a higher risk measured in drawdown and volatility (standard deviation of monthly returns).
|
Total Return |
Annual Return |
Drawdown |
Sharpe ratio |
Volatility |
|
|
SPDV |
41.99% |
7.12% |
-43.84% |
0.32 |
21.33% |
|
SPY |
61.42% |
9.85% |
-33.72% |
0.5 |
18.77% |
Data calculated with Portfolio123
Compared to other large cap dividend ETFs since its inception, SPDV lags SCHD and SDY in the same yield category (3-4%), and beats SPYD, which has a yield close to 5%.
SPDV vs competitors since inception (Portfolio123)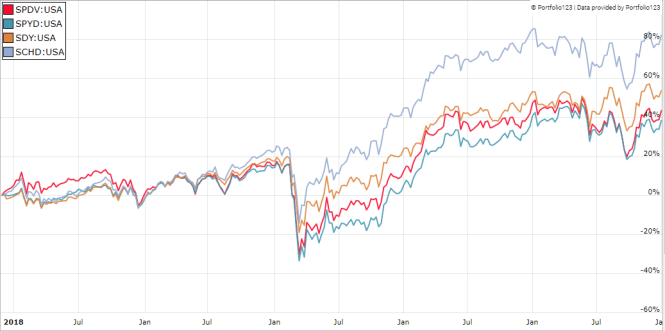
In the last 12 months, SPDV is behind its competitors by a very short margin, and they all beat the S&P 500 by over 10 percentage points
SPDV vs competitors and SPY, last 12 months (Portfolio123)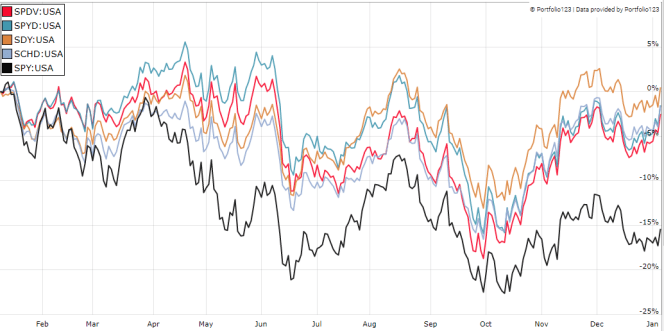
The annual sum of distributions per share has increased from $0.80 in 2018 to $1.06 in 2022 (based on payable dates). It means a quite attractive annualized dividend growth rate of 7.3%.
Comparing SPDV with a reference strategy
In previous articles, I have shown how three factors may help cut the risk in a dividend portfolio: Return on Assets, Piotroski F-score, Altman Z-score, Payout Ratio.
The next table compares SPDV since inception with a subset of the S&P 500: stocks with an above-average dividend yield, an above-average ROA, a good Altman Z-score, a good Piotroski F-score and a sustainable payout ratio. The subset is rebalanced annually to make it comparable to a passive index.
|
Total Return |
Annual Return |
Drawdown |
Sharpe ratio |
Volatility |
|
|
SPDV |
41.99% |
7.12% |
-43.84% |
0.32 |
21.33% |
|
Dividend & quality subset |
74.54% |
11.55% |
-36.62% |
0.56 |
19.06% |
Past performance is not a guarantee of future returns. Data Source: Portfolio123
SPDV underperforms this dividend quality benchmark by a wide margin. However, ETF performance is real and the subset is simulated. My core portfolio holds 14 stocks selected in this subset (more info at the end of this post).
Scanning the current portfolio
SPDV is much cheaper than the S&P 500 regarding aggregate valuation ratios, reported in the next table.
|
SPDV |
SPY |
|
|
Price / Earnings TTM |
11.62 |
20.05 |
|
Price / Book |
1.86 |
3.79 |
|
Price / Sales |
1.03 |
2.4 |
|
Price / Cash Flow |
8.11 |
14.97 |
I have scanned SPDV holdings with the quality metrics described in the previous paragraph. In my ETF reviews, risky stocks are companies with at least 2 red flags among: bad Piotroski score, negative ROA, unsustainable payout ratio, bad or dubious Altman Z-score, excluding financials and real estate where these metrics are unreliable. Regarding these criteria, 4 stocks out of 54 are risky. They weigh only 7% of asset value, which is a good point.
Based on my calculation, the aggregate Piotroski F-score and return on assets are close to those of the S&P 500. These metrics point to a portfolio quality similar to the benchmark.
|
SPDV |
SPY |
|
|
Atman Z-score |
2.31 |
3.48 |
|
Piotroski F-score |
6.05 |
5.64 |
|
ROA % TTM |
6.86 |
7.8 |
Takeaway
SPDV implements a strategy picking the 5 best-ranked stocks in each sector of the S&P 500, using a score based on dividend yield and free cash flow. It follows an equal-weight methodology, resulting in a well-diversified portfolio across holdings and sectors. The strategy looks great in theory, but past performance compared to competitors is sub-par. A 5-year history may be too short to assess SPDV, but it is not encouraging. Besides that, valuation and dividend-growth metrics are good, but quality is just average. For transparency, my equity investments are split between a passive ETF allocation (SPDV is not part of it) and an actively managed stock portfolio, whose positions and trades are disclosed in Quantitative Risk & Value.
Be the first to comment