

Nikada/iStock Unreleased via Getty Images
Price Action Thesis
We follow up with a detailed price action analysis of Apple Inc. (NASDAQ:AAPL) stock. We posited in our previous update in May that AAPL could bottom soon, given the extent of the last sell-off. Notably, it formed a validated bear trap (significant rejection of selling momentum), corroborating its May bottom.
However, another June sell-off soon took out its May lows, which invalidated its bear trap. As a result, we revisited our price action thesis and realized we had been wrong on AAPL stock. We revised our rating to Buy too early in 2022, as AAPL formed a double top bull trap (significant rejection of buying momentum) at the end of March.
Therefore, instead of turning cautious due to its double top, we kept our Buy rating and executed poorly. Consequently, we are reminded again by the market never to ignore the presence of double tops, as they often portend early warning signals to significant trend reversals.
Notwithstanding, AAPL is still holding its June lows. However, we are not convinced that the digestion from its double top has been completed. Also, our reverse cash flow model indicates that AAPL could underperform the market even at the current levels.
Accordingly, we believe revising our rating from Buy to Hold is appropriate.
AAPL – Trend Has Turned Decisively Bearish
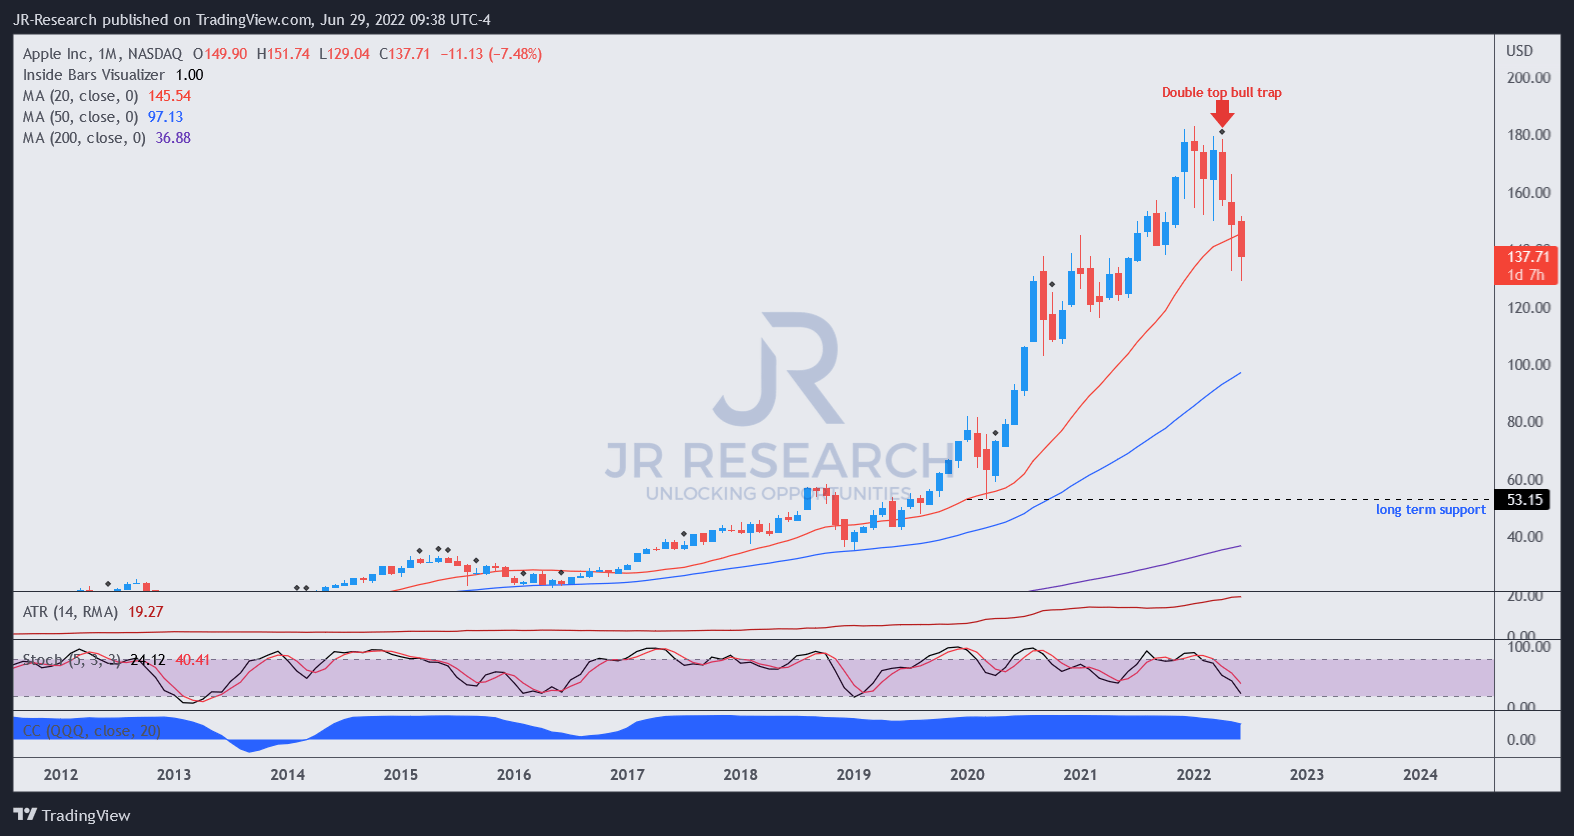
AAPL price chart (monthly) (TradingView)
Despite the steep sell-off from its March double top, AAPL is still in a long-term uptrend. Therefore, we believe some long-term AAPL investors remain unperturbed.
However, we urge caution as AAPL’s surge from its COVID bottom was too fast, helping the stock outperform the market significantly over the past two years. However, such a massive surge is unsustainable unless the company can continue delivering on massive earnings or free cash flow growth from highly challenging comps.
Furthermore, AAPL’s price action looks extended. As a result, we believe that the digestion from the double top has not been completed, with steeper sell-offs moving forward.
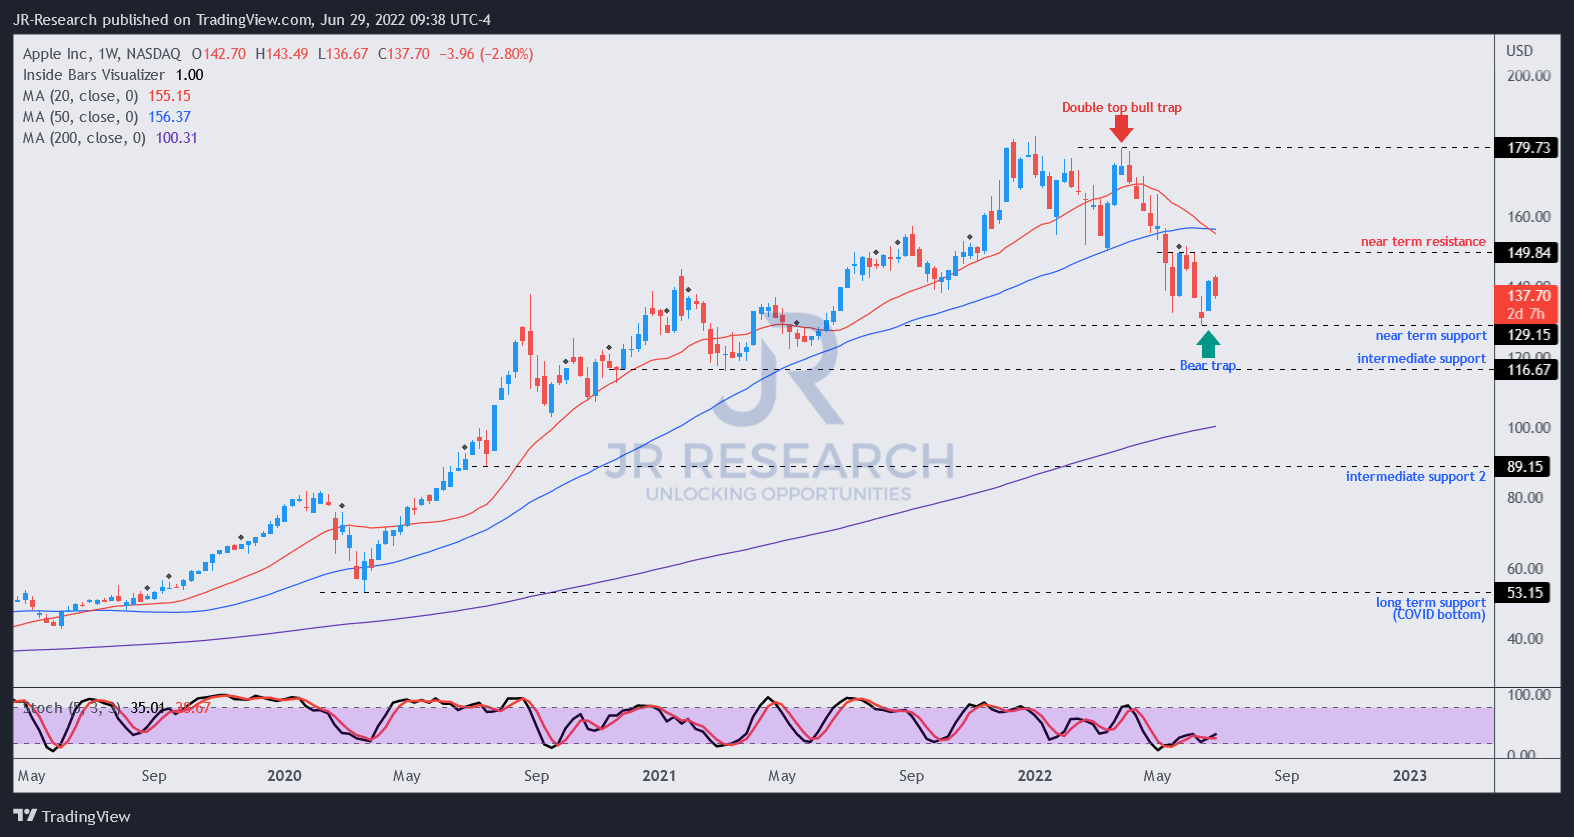
AAPL price chart (weekly) (TradingView)
Moving into its weekly chart, we can glean the double top at the end of March. Even though AAPL staged a validated bear trap in May as expected, it has already been invalidated by June’s sell-off. Investors are reminded to accord higher precedence to double top price action. Initial bear traps following a double top are usually unreliable.
Notwithstanding, AAPL is still holding its June lows, but its momentum has already turned decisively bearish. Therefore, AAPL’s bias continues to the downside if it cannot retake its near-term resistance convincingly.
Therefore, we will be watching its price action closely. Investors should be prepared for a steep sell-off if it fails its near-term resistance re-test and forms a bull trap.
Apple Could Significantly Underperform The Market
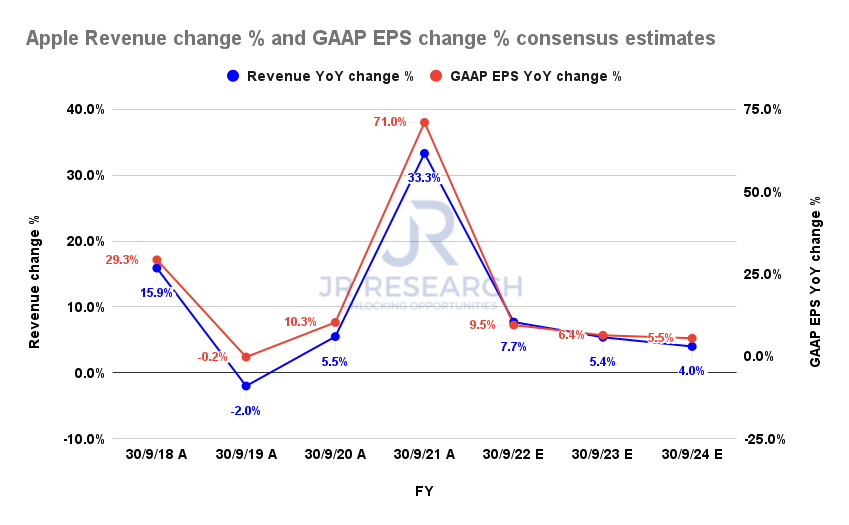
Apple revenue change % and GAAP EPS change % consensus estimates (S&P Cap IQ)
Apple still deserves plaudits for its impressive EPS growth, as seen above. Despite tepid revenue growth metrics, it has consistently posted more robust EPS growth, supported by its stock repurchase programs.
Notwithstanding, Apple’s revenue growth is expected to moderate significantly over the next few years. Moreover, its EPS growth is projected to slow considerably as it laps increasingly challenging comps. Hence, unless Apple can deliver something massive that can move the needle (Apple car?), it’s challenging to expect Apple to outperform the market moving forward.
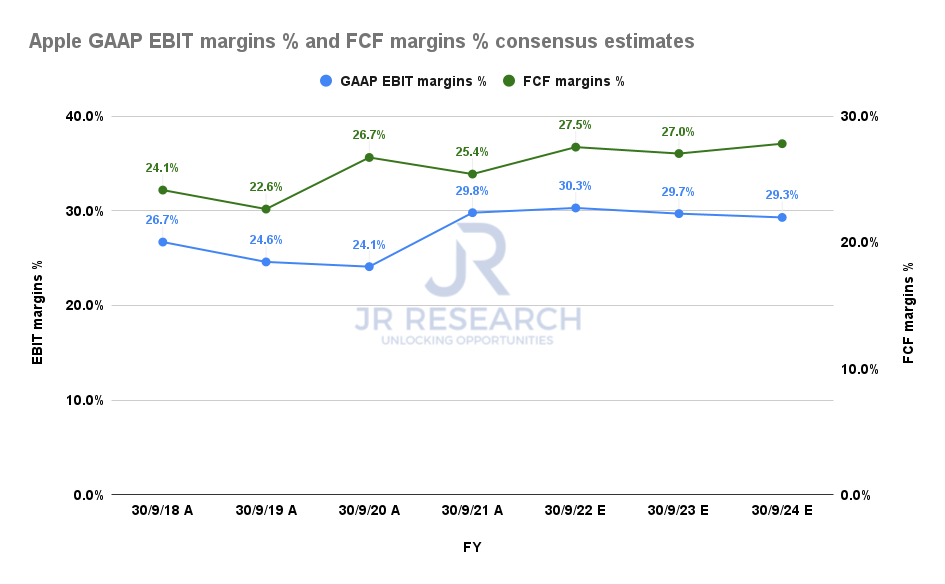
Apple EBIT margins % and FCF margins % consensus estimates (S&P Cap IQ)
Notwithstanding, Apple is a massive cash flow machine, converting most of its EBIT profitability into free cash flow (FCF), as seen above. As a result, it’s expected to continue underpinning its robust FCF margins despite the slowdown in revenue growth.
| Stock | AAPL |
| Assumed entry level | $129 |
| Hurdle rate (CAGR) | 22.98% |
| Projection through | CQ4’26 |
| Required FCF yield in CQ4’26 | 7.14% |
| Assumed TTM FCF margin in CQ4’26 | 27% |
| Implied TTM revenue by CQ4’26 | $1.4T |
AAPL reverse cash flow valuation model. Data source: S&P Cap IQ, author
AAPL has outperformed the Invesco QQQ ETF (QQQ) over the past five to ten years. It delivered a 5Y total return CAGR of 31.84% (Vs. QQQ’s 15.99%). It also posted a 10Y total return CAGR of 22.98% (Vs. QQQ’s 17.52%).
Therefore, to make sense of whether the market expects AAPL to outperform moving ahead, we used an assumed entry price of $129 (near-term support). We also applied a hurdle rate of 22.98% (equivalent to its 10Y average performance) and used the 10Y mean of its FCF yield of 7.14%.
As a result, we require Apple to post revenue of $1.4T by CQ4’26, which is “impossible,” based on the current consensus estimates. Hence, we believe the market is likely pricing in further weakness in AAPL as it could significantly underperform the market.
Investors should note that AAPL traded at FCF yields as high as 11.8% over the past ten years. So, its current FCF yield of 4.64% is nowhere near those levels.
Is AAPL Stock A Buy, Sell, Or Hold?
We revise our rating on AAPL from Buy to Hold. While AAPL could maintain its near-term support and hold its June lows, we are convinced it could underperform the market.
Therefore, it’s better to reallocate capital to other well-beaten down tech stocks that could outperform, given the prolonged bear market in growth stocks.
Also, our price action analysis indicates that AAPL has moved decisively into a bearish bias. Therefore, the market could use its current consolidation to distribute the stock further before setting up another bull trap to force a steeper sell-off.
Be the first to comment