grinvalds/iStock via Getty Images
Thesis
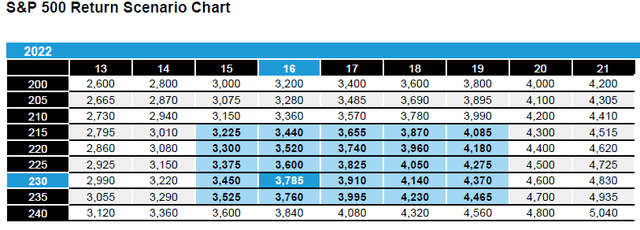
The bear market in the S&P 500 (NYSEARCA:SPY) continues unabated, even though we are in the midst of another bear market rally. Weaker than expected US ISM Manufacturing (50.9 vs. 52.0 expected) and the U-turn in UK fiscal policy have triggered the latest rally, in a classic example of bad news is good news. Ultimately, the market will go towards fair value, as defined by its P/E ratio. Where the bottom lies in the index is as much dependent on the Earnings component as it is on the P/E de-rating:
S&P 500 P/E Ratio (Alliance Bernstein)
We are of the opinion that we are moving towards the long-term average of 15x P/E ratio, with a -5% to -10% revision down in earnings. That should move the Index to the low 3000s levels.
If an investor is in agreement that we are heading lower, then there are a couple of alternatives available:
1) Liquidate all holdings and stay only in cash (it is yielding over 3% now, hence the new moniker TARA)
2) Hedge the portfolio via inverse ETFs, a topic which we explored here
3) Buy puts
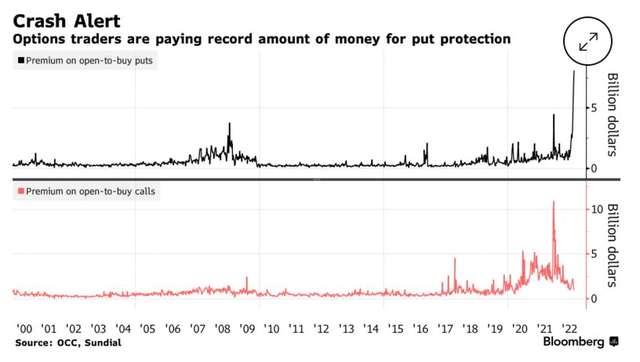
Investors are well aware of the current market dynamics with put buying at historic record levels:
The upper part of the graph shows the amount spent of buying puts – please notice the historic spike up in the graph, while the lower part of the graph is premium spent on calls. Please note that during 2021 when TINA was in vogue the line was sky-high, while currently it has virtually collapsed. This translates into investors basically believing there is little upside in the market now, hence “why spend cash on calls?” type of mind-sets.
Current Options Pricing
Let us have a look at how the pricing looks like for certain maturities:
Table 1 – Maturity Pay-off Profiles (Author)
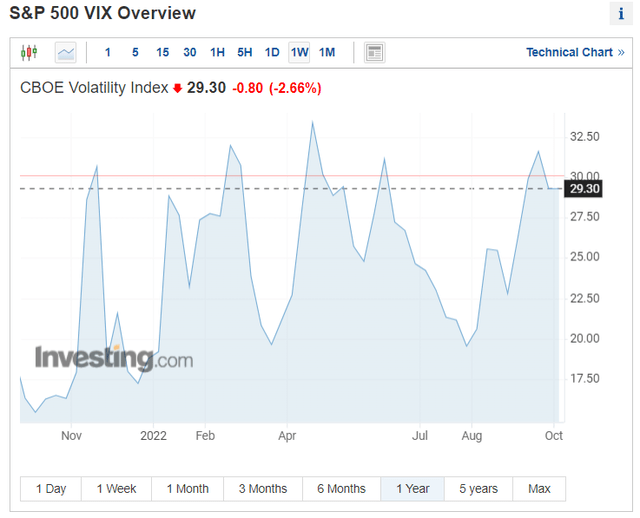
The most important aspect for options pricing is volatility, which is now elevated:
Elevated volatility results in expensive options when an investor buys them. Rates have become a more relevant component as well, but for shorter dated options they represent the second most important factor.
If we have a look at Table 1, we have highlighted in a simple fashion the maturity pay-off profiles of current S&P 500 put options. This presents the profit and loss upon maturity with an implied S&P 500 target of 3,300. By subtracting the cost of the option, we can see the break-even price (basically where the S&P 500 needs to be in order for an investor not to lose money). The most interesting aspect is the “downside protection” column, which gives us a sense of how much of the down move is hedged via put purchases.
We can see that given high implied volatility, the December puts only offer a 49% downside protection (i.e. if you bought the December puts now and the S&P 500 went to 3,300 on expiry you would only make 49% on your option) while the front ended one in October gives an investor a 74% coverage.
Put Mark-to-Market Volatility
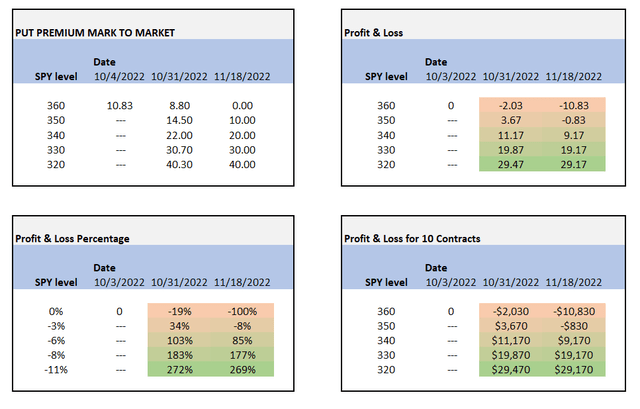
Let us also have a look at the November 18 360 strike puts and get a sense of how the mark-to-market would look like (the analysis is run utilizing a binomial options pricing methodology):
Table 2 – MtM Volatility (Author)
In the tables above we took the current pricing on the Nov 18 360 strike SPY put and ran several price and maturity simulations to get a sense of how much protection the put offers. We can see that the breakeven upon maturity needs a market loss of at least -3% from current levels, and the pay-off profile generally accelerates after a -6% move.
The current pricing needs a significant front-ended drop for the options to be profitable. For example, if the S&P 500 moves to 3,300 by the end of October, then the put option offers a 183% pay-off (i.e. the premium moves from 10.8 to 30.7, which results in a gain of 19.87 per contract). Conversely, if the price stays at 360 the profit and loss is -19% due to the option decay.
Let us marry up Table 1 with Table 2 to better understand the downside protection offered:
Table 3 (Author)
If we have a portfolio entirely invested in the S&P 500 and a $360k notional, then a move to 3,300 would generate a loss around -30k which would be offset by a gain of 19k from the 10 contracts bought above. Hence, the portfolio loss would not be entirely covered, only 64% of the downside move. The reason for this coverage is the expensive options pricing.
Conclusion
The S&P 500 is on a down-trend, with many analysts expecting ultimate pricing in the low 3,000s. The index is experiencing both a P/E de-rating as well as a re-set on the earnings forecast. Current market pricing makes puts expensive, with 1- and 3-months puts currently priced to offer only 74% and 49% downside protection respectively. A retail investor buying puts at current levels needs an exponential gap-down (above -6%) in the next 40 days in order to be significantly profitable on the options, with the caveat that the options will only partially protect the investor’s portfolios. Inverse ETFs are also an alternative in the current environment, but the pay-off profile is significantly different, with the losses uncapped if the market rallies.


Be the first to comment