

Since the 2008/2009 financial crisis the S&P 500 (SP500) has been on a constant march higher, with only one small down year in 2018. In 2019, the market roared back, rising over 30% and shortly into 2020 setting an all-time record high. There were some good and some suspect reasons for this amazing, 10+ year bull market run. Near the later stages, less solid reasons seemed to dominate. Four main factors have been driving the S&P 500, the focus of this article. Other market indexes have risen as well. Three of those factors have ended or may be coming to an end. I am not forecasting an imminent drop like we saw in 2009. However, there is a possibility the market’s recent “recovery” might be a classical bear market bull rebound before it “tips over” and a drop of 700-800 points over the spring and early summer.
2010-2012 Market Recovery Healthy and Profitable
The Financial Crisis of 2008/2009 was a painful but rationale event. Credit was insanely easy to get and moral hazard risk across much of the economy had been completely eliminated, or so many thought. I live in San Diego, California, and action in the housing and commercial real estate markets was unbelievable. There were almost no “for sale” signs on houses due to rapid purchases, mortgage ads on the radio and TV were offering crazy loan-to-value terms and initial rates, and friends with little to no real estate experience were adding rental properties on a near quarterly basis. Then the music stopped, the markets froze, and we were likely days from an economic collapse. Asset values fell across many classes and the S&P 500 lost over 50% of its value.
Over the next few years, as the financial and mortgage sectors recovered and investors realized many companies were still solidly earning profits, the market recovered and began a mostly earnings based upward trajectory. Yes, zero-interest rates and favorable government policies like accelerated depreciation amplified this. This portion of the bull market was healthy and a solid recovery and market valuations were good but not euphoric.
2013-2019 A Historic Bull Market On Shakier and Shakier Legs
Through “the Teens,” this bull market continued almost without pause. It appears there were four main driving forces to this bull market that set records in both percentage rise and duration. They were:
1) Expanding price to earnings multiples
2) Zero-interest rates for an extended period of time/There Is No Alternative (TINA) views
3) Share Buybacks, partially funded by increased leverage related to #2
4) Massive inflows from ETFs and index funds, especially in retirement accounts and “Fear of Missing Out” (FOMO) investors
None of these taken by themselves are disastrous, and some actions were rational. As an example, I invest in and follow hospitality REITs. Many of these REITs have been paying mid-to-high single-digit yields as asset prices and re-investment cap rates have risen. After CAPEX and dividends, these REITs had cash and also room on their credit faculties and access to long-term debt at rates equal to or lower than their dividend payouts. While increasing their debt to equity, companies in these situations were able to roll over and expand their debt and retire shares that were yielding more than their cost of capital.
Friday morning Barron’s published an article that stated about 20% of the past few years, S&P 500’s earnings growth years could be attributed to share buybacks, not productivity gains or margin improvements. Factored with low earnings growth since 2014, this evidenced a market rising on smaller earnings growth and multiple expansion as “Mr. Market” paid more and more for slower growing earnings.
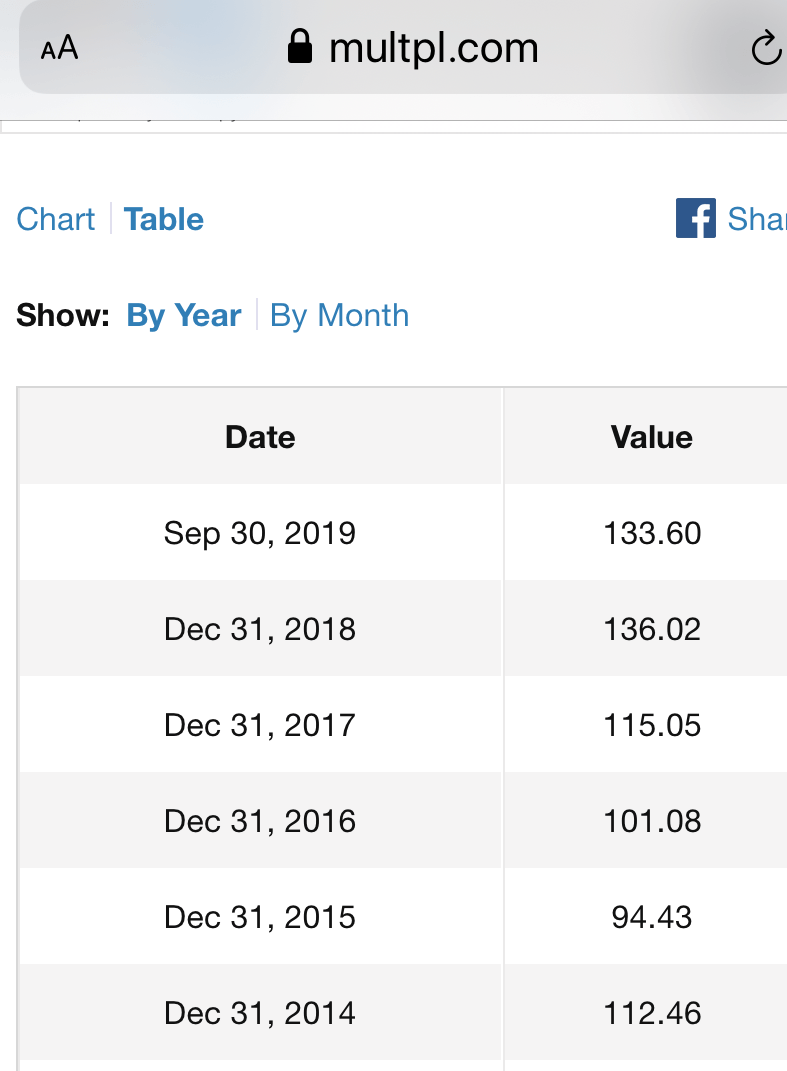
Figure 1 S&P 500 Annual Earnings 2014 to September 2019 (S&P 500 P/E Ratio)
The increase in reported earnings (trailing earnings) was only 18% total from the end of 2014 until September 2019 (The last date I could use in the table). This gives proof to multiple expansion on reduced share count driving the market higher, not underlying fundamental improvements. To the February market high, the S&P 500 returned 59.6% while earnings rose only about 20%. Of note, during the massive run-up in 2019, S&P 500 companies actually earned less than in 2018. Multiple expansion due to optimism and near-constant inflows into S&P 500 index funds and ETFs, especially in 401(k) and other retirement accounts, drove the market upward.
Post-Pandemic Valuation Estimates Are Cautionary At Best
The coronavirus Pandemic is a Black Swan event society and the market haven’t had in over a decade. Medically, previous disease breakouts like Ebola, SARS, and H1N1 never spread globally like novel coronavirus-19 has – nothing since the Spanish Flu 100 years ago has. Economically, we’ve never seen massive business closures for non-financial reasons across nearly every economic segment. Even hospitals and medical centers have suspended or severely limited non-COVID-19 related activities, laying off medical professionals and support personnel during a pandemic. While the physical and psychological effects are real and pressing, I am not qualified to address them, nor is Seeking Alpha the forum for that discussion. Financially, the total impact will be market-altering. For purposes of this article, the focus is how 3 of the 4 underpinnings of the historic bull market will be altered if not ended.
First, share buybacks will come under both political and public scrutiny. The economics behind them will also be altered significantly. The Barron’s article and other news over the past few days have increasingly drawn attention to companies seeking bail-outs while having repurchased shares recently. While company boards and management teams have a fiduciary duty to make capital decisions in the interest of shareholders, the “optics” of these actions, especially in hindsight, also must be taken into account. With much more social activism in the investing world, buybacks will be curtailed going forward. Additionally, cash flow and liquidity concerns are now at the forefront of those fiduciary duties. With America and much of the global economy “closed for business” for much of March and now April, cash and credit facilities are needed to meet liquidity concerns and ongoing solvency, not reduce share count.
Second, Americans as a whole have, by necessity, had to become investors as retirement planning has moved to employee contribution and savings plans instead of pensions. Most Americans are woefully under-educated for this responsibility, most 401(k) and financial industry offerings are too diverse, complicated and intimidating. (SA readers excepted) Many investors turn to passive investing via index funds and ETFs, most prominently the S&P 500 funds/ETFs. This phenomenon is not my focus, but John Bogle won, at least for the average working individual. Unfortunately, these massive inflows into passive funds created a “buy high, buy higher” action, especially in a market-value weighted index like the S&P 500. However, these inflows will pause if not decrease due to job furloughs, layoffs and reduced matches. As evidenced by the CARES Act, the more realistic outcome is many will defer contributions or even draw funds out of retirement accounts to meet pressing expenses. While $1,200 “helicopter money” might keep some people fed, many white collar and well paid technical employees are facing much worse reductions in income and financial needs. Unemployment claims are staggering. Unemployment is not meant to replace a middle to upper-middle income salary. If there is truly a 10-20% drop in long-term employment and/or salaries, retirement accounts will be raided and contributions will definitely slow or stop.
Most significantly, the earnings growth and multiple expansion of the late teens will take a step backwards. How far back is the key question, and I don’t have a crystal ball. (8 Navy moves over my career, stuff gets broken!) During that Navy career I learned the military joint planning system, and one thing we did was look at likely, most-favorable and least-favorable outcomes. We incorporated each of these into our planning while also trying to predict the chance of each one happening, including Black Swan or “Acts of God” events. (remember what happened to the Spanish Armada?) I will apply a little of this methodology here to forecast some possible valuations of the S&P 500 over the next year.
Recently, Eric Basmajian published a good article on the S&P 500 on developing a margin of safety, which I recommend as a complimentary piece. He included this chart, which he graciously allowed me to use as I couldn’t have put together one nearly as clear.
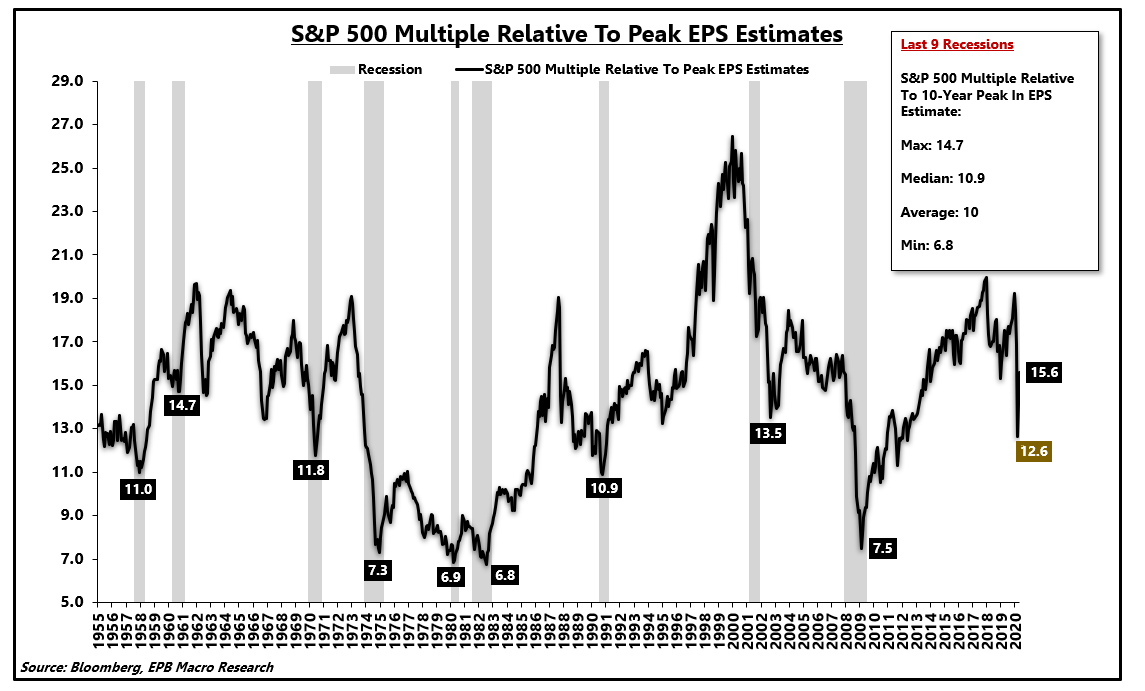 Figure 2: S&P 500 P/E Multiple to Peak EPS (Eric Basmajian, Seeking Alpha April 13, 2020)
We are in or entering a recession, the depths and duration of which is hard to forecast. This pandemic is unlike anything in our lifetimes. Past economic downturns were economically or financially driven – this is more societal. “Reopening America” is being discussed more and more, but how will people react? What day to day changes might be or must be put into place? Will “cubicle farms” and densely attended events change forever? Will the shift to e-commerce, meal/grocery delivery and other new disruptive trends accelerate, changing or eliminating traditionally profitable companies and industries? Can the federal and state governments and the Fed continue to flood both the real and market economies with capital while tax revenue plummets? What will change regarding globalization, just-in-time manufacturing, and centralized and limited mass production requiring long maritime supply chains? With all these unknowns, it’s hard to pick one multiple and say “That’s it” or forecast how far earnings will drop before growing again. So I will use the likely, most and least favorable model.
We are in the midst of an earnings season that the pandemic only partially affected. Using a mid-point earnings estimate of 140 for the S&P 500, and the market currently trading at 2800, the market P/E is 20. Unless there is a massive drop next week, this will serve as our baseline and short term/current likely outcome as the market has held up as more and more companies report earnings but reduce outlook or don’t provide guidance at all.
However, a look at Figure 2 shows this multiple of 20 is historically still very high. It is not in line with the past 9 recessions. As we go into a quarter that will be fully affected by business closures, this could well be the “most favorable” outcome in my mind. It’s hard to see earnings growing next quarter, and despite huge amounts of capital being injected into the market, corporations will likely be in survival mode, not expanding, over the next two quarters or more.
If 2800 and a multiple of 20 is my most favorable forecast, what is my least favorable? Looking at Figure 2, the low multiples during a recession range from single digits in the 70s and 2009 to 11-13.5 in other recessions. Some other analysts are forecasting these might be too low due to the zero-interest rates, QE and “TINA” mentioned above. Factoring this in and seeing some of their estimates on a recession multiple, I’ll use a generous 15 as the multiple, and stick with flat earnings going forward initially. 15 x 140 is 2100 for an S&P 500 valuation, a 25% drop from today’s market, and a 38% drop from the record close near 3400 in February. What if both the multiple and the earnings forecast are too high? Dropping the multiple to 12.5 (still above the median of the past 9 recessions), and earnings dropping to 120 for the S&P 500, we would have a valuation of 1500 (12.5 x 120). The “least favorable” could happen due to the confluence of business closures/interruptions, record unemployment, and reduced business and consumer spending. The least favorable estimate shows the real potential for a 25% to 55% drop in the S&P 500 from the February high, and significant “worst case” downside even from today’s valuation.
My “most likely” estimate is the market re-prices as the full impact to the U.S. and global economy (and psyche) becomes more and more apparent. We have likely reached a near-term peak, and the S&P 500 will drift lower instead of regaining the record high. Corporations will retrench, freeze or lower dividends and stop buybacks. Inflows into index funds and ETFs will slow or turn negative, also reducing the multiple for the index. The multiple would drift downward but not collapse, and for sake of illustration, I’ll reduce earnings to some of the low estimates for next quarter and then have them recover to the likely 140 in earnings for this reporting period. This would mean a mild but ongoing recession but not collapse.
July 2020 estimate Earnings: 125 Multiple: 16 S&P Value: 2,000
October 2020 Est Earnings: 140 Multiple: 16 S&P Value: 2,240
This estimate shows a large drop is likely even if earnings hold up and this is a reasonably short recession. While a significant drop from the very frothy high of February, if we only see 2240 in the S&P 500 and a return to earnings growth, this would be a favorable financial outcome. It doesn’t take into account a sustained recession and return to P/E multiples of 6-10. I’m also assuming earnings don’t fall off a cliff. Changing either the earnings or the multiple even a few points could see the S&P 500 fall below 2000. Investor sentiment if we have a second wave of infections and spike in fatalities could drop, conversely further progress on an effective treatment would prop the multiple up.
Frankly, I think the current pricing in the market is pollyanna-ish, mainly due to the Fed and governments flooding both the market and the real economy with trillions of dollars. Also, there is a lot of wishful thinking that the U.S. and world economies will quickly get back to normal when “reopened.” Using a most favorable (we’re at the high), a least favorable (we’re likely to see a 25-50% drop) and likely estimate (we’re 12.5-20% or so overvalued) estimation, I urge caution with passive S&P 500 index investments. If market sentiment “rolls over,” historical recession multiples and lower S&P 500 earnings could lead to our third large drop in the S&P 500 in the last 20 years.
Best wishes for investing success!
Find this article and my style infuriating, informative, or entertaining? Please “Like” the article, “Follow” me as an author, and comment below. Comments help all of us as the shared knowledge and outlooks broaden my viewpoints of every article I’ve written. All I ask is you keep it civil and refrain from overtly partisan political comments -discussions of our capitalist/socialist system and what’s going on now excepted as those economic changes are also likely to affect markets going forward. And if I’ve really blown it, learning from a different and better viewpoint has helped me grow.
Disclosure: I am/we are long SP500. I wrote this article myself, and it expresses my own opinions. I am not receiving compensation for it (other than from Seeking Alpha). I have no business relationship with any company whose stock is mentioned in this article.
Additional disclosure: I am long an S&P 500 index fund in my employer’s 401K with small (in relation to my total investments across many funds and stocks) ongoing monthly contributions. These purchases are about $100 per month, with the bulk of my contribution and match going to other diversified fund choices.
Information presented is for educational purposes only and does not intend to make an offer or solicitation for the sale or purchase of any specific securities, investments, or investment strategies. Investments involve risk and unless otherwise stated, are not guaranteed. Be sure to first consult with a qualified financial advisor or tax professional about your specific financial situation before implementing any strategy discussed herein.
Be the first to comment