

US PMI KEY POINTS:
- Flash U.S. Composite rises to 50.2 from 46.8, topping expectations calling for a more modest rebound to 47.5
- Services PMI also moves out of contraction territory, climbing to 50.5 from 46.8 previously
- Manufacturing activity remains weak, but inches higher to 47.8 from 46.9 in January
Recommended by Diego Colman
Get Your Free Equities Forecast
Most Read: Oil Prices Seek Direction as Rising Rates & China’s Slow Demand Recovery Create Challenges
U.S. business activity recovered moderately and moved out of contraction territory in February, a sign that the economic outlook is stabilizing despite the rapid increase in interest rates aimed at cooling inflation.
According to a preliminary report from S&P Global, its U.S. Flash Composite PMI recovered for the second consecutive month, rising to 50.2 from 46.8 previously, topping expectations calling for an advance to 47.5 and reaching its best level since June 2022 amid improving demand conditions. For context, any figure above 50 indicates growth, while readings below that threshold denote a downturn in output
Looking at the survey’s components, manufacturing PMI remained weak, but was able to rise modestly to 47.8 from 46.9 previously, pointing to some moderation in the recent slump in the sector. Meanwhile, the services PMI rose to 50.5 from 46.8, its highest level in 8 months, reinforcing the view that the economy can avoid a recession.
US PMI DATA AT A GLANCE
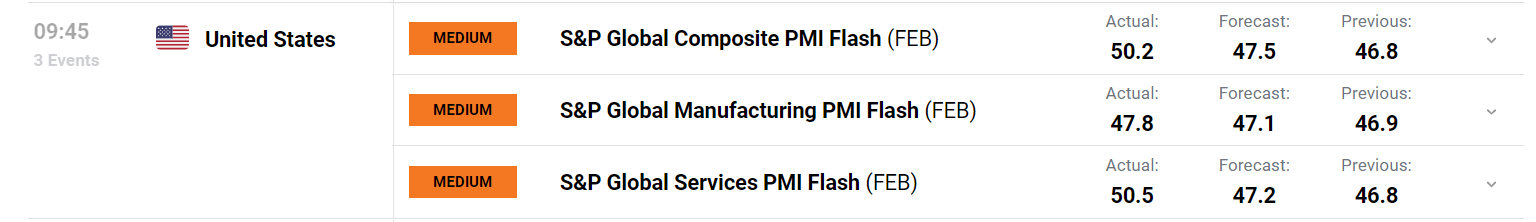
Source: DailyFX Economic Calendar
Immediately after the PMI data was released, US stocks accelerated their losses as U.S. Treasury yields spiked across the curve, with the 2-year note jumping to 4.7%. While the resilience of the U.S. economy has reduced the risk of a hard landing, at the same time it has increased the likelihood that the Fed will have to further tighten monetary policy to control inflationary pressures and restore price stability. This could be a significant drag on equities over the medium term.
Recommended by Diego Colman
Get Your Free Top Trading Opportunities Forecast
S&P 500 & TREASURY YIELDS CHART
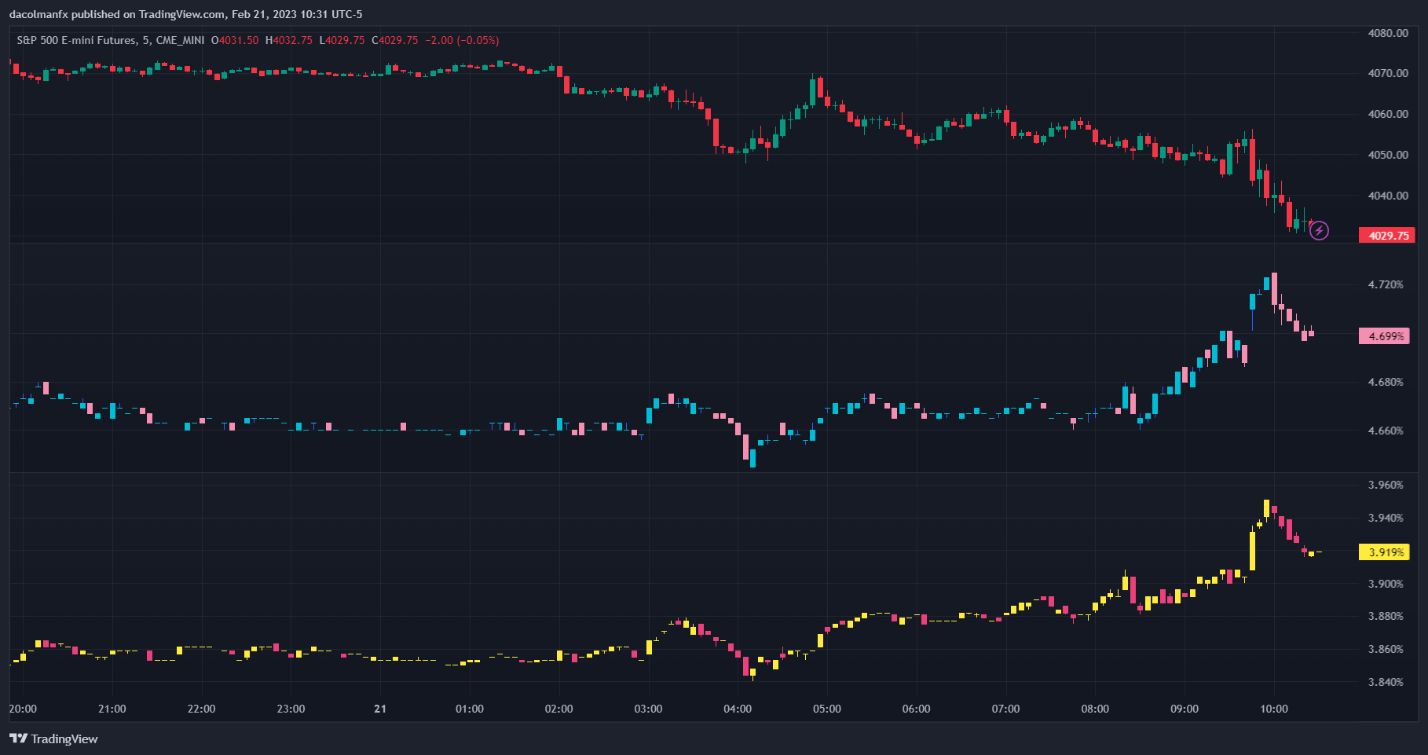
Source: TradingView
Be the first to comment