

- The S&P 500 begins the week with no clear direction and ends Monday’s session with a small gain
- The Russell 2000, however, soars higher and comes within striking distance of its record high
- Earnings season will remain relevant in the near term, but the FOMC monetary policy decision and the NFP report will likely be the most important catalysts for price action this week
Most read: Gold Teeters Ahead of FOMC, NFP- November Levels
The S&P 500 began the week with no clear direction, moving around the flat line for most of the trading session, but heading into the close managed to eke out a small 0.18% gain to finish at 4,613, a fresh record. Meanwhile, the Russell 2000 exploded higher amid accelerating rotation into cyclical plays, jumping 2.65% to end at 2,358, a hair’sbreadth away of its all-time high of 2,360 set in March.
While there’s still much uncertainty about the future due to elevated inflationary pressures and persistent supply chain disruptions, the strong performance by small and mid-caps may be a sign that investors are becoming more confident in the recovery as corporate earnings remain strong, COVID-19 anxiety recedes, and Democrats rule out a corporate tax hike in their reconciliation bill. In this context, it is important to note that the U.S. economy is currently seen growing at an annualized rate of 5% in the fourth quarter, although some forecasts go as high as predicting an 8.2% expansion.
In the near–term, the attention will fixate on earnings season to gauge the strength of corporate America in the face of several economic headwinds, through there are two key events this week that may be more relevant for the stock market: the Federal Reserve monetary policy decision and the October non-farm payroll data.
Focusing on the U.S. central bank, the FOMC is expected to formally announce on Wednesday a plan to begin tapering its bond asset purchases program, as the conditions for withdrawing stimulus have been mostly met. The move has been thoroughly choregraphed, so it is unlikely to spark much volatility in and of itself; however, traders should focus on the overall tone, as the institution could embrace a more hawkish posture to convince the market that it is not falling behind the curve. A hawkish stance from the Fed could trigger a sell-off in risk assets, but any pullback should be transitory, as traders have already discounted two rate hikes for next year,even without the Fed signaling such action.
In terms of the employment data, the October NFP report, due out on Friday, will be critical for investors as it will provide insight into the health of the labor market after last month’s disappointing numbers. Analysts expect to see 450,000 new jobs, but we will likely need a figure above half a million to boost confidence and protect the bullish sentiment that has prevailed in recent weeks.
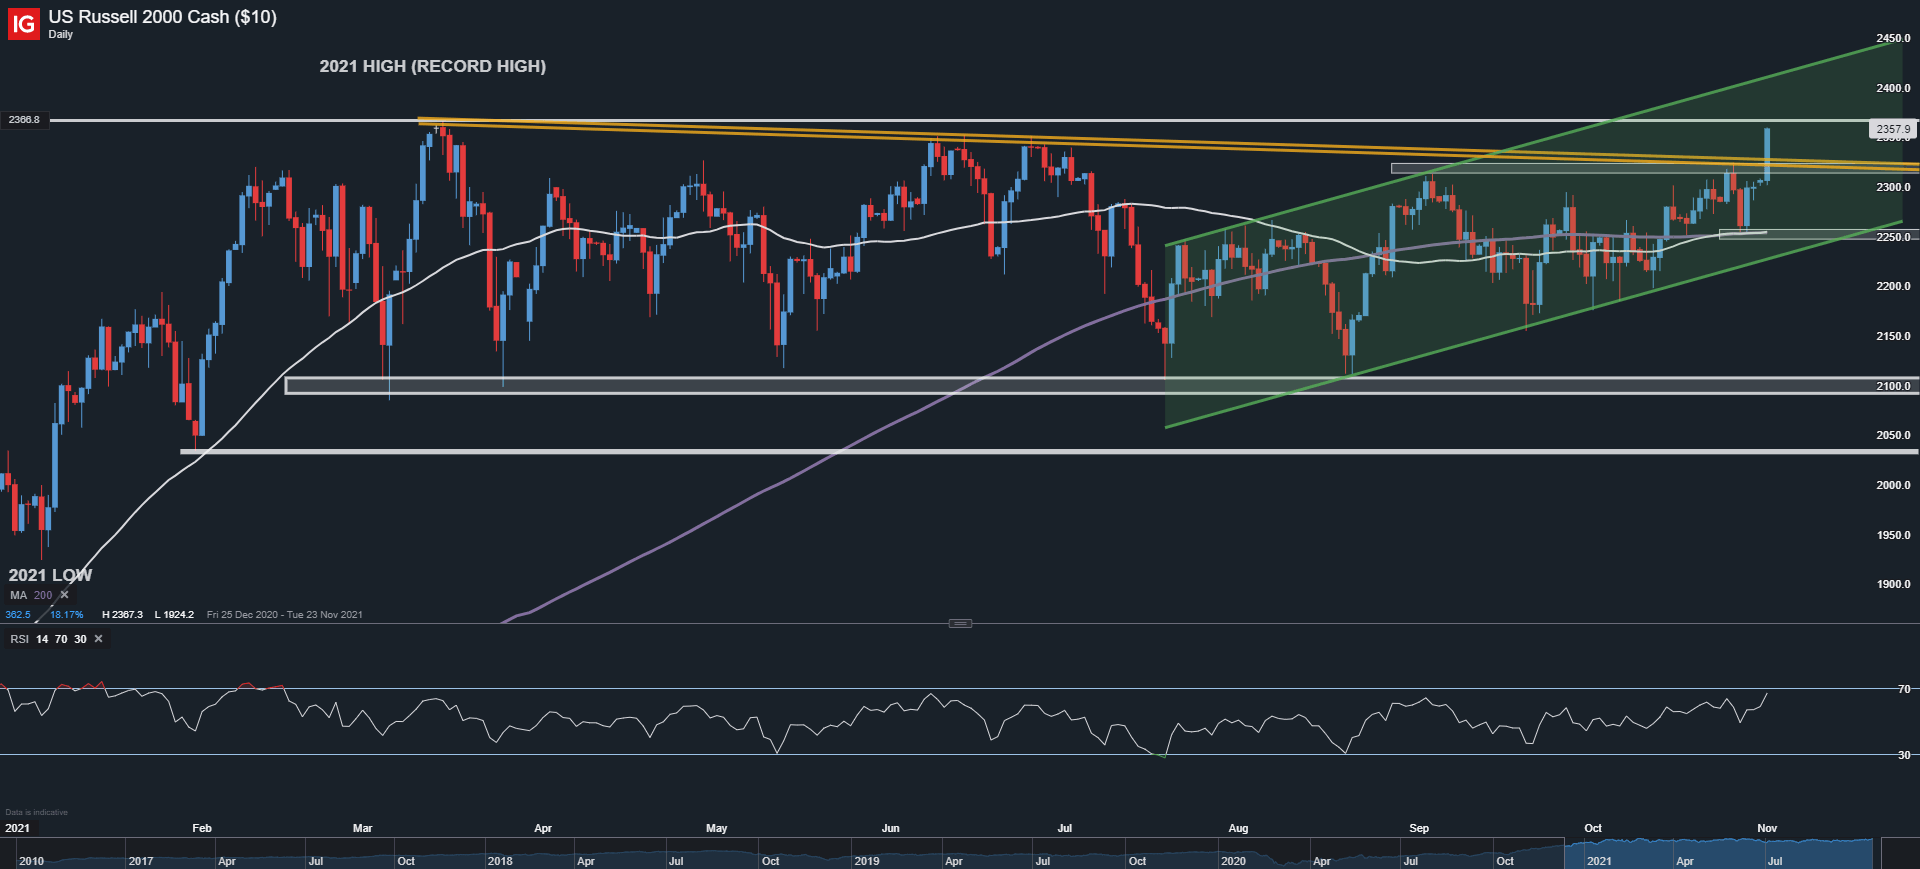
RUSSELL 2000 TECHNICAL ANALYSIS
The Russell 2000 has staged a strong rally since its September low, rising more than 9% amid strengthening risk-appetite. Buying momentum appears to have accelerated at the start of this week, after the small-cap index cleared key resistance in the 2,320 area. Following this bullish breakout, the Russell 2000 may be on its way to retest its record high in the 2,360 area. Traders should carefully watch how price reacts around this technical barrier as a move above it may pave the way for a rally towards channel resistance in the 2,410 region.
On the flip side, if bears retake control of the market and price pivots lower, the first support to consider appears at 2,320. If sellers manage to drive the index below this floor, we could see a pullback towards the 200-moving average and channel support near 2,250.
RUSSELL 2000 TECHNICAL CHART
EDUCATION TOOLS FOR TRADERS
- Are you just getting started? Download the beginners’ guide for FX traders
- Would you like to know more about your trading personality? Take the DailyFX quiz and find out
- IG’s client positioning data provides valuable information on market sentiment. Get your free guide on how to use this powerful trading indicator here.
—Written by Diego Colman, Contributor
Be the first to comment