

S&P 500, Russell 2000 Price Analysis & News
- Questions Raised After Risk Rally Peters Out
- S&P 500 | Approaching Inflection Point
- Russell 2000 | Risks Remain Skewed to the Downside
How to Invest During a Recession: Investments & Strategy
S&P 500 | Approaching Inflection Point
Yesterday’s risk rally saw a notable turnaround late in the US session, consequently raising concerns over the recent upside. As noted last week, we feel that equities have been in a bear market rally and thus we do not rule out a revisit to the yearly lows. Uncertainty remains rife as investors continue to gauge the impact of coronavirus on the economy. Tomorrow will provide another indication with the latest jobless claims data due to be released. With gains in cyclical stocks stalling relative to defensives the S&P 500 faces hurdles in the near term.

Recommended by Justin McQueen
Improve your trading with IG Client Sentiment Data
S&P 500 Levels to watch
On the topside, near-term resistance is situated at 2728, which marks the June 2019 lows. While the S&P 500 had broken above this level yesterday, failure to close above signals possible exhaustion in the recent upside, raising the risk of renewed selling in the index. Alongside this, key resistance is situated at the 2790-2800, where the 50% Fib retracement of the Feb-Mar sell-off resides. We see this level as a key inflection point for the S&P 500. In terms of support, the 200WMA sits at 2648 where a closing break below puts 2500 back into focus.
S&P 500 Price Chart: Weekly Time Frame
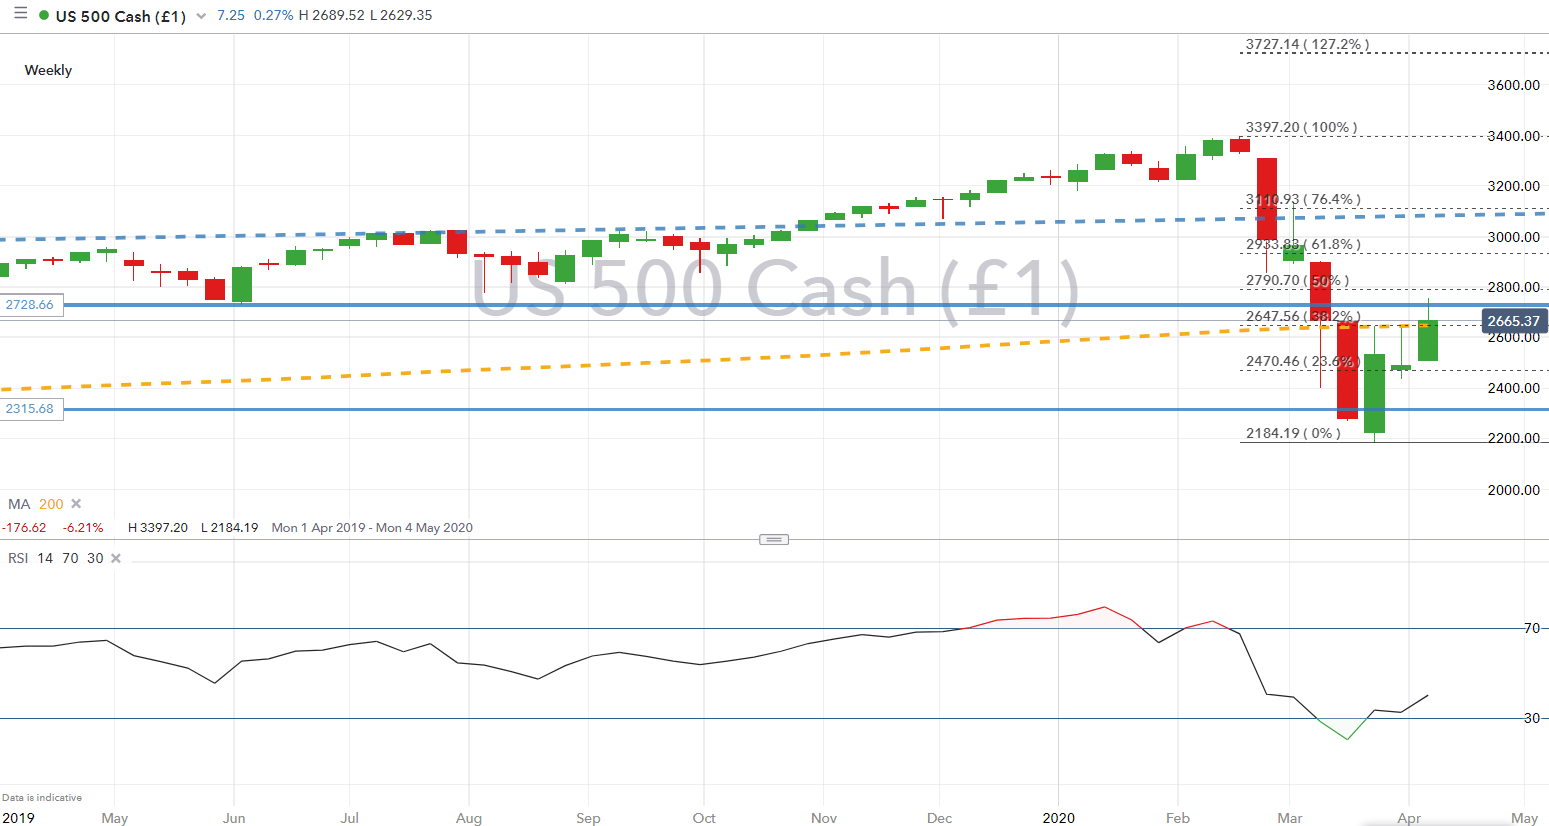
Source: IG Charts
Russell 2000 | Risks Remain Skewed to the Downside
As we look at smaller-cap stocks, the 1200 level is proving to be a tough nut to crack for the Russell 2000 with index yet again failing to make a break above. As such, the index has continued to close below the 23.6% Fibonacci retracement situated 1141, which we feel keeps risks skewed to the downside.
Russell 2000 Price Chart: Weekly Time Frame
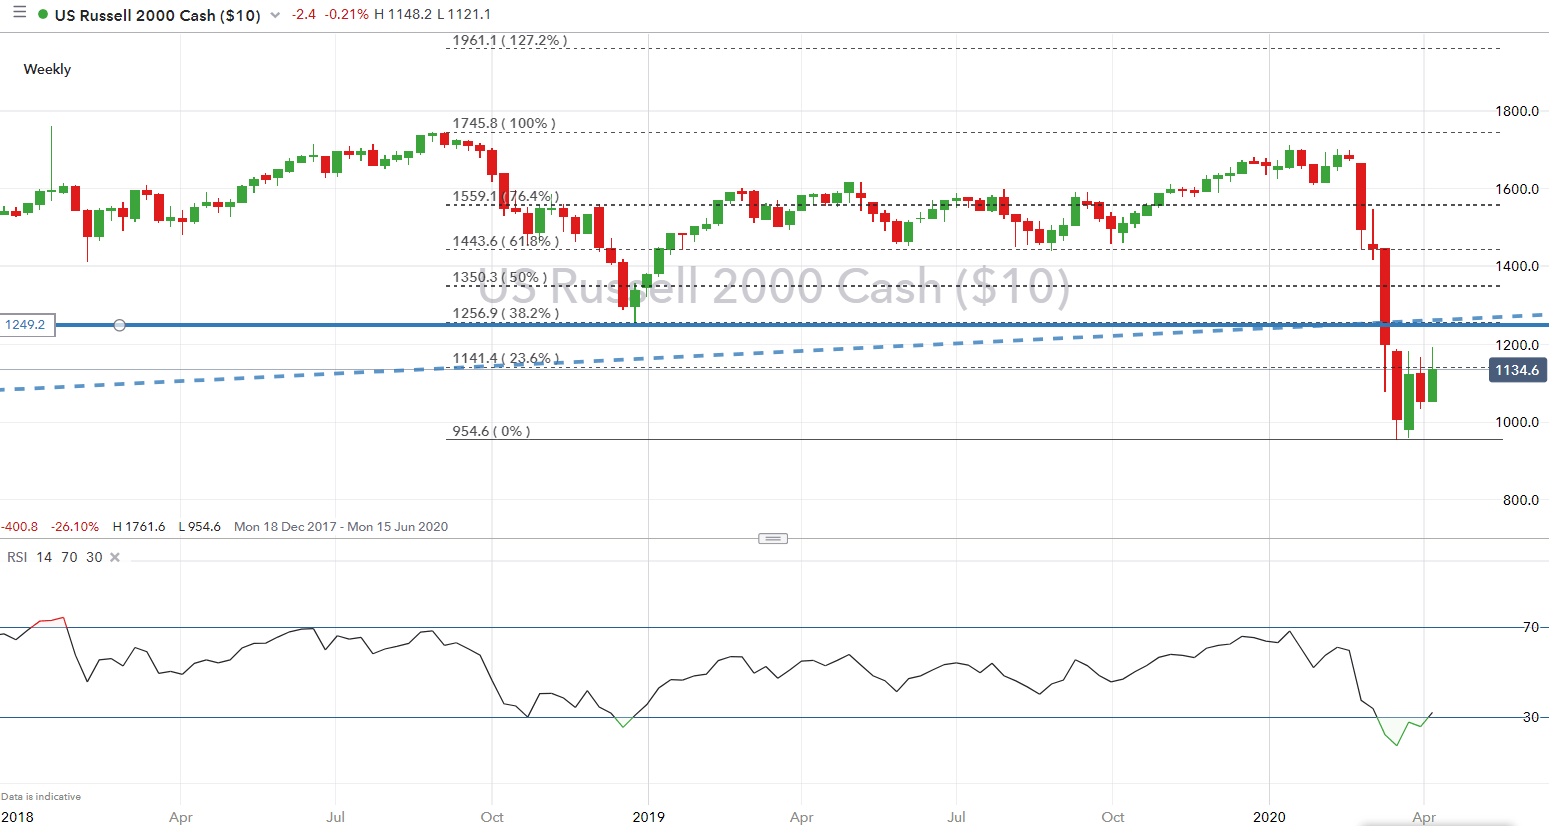
Source: IG Charts
— Written by Justin McQueen, Market Analyst
Follow Justin on Twitter @JMcQueenFX
Be the first to comment