

mixmotive
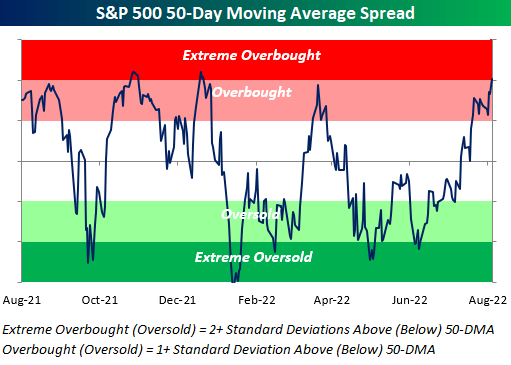
On Friday, the S&P 500 rallied 1.7% to round off the fourth straight week of gains. Relative to the mid-June lows, the index has rallied 16.7%, a notable move as YTD weakness subsides (at least for now). With Friday’s move, the S&P 500 also closed more than two standard deviations above its 50-day moving average for the first time since 12/29/21, marking the end of a 155-day trading day streak in which the index did not close at ‘extreme’ overbought levels.
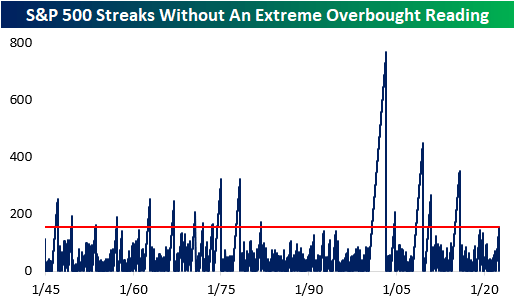
A streak of this length had not been reached since 2015, and the longest streak since WWII ended in 2003 (768 trading days). All in all, there have now been 27 streaks since WWII where the S&P 500 went at least six months without registering a close in ‘extreme’ overbought territory.
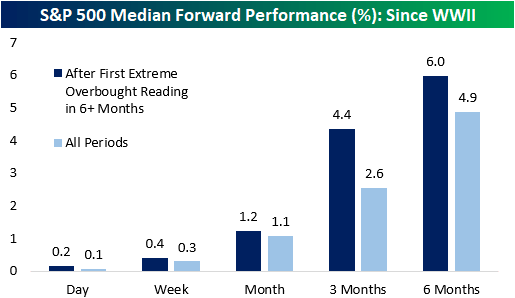
For investors who are long equities, it’s hard not to like the way stocks have performed in recent weeks. However, with the market reaching overbought levels after a sharp rally, fears of a pullback increase as moves of this magnitude may be unsustainable. Historically speaking, median returns following the end of prior streaks without an ‘extreme’ overbought reading that lasted at least six months have, in aggregate, been followed by decent returns. For every time period we looked at (next day, next week, one month, three months, and six months), median returns were positive and better than the historical average for all comparable time periods since WWII. Over the next three months, for example, the S&P 500’s median performance was a gain of 4.4%, which is 1.8 percentage points better than the historical average for all six-month periods. From a historical perspective, at least, when equities reach ‘extreme’ overbought levels after a prolonged period without a similar reading, fears of an imminent reversal were typically unwarranted.
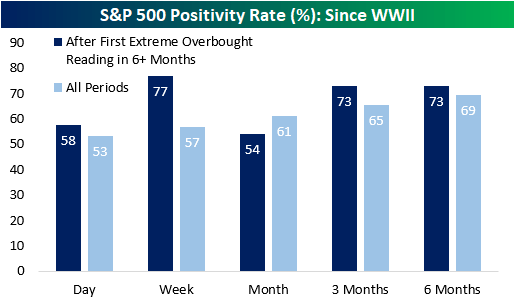
Positivity rates tend to be superior as well, apart from one month forward. Over the next week (which would be through the end of the week in this case), the S&P 500 has performed positively 77% of the time, which is 20 percentage points higher than that of all periods. Over the next three and six months, the positivity rate has been 73%, which is also quite positive.
To paint the full picture, the maximum drawdown following these occurrences was in November of 1981, when the S&P 500 fell by 10.8% over the next three months and 11.6% over the following six months. On the flip side, the best performance occurred following the January of 1975 occurrence, when the index went on to gain 14.4% and 17.7% over the next three and six months, respectively. Over the following month, the data has a range of -7.1% to +6.6%.
Editor’s Note: The summary bullets for this article were chosen by Seeking Alpha editors.
Be the first to comment