

cokada/E+ via Getty Images
The S&P 500 (SPX) rallied the week ending June 24. Much of that rally appears to be short-covering induced, as noted by falling implied volatility levels. The easier way to follow changes in these implied volatility levels is to watch the VIX (VIX), which also fell sharply this past week.
The recent decline in the VIX is not likely to last, though, as uncertainty around the economy and the Fed rate hiking cycle seems to have more questions than answers. Throughout most of this week, there were increasing bets that the VIX index would begin to rise again and climb back above 40 by July. The VIX has been steadily higher since the summer of 2021, which doesn’t seem likely to change.
Implied Volatility Decline Sparks Rally
The term structure shows that implied volatility levels at the beginning of the week were very high, probably because FOMC Chair Jay Powell was speaking on Wednesday and Thursday for a Congressional hearing. Once his hearing was over, implied volatility dropped sharply, helping to pave the way for a bounce in stock prices, as puts lost value, forcing options dealers to unwind short positions.
Bloomberg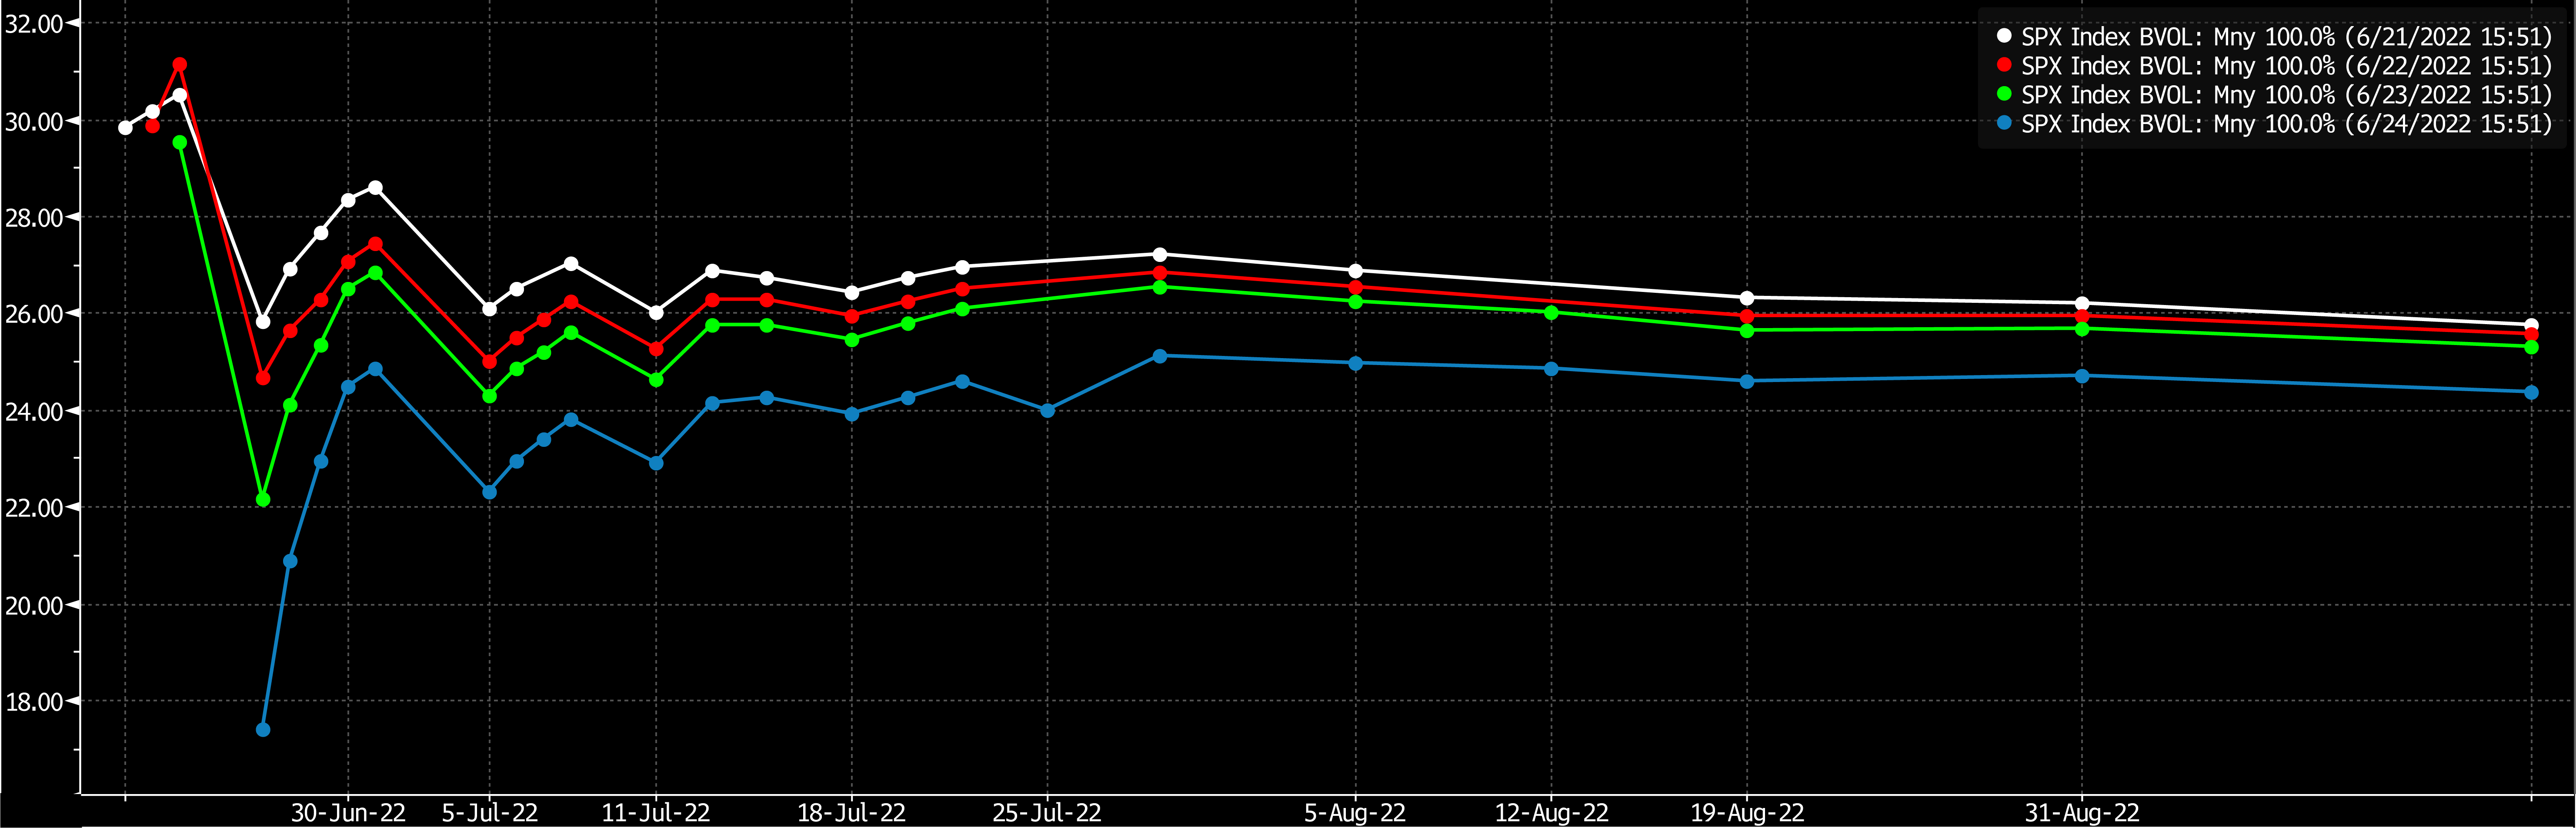
The VIX dropped sharply on Tuesday following the three-day weekend, but then moved higher on Wednesday and was near 30 for most of the morning on Thursday. Once Powell’s testimony was complete on Thursday, around 1:30 PM, the VIX started a melting process, triggering a sharp rally in the S&P 500.
Bloomberg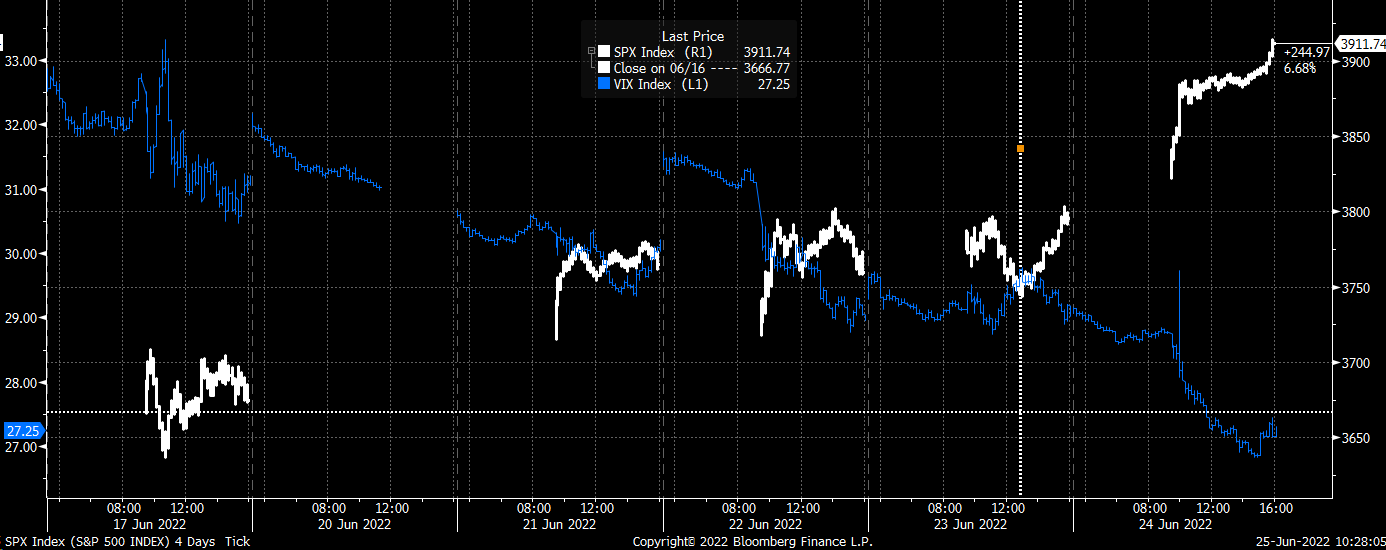
Whether the S&P 500 rally can continue is a whole other story because the rally seems to be entirely induced by volatility melting and not due to some significant change in the market’s underlying fundamentals. The S&P 500 got an added boost on Friday morning when the University of Michigan report showed that consumers’ 5-10 yr inflation outlook came in at 3.1%, which was lower than the preliminary reading of 3.3% earlier in June. It sent implied volatility levels lower and the S&P 500 up, sparking a 3% rally.
Bloomberg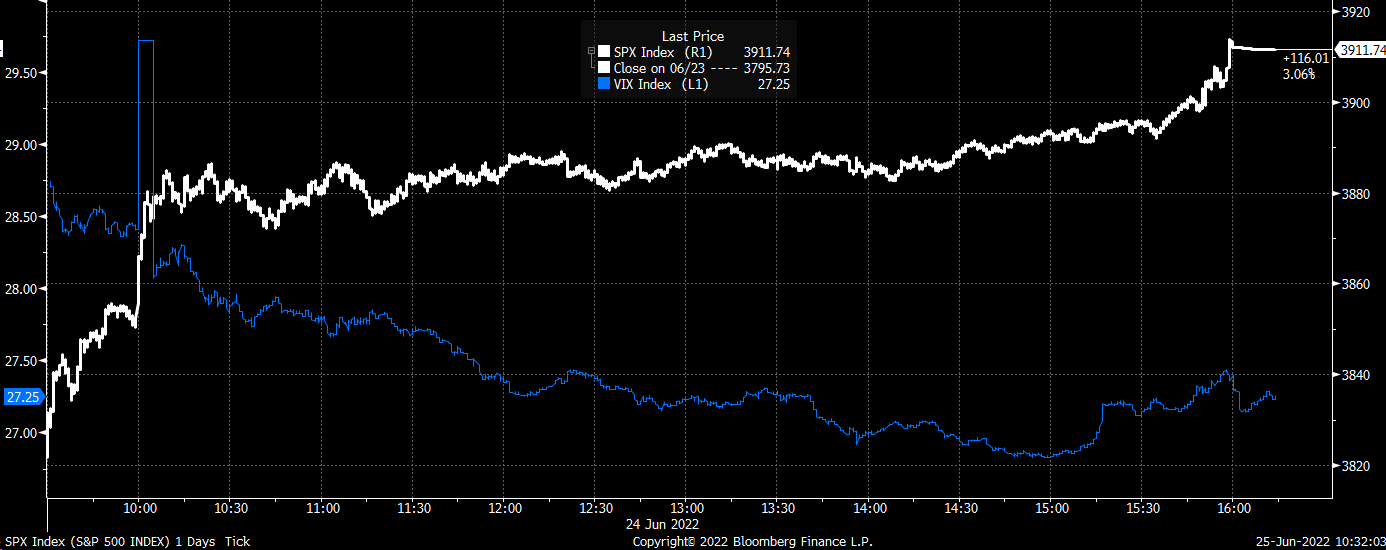
Implied Volatility May Be Due To Climb This Week
The problem with this game is that implied volatility levels in the market are only likely to rise again, sending the VIX higher and the S&P 500 down, potentially as early as this week. The calendar is packed with reasons for implied volatility to rise, with Powell set to speak in a Q&A session on June 29 at an ECB forum along with ECB President Lagarde and BOE Governor Bailey. The event means we could start seeing hedges put back in place as soon as Monday afternoon or Tuesday. On top of that, there will be the Fed’s preferred inflation measure, the PCE index report, coming out on June 30, followed by the ISM manufacturing report on July 1.
The calendar appears to be on the mind of traders as they begin betting that the VIX will start to climb again. On June 24, the open interest for the September 21, 32.5 Calls rose by almost 22,000 contracts. The data shows the calls were bought on the ASK for $3.65 per contact. It would imply that the VIX climbs above 36.15 by the middle of September. It is a colossal wager, too, worth more than $7.9 million in premiums paid.
Additionally, on June 21, the open interest for the July 20, 40 calls saw their open interest level rise by more than 13,000 contracts. The details show that two lots of 10,000 contracts traded on the ASK for prices of $1.85 and $1.90 and bought. These two trades would imply that the VIX will be trading above 41.90 by the middle of July.
Finally, on June 22, the open interest for the September 21, 29 calls rose by around 15,000 contracts. The data shows these calls were bought for around $4.91 per contract. It implies that the VIX will be trading above 33.91 by the middle of September. It is a massive wage, worth nearly $7.3 million in premiums paid.
The VIX Is In An Uptrend
The options traders may have a good reason to believe the VIX is heading higher again. After March 2020, the VIX was steadily making lower highs and lower lows, which helped propel the S&P 500 to never-ending record highs. But in the summer of 2021, something began to change as the VIX began to see higher highs, followed by higher lows starting in the fall.
The Fed’s ultra-easy monetary policy and quantitative easing led to very loose financial conditions, which helped dampen market volatility, making it more appealing for investors to sell volatility and take on more risk. But as the Fed began ending QE and tightening monetary policy, financial conditions have tightened, making it less appealing and riskier to sell volatility, shifting the path of the VIX higher.
Since March 2022, the path of the VIX has shifted again, with the VIX seeing even higher lows as the Fed raises rates aggressively and is beginning to unwind its balance sheet. With the path of monetary policy and the uncertain economic outlook, it seems the VIX may only continue to see higher lows and higher highs for some time.
Trading View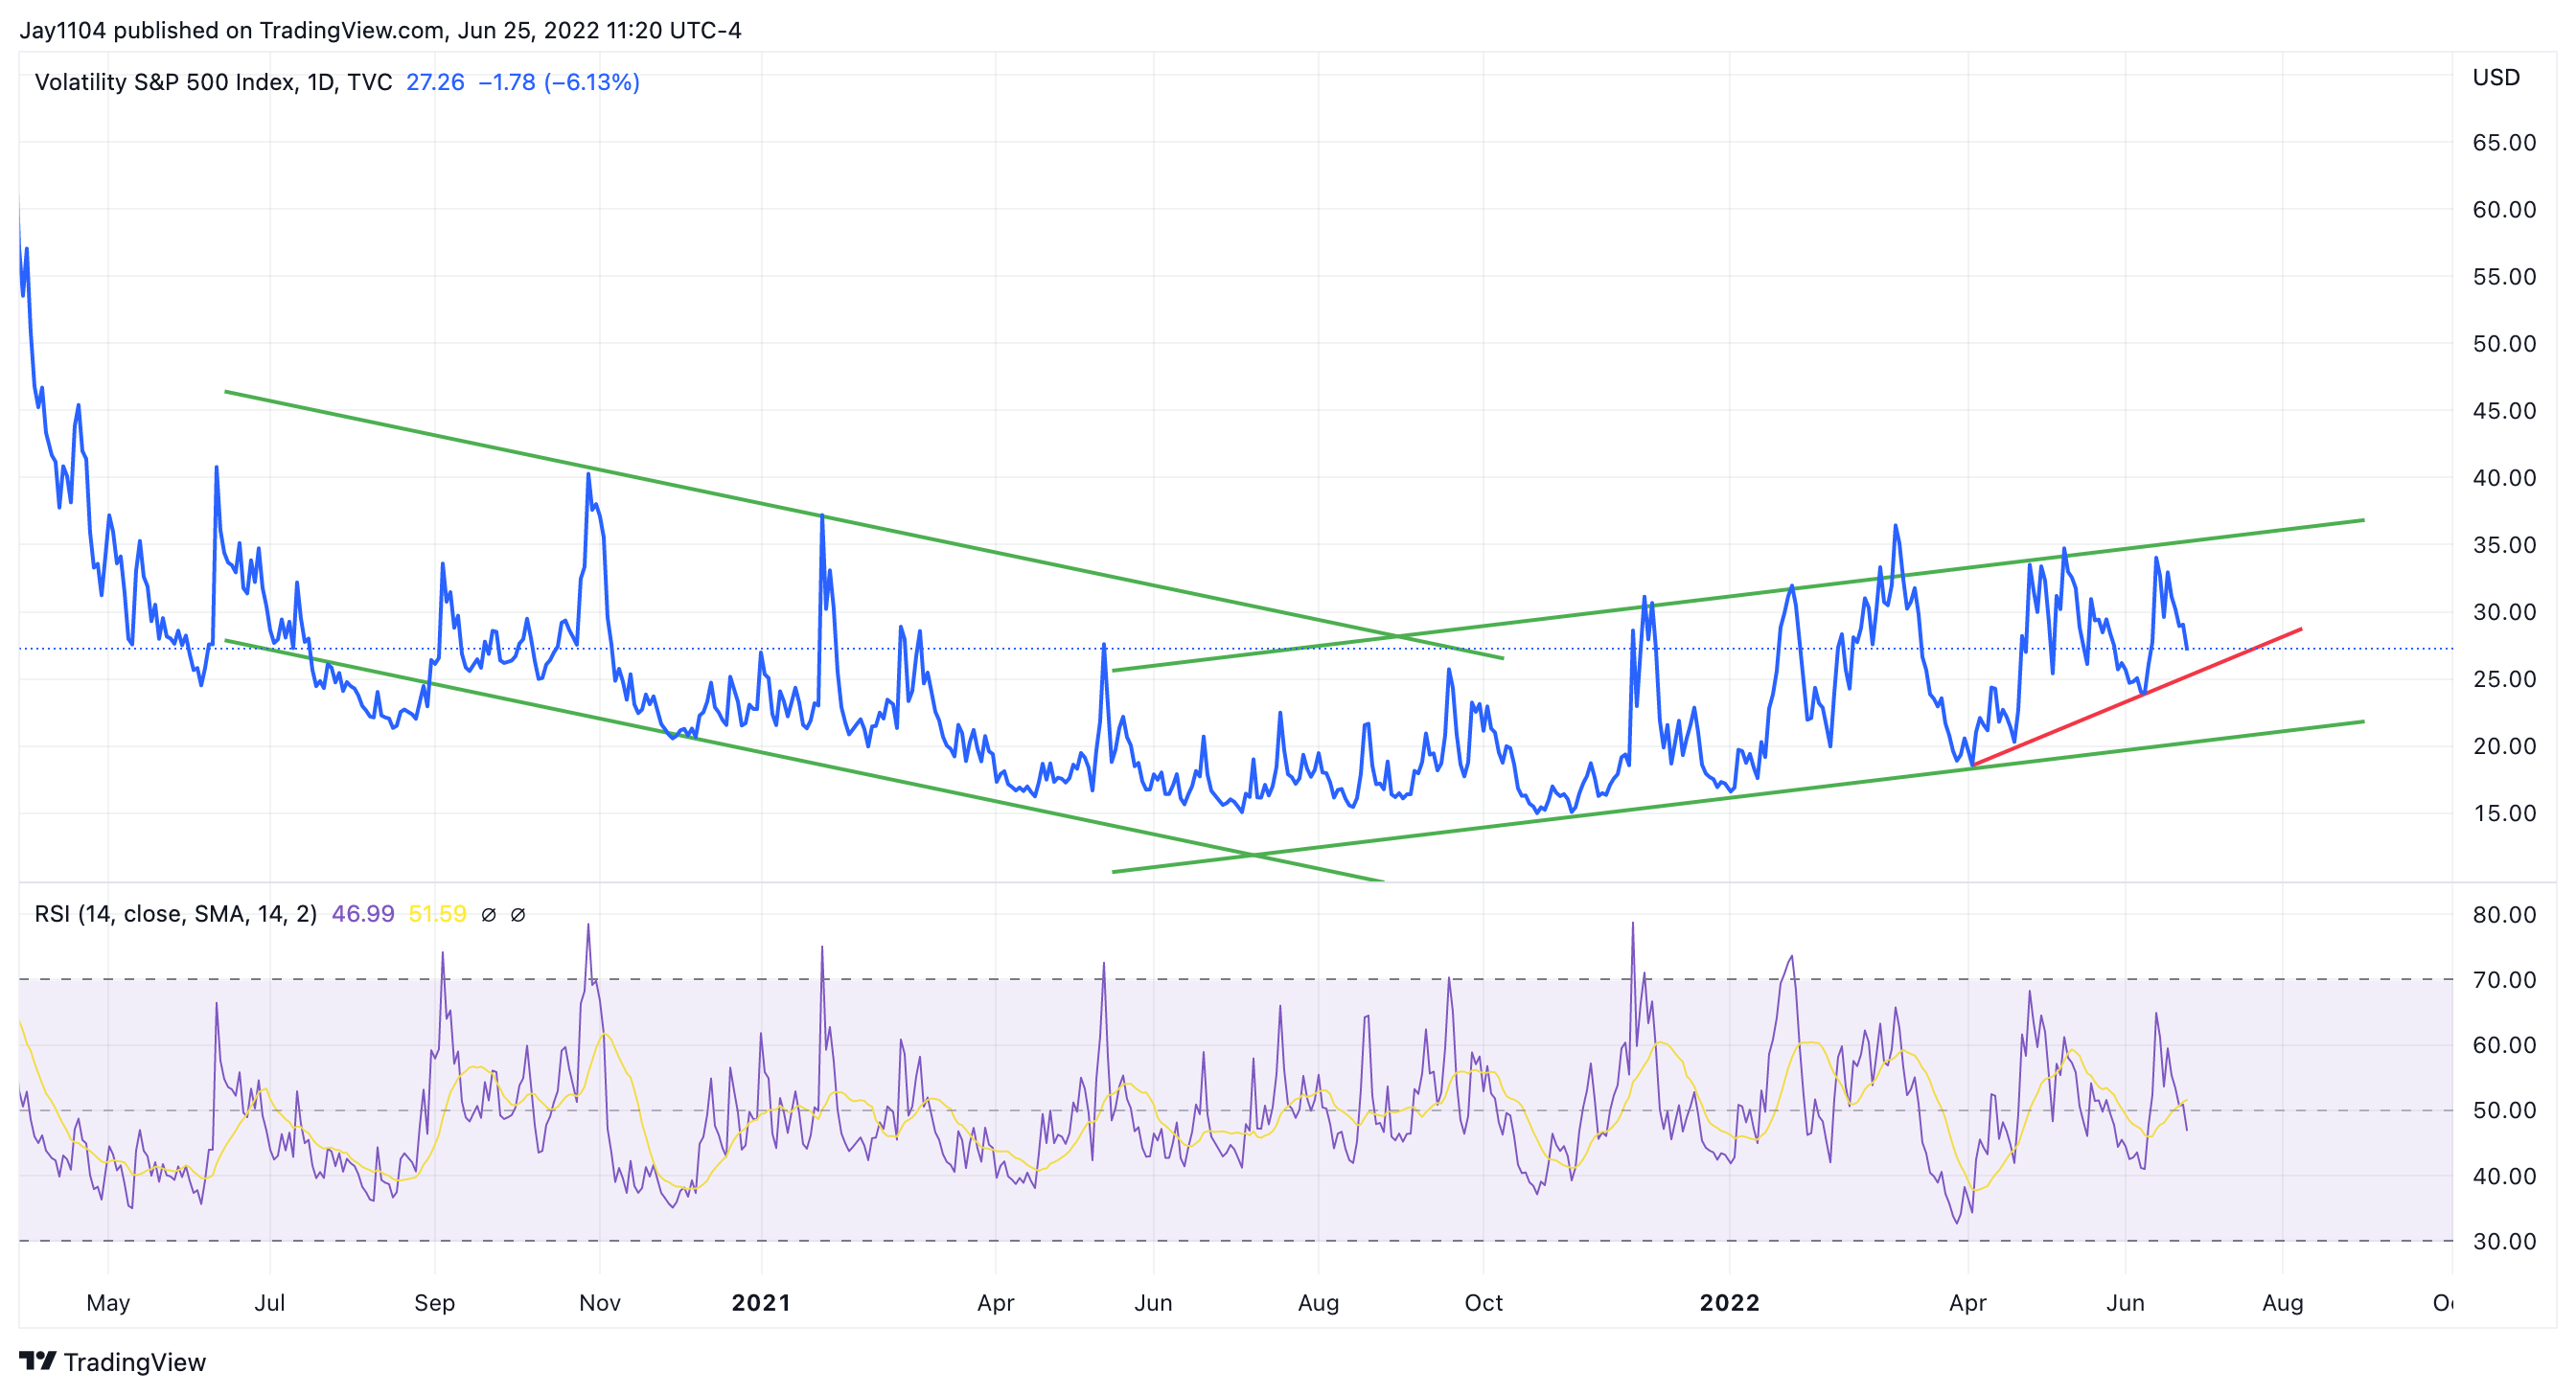
A similar pattern occurred in the early 2000s, with the VIX trending lower from 2003 until February 2007. Once the S&P 500 started topping out in late 2007 and declining steadily, the VIX also began to trend higher. Of course, the final spike in the VIX came following the collapse of Lehman and the contagion that followed.
Trading View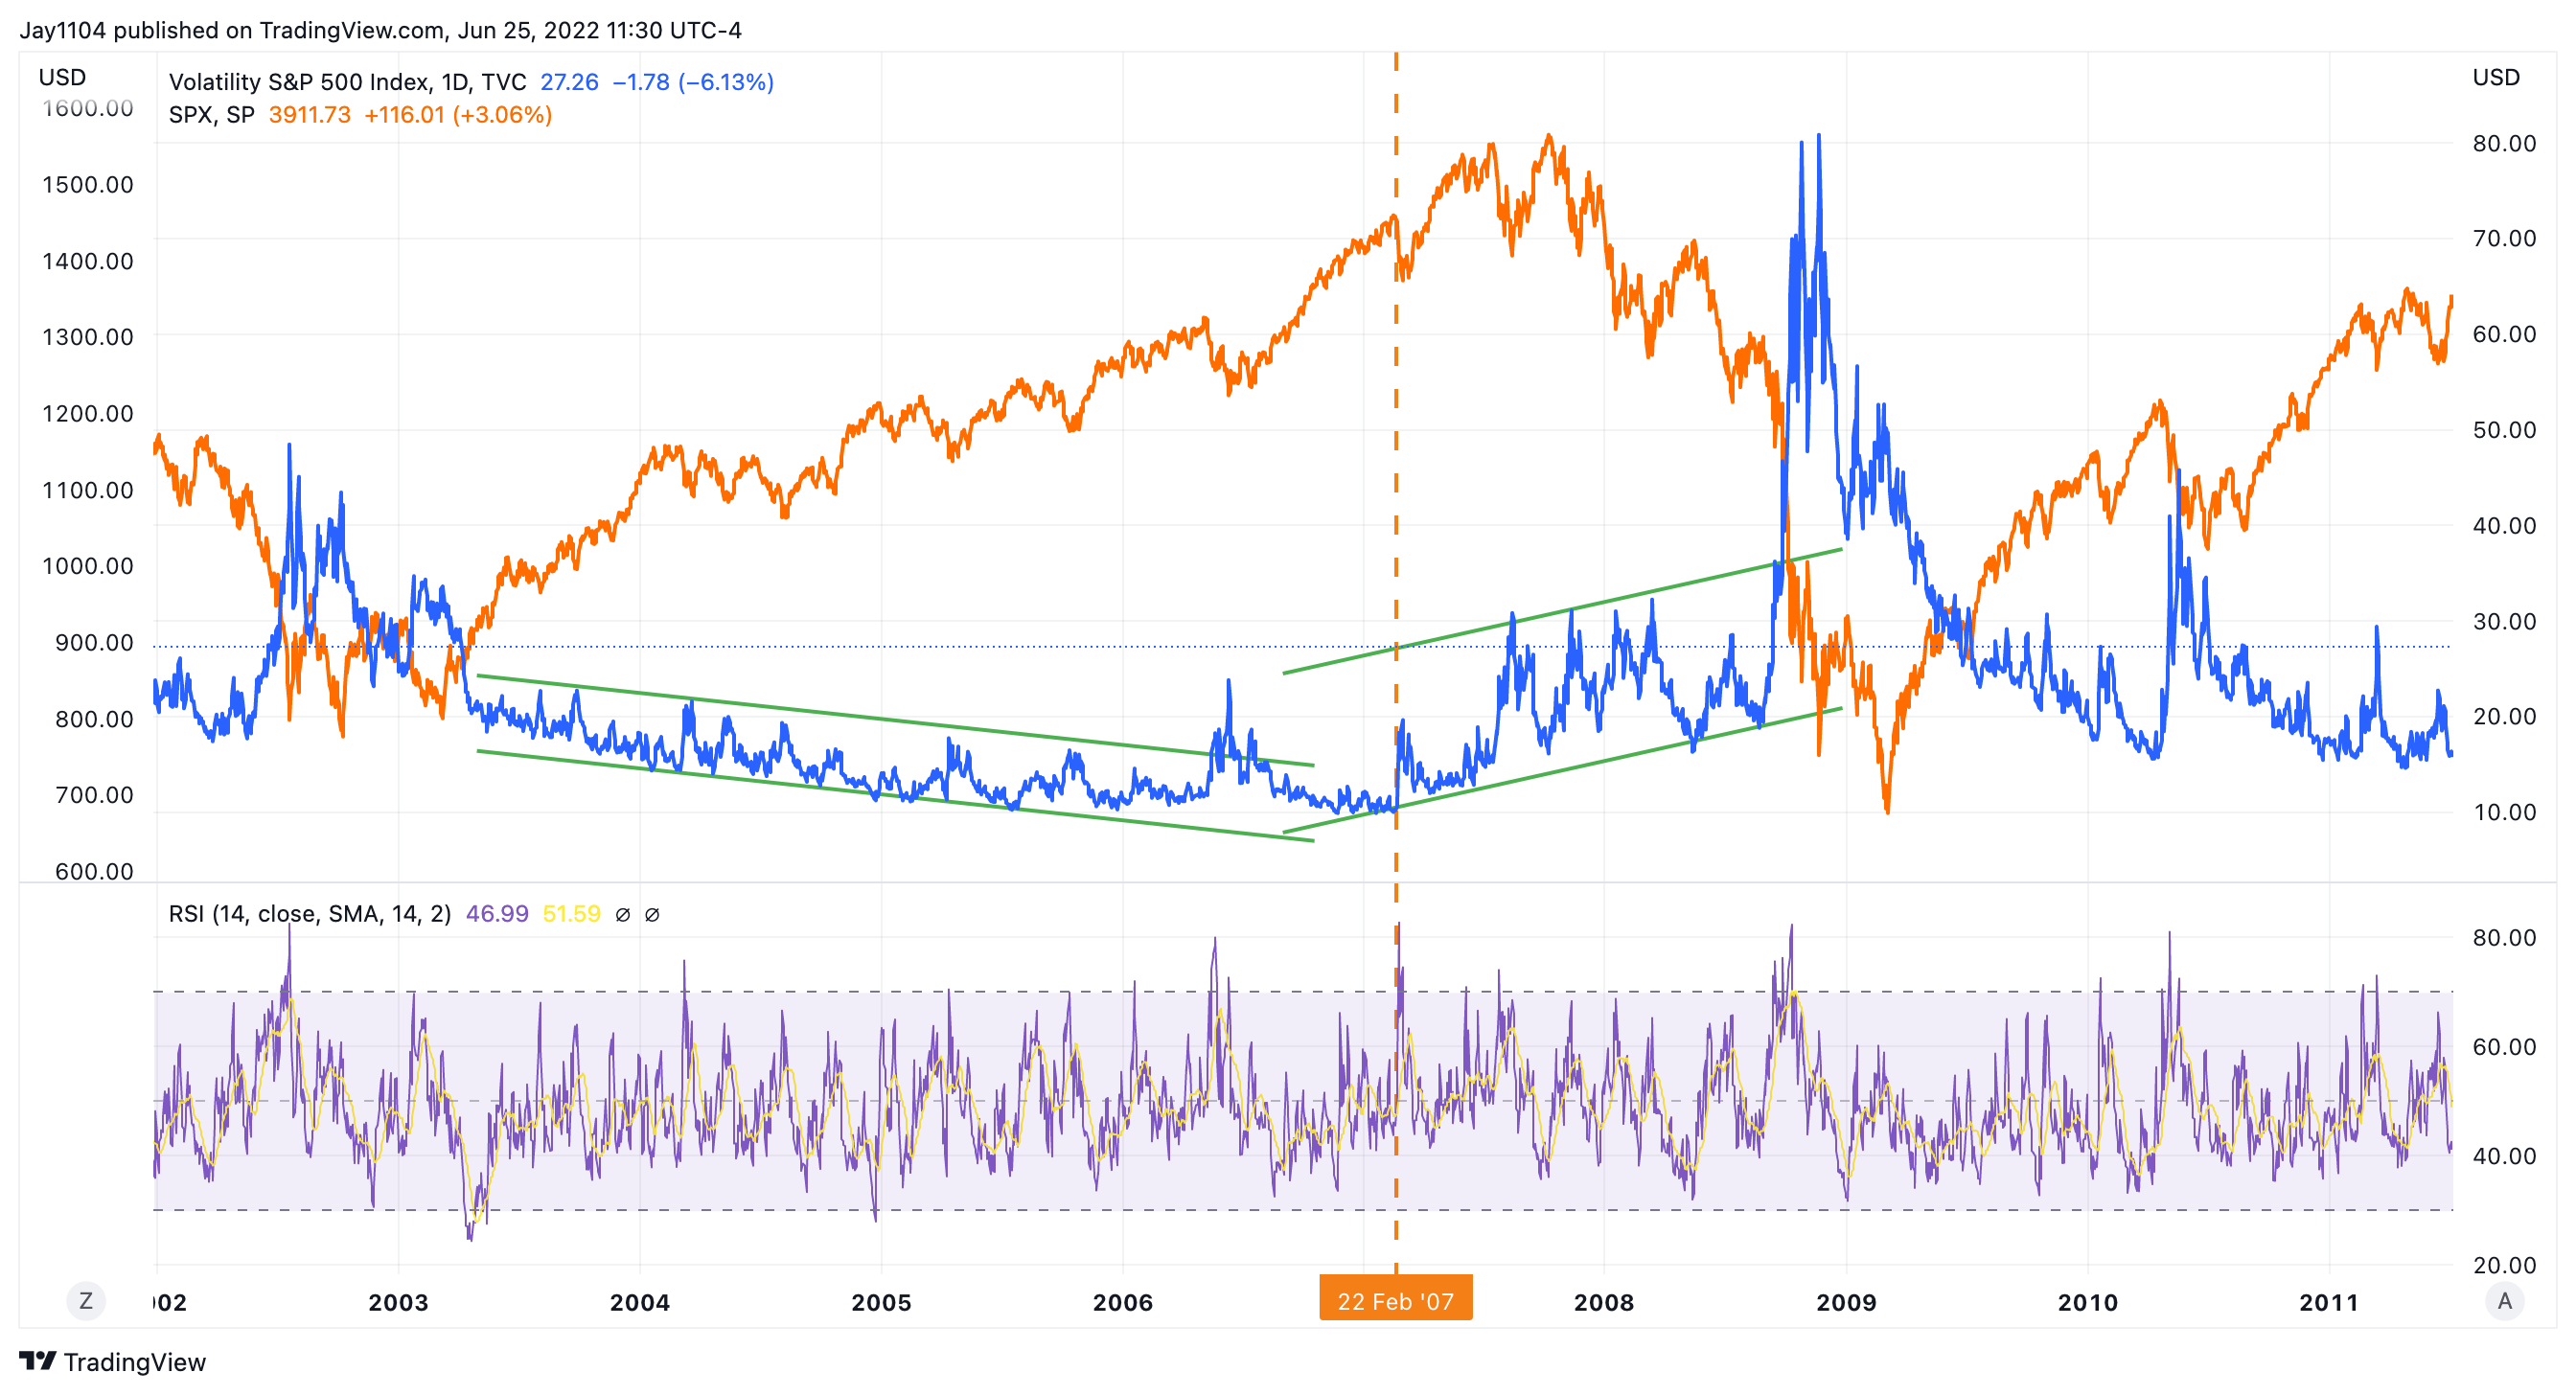
While the VIX hasn’t seen that big spike many are waiting on, that spike may never happen. It may just be that we are in an orderly decline in the equity markets and a period of higher volatility, which means the VIX continues to trend higher for some time or stays elevated.
Overall, implied volatility will likely continue to have an outsized effect on the equity markets, creating steep sell-offs followed by high-speed rallies. But as long as the VIX ultimately continues to trend higher, it is an indication that the S&P 500 is likely to continue heading lower.
Be the first to comment