

cemagraphics
This article is the first in what I hope will be a regular weekend series. A variety of technical analysis techniques will be used to look at probable moves for the S&P 500 (SPY) in the week ahead. No personal bias will be shown and no predictions will be made either. Rather, the market will be viewed in probable outcomes using inflection points – if it is going down, where is it likely to go? If it is going up, where is it likely to test? Likewise, if it breaks a key level to the downside, what does that tell us about the market and where is it likely to go?
The technical analysis itself will be kept fairly simple. After all, one line drawn from the early 2022 top and through the peaks has been the main technical barrier all last year and continues to be important. Tried and tested techniques such as classic patterns, trendlines, major moving averages and horizontal support form the body of the analysis. Demark systems are also used to detect exhaustion and volume profile shows additional areas of interest.
The S&P 500 chart will be analyzed on monthly, weekly and daily timeframes, then the information collated into an actionable summary at the end.
The Market Narrative
While the focus of this article is primarily on technical analysis, a more complete picture combines it with fundamental and sentiment studies.
Last week saw the sixth consecutive drop in inflation and there is now plenty evidence it should continue to fall. The Fed won this particular battle. However, the labor market, and particularly wage growth, remain a risk to any further shift away from the hawkish stance. For now, the message from the Fed is that rates will stay high for an extended period.
But is this warning just a bluff to keep markets from getting too bullish too quickly? The market seems to think so – the expectation is that the Fed are going to slow the pace of hikes to a halt over the coming months and then start cutting in the second half of the year.
The question next week and beyond is whether this situation merits the bullish breakout brewing on the charts. Sentiment has improved drastically in recent months and is reflected already in today’s price. A Fed pivot has been a primary driver for months. What is left to continue the rally? Easing in the labor market and confirmed dovish signals from the Fed would complete the bullish narrative, but neither are going to happen next week. Personally, I wouldn’t trust the rally until a weekly close above 4050.
S&P 500 Monthly
S&P 500 Monthly (Tradingview)
The monthly chart shows the SPX trading inside the range set in December. Resistance is at the range high of 4101 and beyond that, 4325 at the high of August. Support is at December’s low of 3764 and the 3491 low.
There are no exhaustion signals in either direction (using Demark methods).
S&P 500 Weekly
S&P 500 Weekly (Tradingview)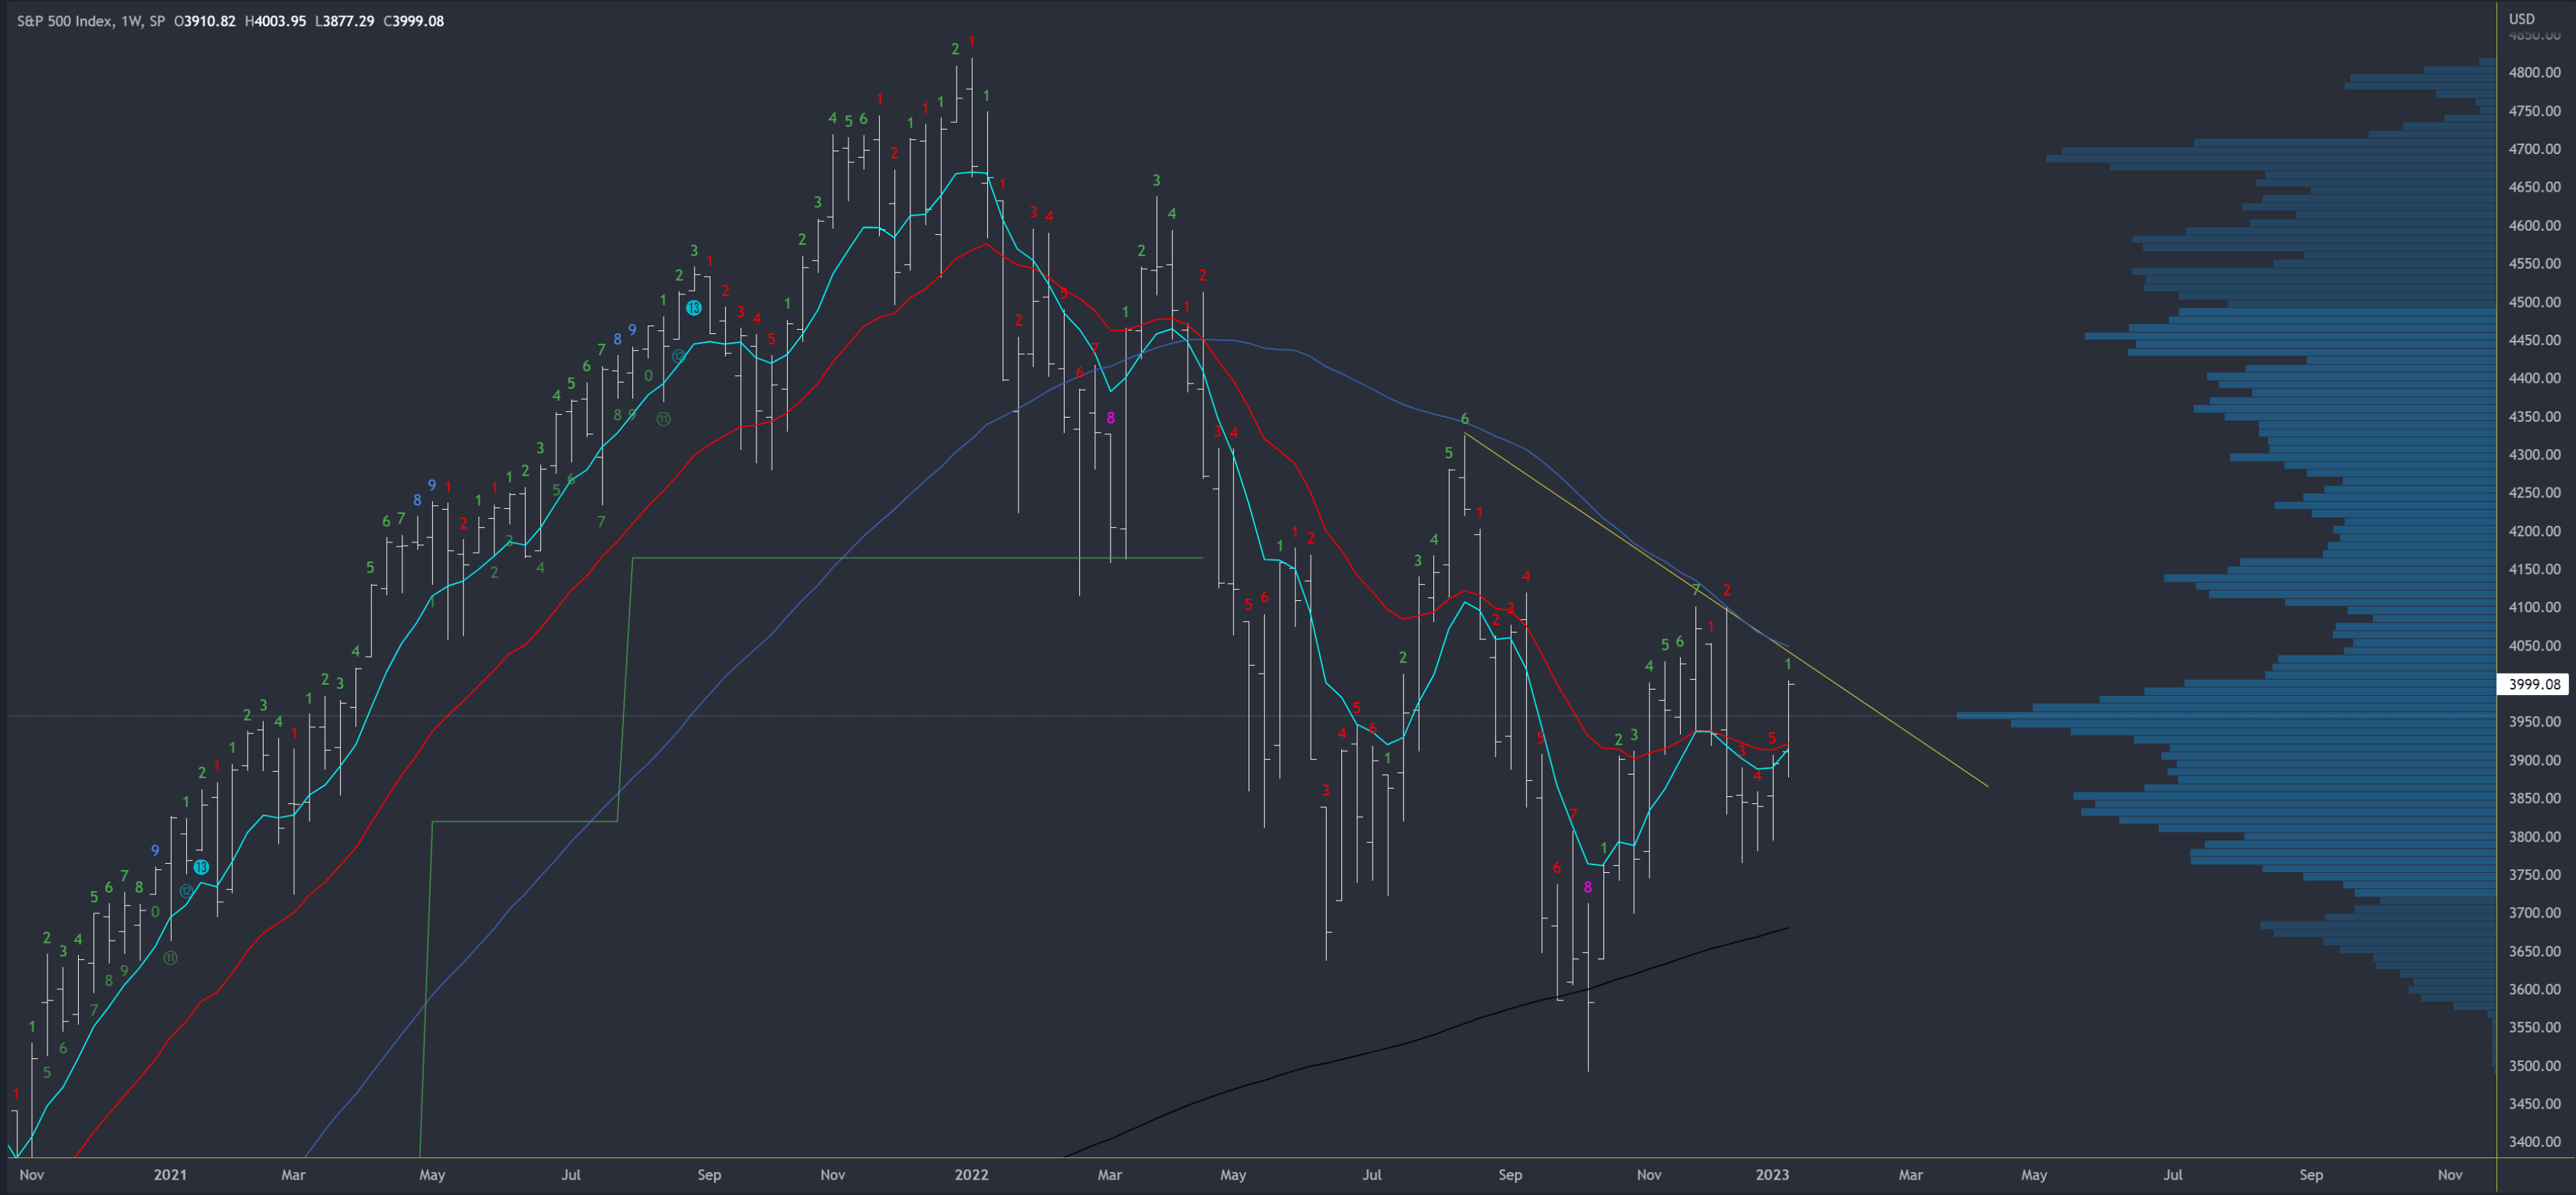
Last week’s bar closed near the highs. This gives an upside bias into early next week to at least take out last week’s 4003 high.
Resistance comes in at 4048.5 at the 50ma, which will drop to around 4045 next week. There is also trendline resistance (or the neckline of an inverse head and shoulders pattern) near the same level at 4040. If this area is broken, 4101 is the next resistance, then 4203 at the large weekly gap. Support is at the 3764 pivot low and the 200ma at 3680.
Again, there are no exhaustion signals in either direction.
The trend is down (lower lows and lower highs).
S&P 500 Daily
S&P 500 Daily (Tradingview)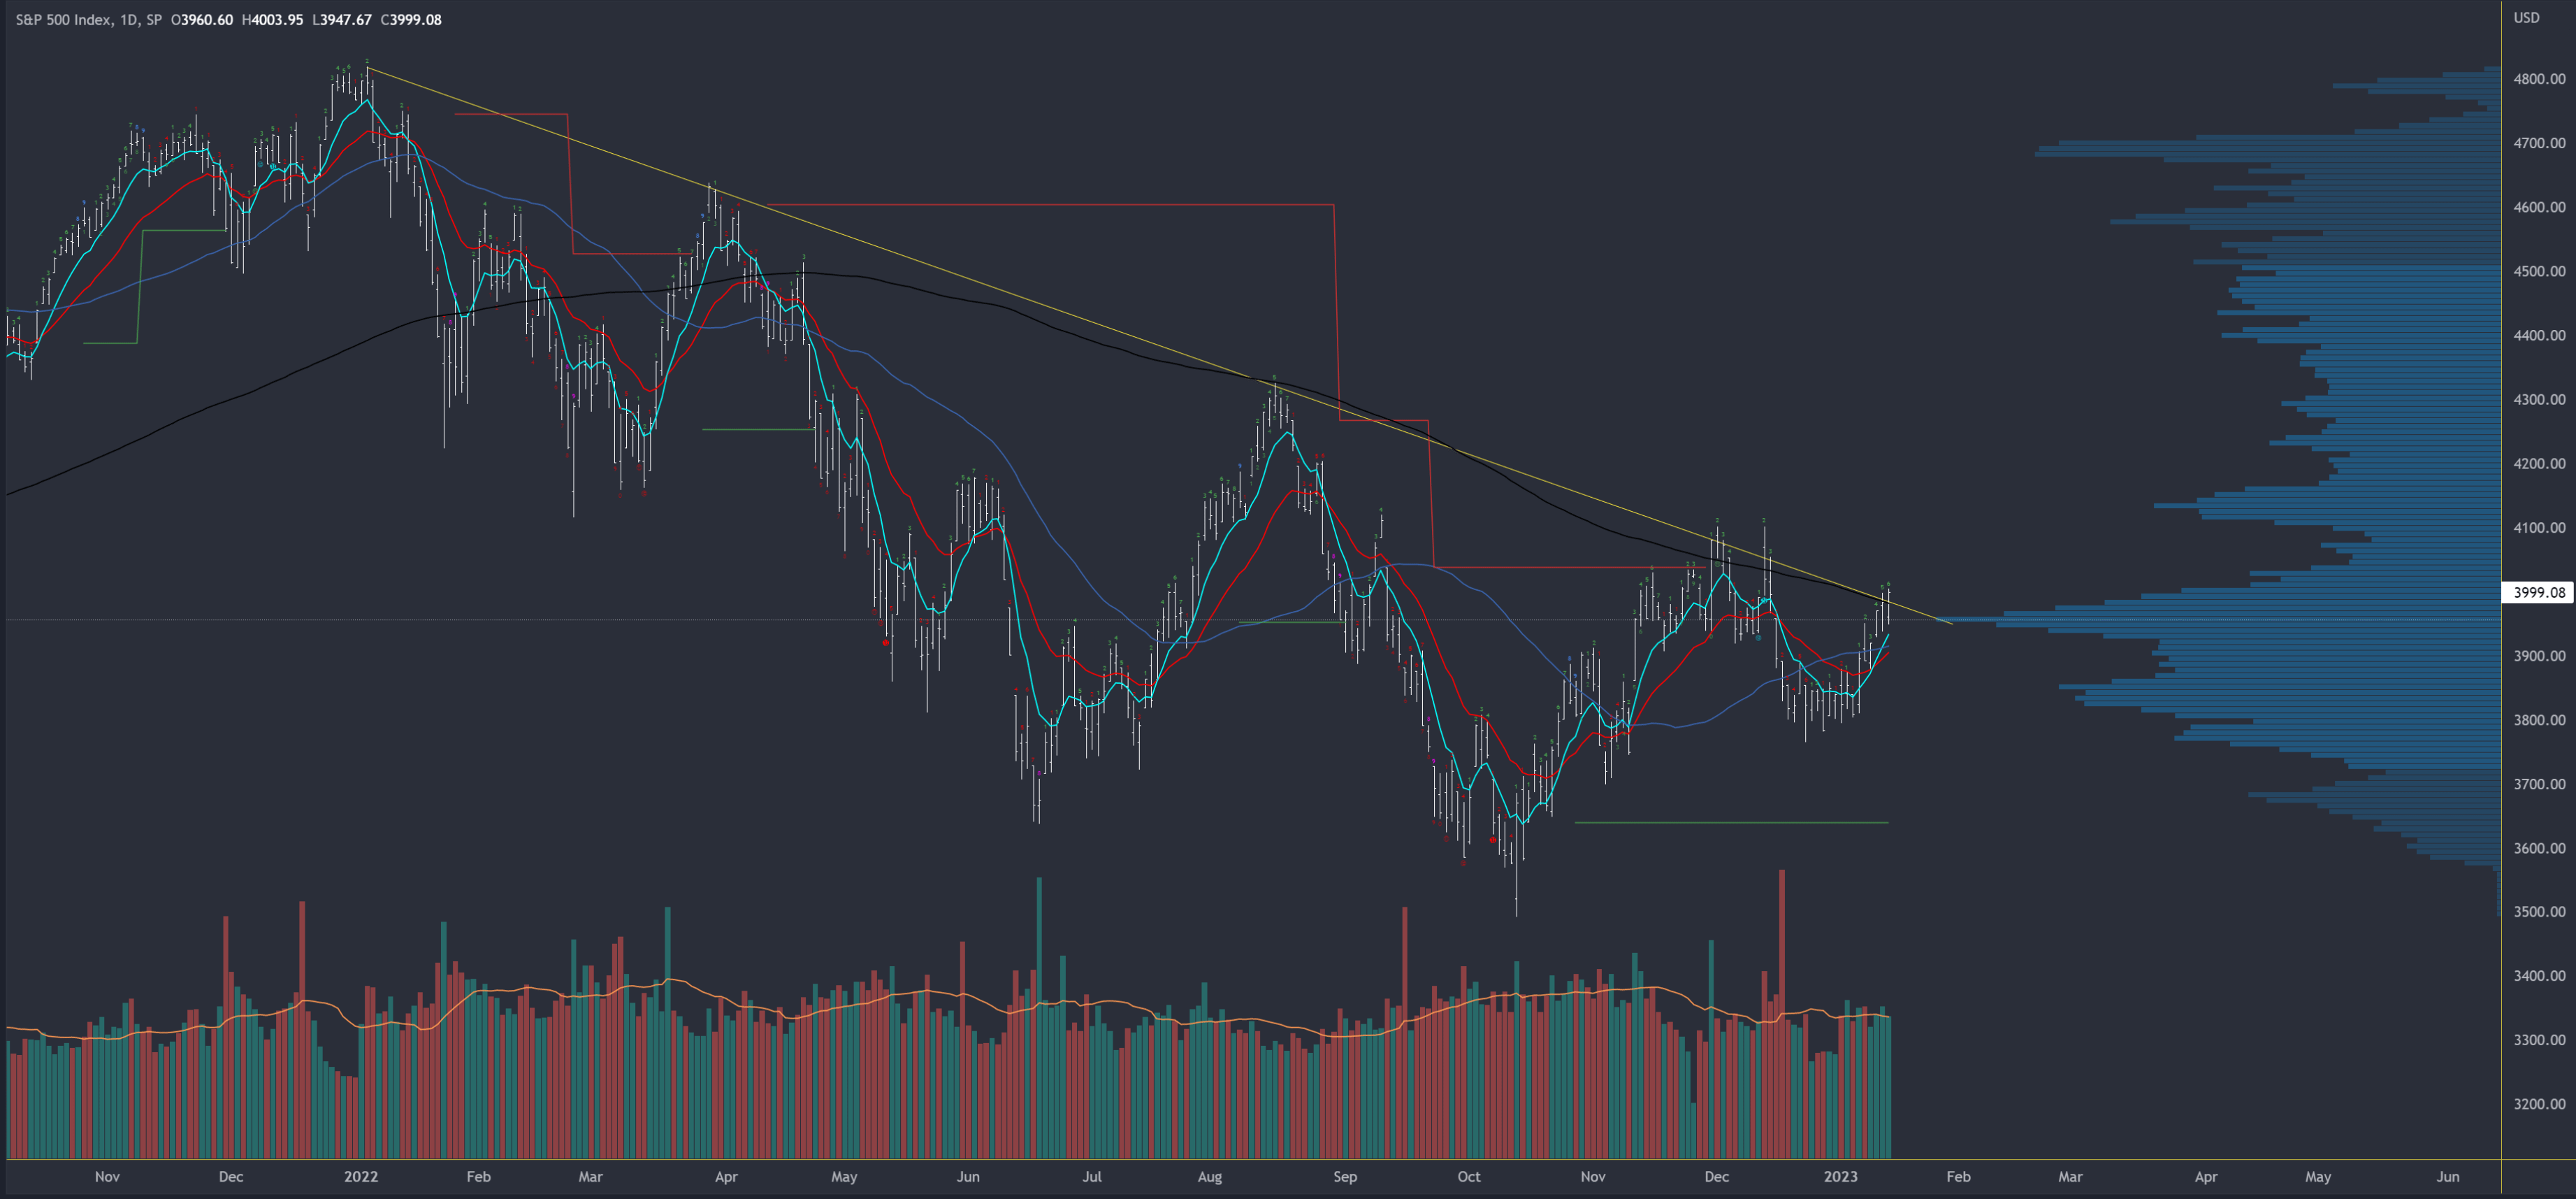
The daily chart is at a very important juncture. Friday’s session closed at 3999 which was above the 200dma at 3981 and above the trendline at the same level.
Resistance has been cleared and now only comes from higher timeframe references. Initial support is at 3928 and the gap, then last Tuesday’s low of 3877.
There are no exhaustion signals but a sell set up is now on bar 6. This could become active on Tuesday and Wednesday (bars 8 and 9) and suggests a pause/pullback could materialize.
The trend is neutral/up. Price is above all major MAs and the bearish trendline.
Scenarios for Next Week
Bullish
As mentioned earlier, there is a bullish bias due to the strong weekly close and the close above the daily 200ma and trendline. A test of weekly resistance at 4040-45 therefore looks likely. If this breaks, it should bring the monthly resistance of 4101 into play, with 4203 a stretched target above that.
Bearish
Exhaustion signals could trigger on Tuesday/Wednesday should there be a rally early in the week. Failure to break 4040-45 could flip the view bearish/neutral if it leads to a drop back under 3975-80 and the 200dma/trendline which is declining by around 3 points a day. Daily references of 3928 and 3877 could then be tested, with 3764 good weekly support and unlikely to be broken.
Conclusion
The S&P 500 is testing very important technical resistance and looks to be making a bullish breakout following the positive CPI report last week. One thing to note is that this is a rather obvious and closely watched move and it still needs to clear weekly resistance at 4040-45 and hold its gains to cement a bullish look.
Be the first to comment