

S&P 500, Nasdaq 100 – Technical Forecasts and Analysis
- US earnings kick-off today with a cluster of high-importance bank releases.
- The S&P 500 is in the middle of a technical battle.
- The Nasdaq 100 outlook remains neutral for now.
Recommended by Nick Cawley
Download our new Q1 equities forecast
CPI Breaking News: US Headline CPI 6.5%, Core at 5.7% – In Line with Estimates
The US earnings season starts today with a slew of high-profile bank releases. Bank of America (BAC), Citigroup (C), JPMorgan Chase (JPM), and Wells Fargo (WFC) all release their latest quarterly figures before the US market opens, along with the world’s largest fund manager Blackrock (BLK). While macro fundamentals and data have been the market drivers of late, the health of the economy will be revealed over the next month as US companies open their books.
Recommended by Nick Cawley
How to Trade FX with Your Stock Trading Strategy
The S&P 500 continues to respect the downtrend off the January 2022 peak with multiple swing highs reversing when testing the trendline. Looking at the daily chart it may be that the series of lower lows made over the last year has come to an end with the mid-October low at 3,502 unlikely to be tested unless there is a serious reversal of market sentiment. The S&P is also battling the 200-day moving average and is trading around the psychological 4,000 level. The chart looks neutral to mildly positive but will need to break and consolidate, above these levels to push further ahead. Upcoming US earnings will be key.
S&P 500 (ES1!) Price Chart – January 13, 2023
US 500 Sentiment
Retail Trader data show 46.16% of traders are net-long with the ratio of traders short to long at 1.17 to 1.The number of traders net-long is 0.68% lower than yesterday and 23.94% lower from last week, while the number of traders net-short is 4.49% higher than yesterday and 35.30% higher from last week.
We typically take a contrarian view to crowd sentiment, and the fact traders are net-short suggests US 500 prices may continue to rise. Traders are further net-short than yesterday and last week, and the combination of current sentiment and recent changes gives us a stronger US 500-bullish contrarian trading bias.
What is Earnings Season and What to Look for in Earnings Reports?
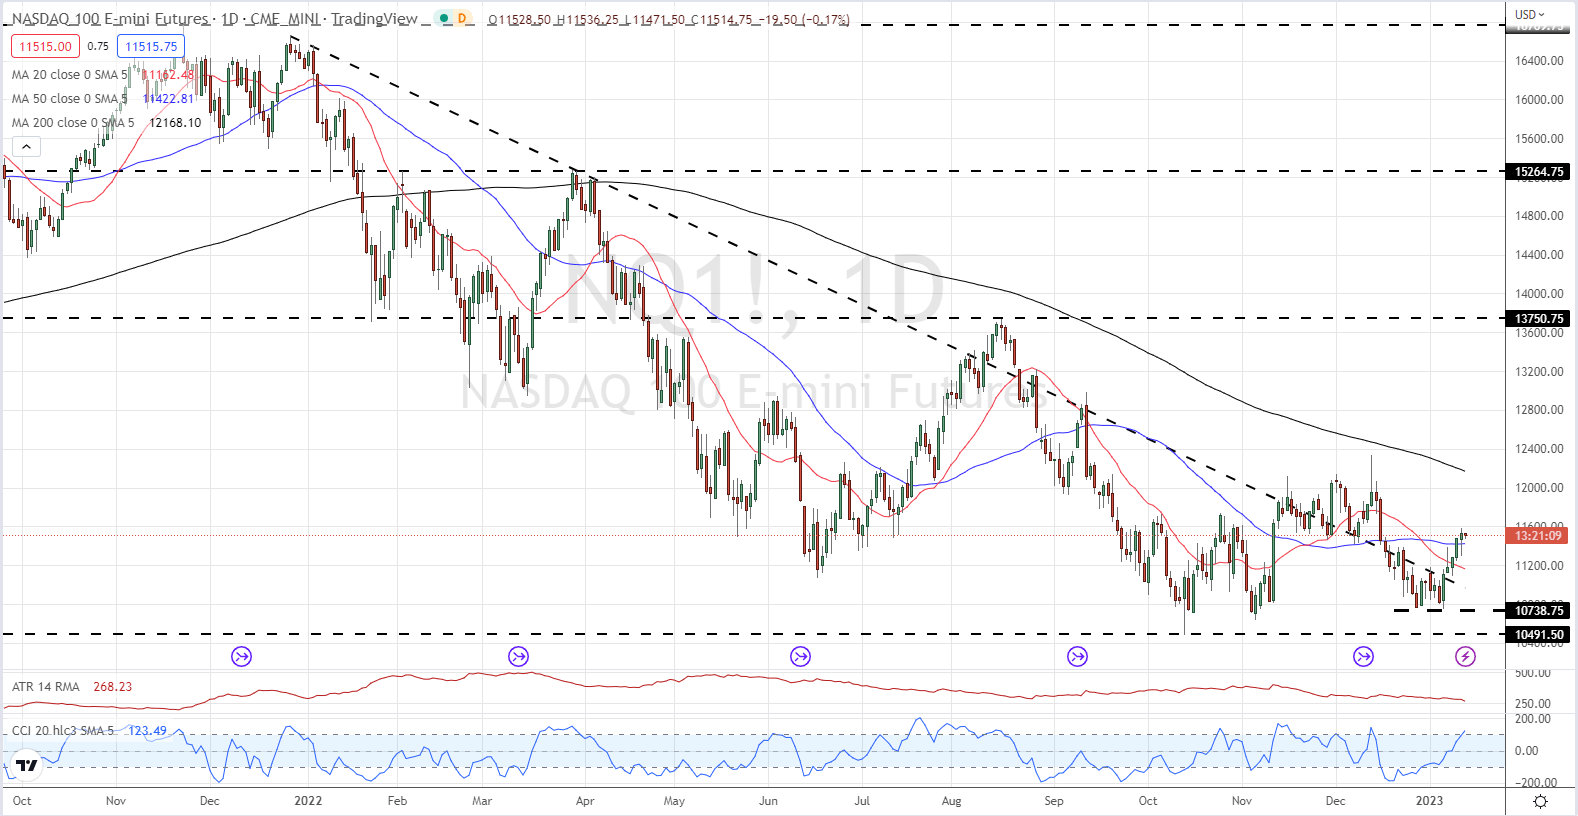
The Nasdaq 100 technical outlook remains neutral despite another break above the dominant downtrend. The last two breaches of this trendline have failed and while the recent cluster of lows around 10,800 may hold, it could be tested again, especially if any of the large tech companies announce disappointing results. Microsoft (11.8%), Apple (11.6%), and Amazon (6.5%) account for around 30% of the Nasdaq by market capitalization, and these three need to be watched closely.
Nasdaq 100 (NQ1!) Daily Price Chart – January 13, 2023
What is your view on the S&P 500 and the Nasdaq 100 – bullish or bearish?? You can let us know via the form at the end of this piece or you can contact the author via Twitter @nickcawley1.
Be the first to comment