

S&P 500, Nasdaq 100 Prices, Charts, and Analysis
US equity markets remain rangebound as the latest look at US price pressures heaves into view. The eagerly awaited release is expected to show core inflation m/m easing to 0.5% in May, compared to 0.6% in April, while monthly headline inflation is expected to rise to 0.7% from a prior month’s 0.3%. A strong deviation from tomorrow’s expected numbers will spark a fresh round of volatility in the US equity space.
For all market-moving data releases and events, see the DailyFX Economic Calendar
The recent rise in longer-dated US Treasury yields – the 10-yr benchmark is offered around 3.04% – suggests that the rates market is readying itself for even more aggressive tightening by the Federal Reserve to try and dampen price pressures in the US. The recent US jobs Report (NFPS) showed the labor market in robust health adding to fears that wage pressures may stoke inflation further. On the flip-side, a strong jobs market should help to underpin economic activity in the US, giving the Fed more wiggle room when it comes to tightening monetary policy.
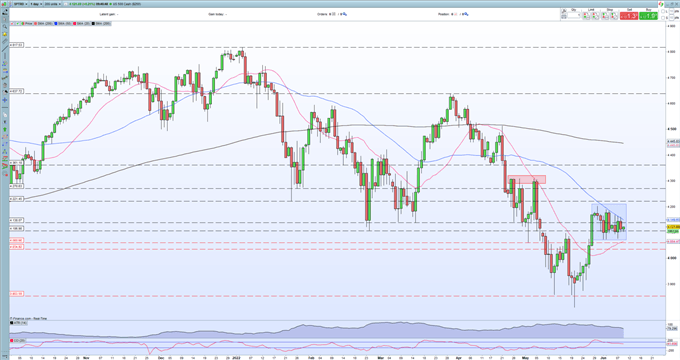
The S&P 500 is in wait-and-see mode, highlighted by the blue box. Short-term price action has produced a series of lower highs, while support around the 4,070 level has been tested three times and has held firm. The S&P 500 is also trapped between the 20- and 50-day moving average, adding to an already cloudy outlook. One indicator that may give a clue to future price action is a bullish flag formation made over the last three weeks. If this remains in place over the next few days, the next level of resistance is an old area of prior highs around 4,300.
How to Trade Bullish Flag Patterns
S&P 500 Daily Price Chart – June 9, 2022
Retail trader data show 57.13% of traders are net-long with the ratio of traders long to short at 1.33 to 1. The number of traders net-long is 5.58% higher than yesterday and 2.16% lower from last week, while the number of traders net-short is 6.50% lower than yesterday and 4.75% higher from last week.
We typically take a contrarian view to crowd sentiment, and the fact traders are net-long suggests US 500 prices may continue to fall. Positioning is more net-long than yesterday but less net-long from last week. The combination of current sentiment and recent changes gives us a further mixed US 500 trading bias.
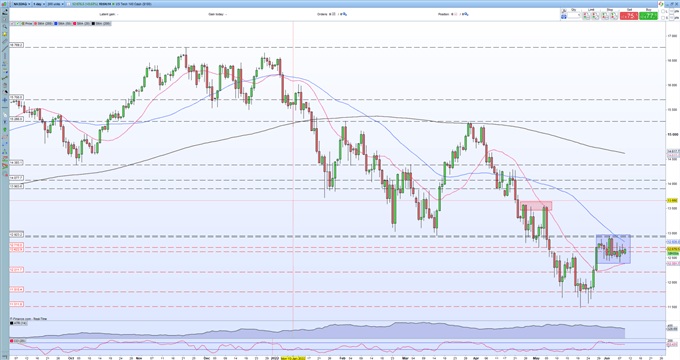
The Nasdaq 100 daily chart is very similar to the S&P’s with a current box formation, a potential bullish flag, with the price sitting mid-way between the short- and medium-term simple moving averages. All eyes are on tomorrow’s CPI data.
Nasdaq 100 Daily Price Chart – June 9, 2022
What is your view on the S&P 500 and Nasdaq 100 – bullish or bearish?? You can let us know via the form at the end of this piece or you can contact the author via Twitter @nickcawley1.
Be the first to comment