

US STOCKS OUTLOOK:
- U.S. stocks stage a solid rally on Tuesday as bullish sentiment sweeps markets
- The S&P 500 and the Nasdaq 100 break above key resistance levels, sparking strong buying interest and accelerating the rebound
- In this article we explore key technical levels for the S&P 500 and the Nasdaq 100
Most read: Gold Momentum Wanes amid Rising Rates, Levels for XAU/USD
After a subdued performance at the start of the week, U.S. stocks rocketed higher on Tuesday, rallying across most sectors, driven by technicals, speculation the market has bottomed and perhaps misguided expectations that the path ahead may be less treacherous for equities despite hawkish repricing of Fed policy.
Against this backdrop, the S&P 500 jumped 1.13% to 4,511, its highest level since February 11. For its part, the Dow Jones climbed 0.74% to 34,807, driven by strong gains in Boeing and Nike shares, which were up 2.85% and 2.23% correspondingly at the close. Last but not least, the Nasdaq 100 soared 1.94% to 14,654, rebounding more than 12% from last week’s lows, surprisingly undeterred by the sharp rise in bond rates.
Though sentiment appears to be on the mend after so much negativity earlier this month, the outlook remains subject to extraordinary uncertainty amid mountinggeopolitical headwinds and aggressive monetary tightening looming on the horizon.
On the geopolitical front, the military conflict in Eastern Europe continues with no end in sight after almost a month of fighting due to the lack of substantial progress in ceasefire negotiations. The longer the war between Russia and Ukraine drags on, the greater the adverse effect on the global economy and inflation, especially if commodity trade flows are further disrupted by sanctions imposed on Moscow.
However, the elephant in the room that shouldn’t be ignored is the central bank normalization roadmap. Yesterday, Fed Chair Powell pledged to act expeditiously to restore price stability, acknowledging that the institution is prepared to raise rates by more than the standard 25bp hike to tackle inflation.
Naturally, yields repriced higher following Powell’s remarks, with the 2- and 10-year yields soaring to 2.18% and 2.38%, respectively, their highest levels since May 2019. Rising yields weigh on stocks valuations by increasing the rate at which future cash flows are discounted, a conventional technique to price equities.
At the same time, the moves in the bond market have accelerated the flattening of the Treasury curve, driving the 2s10s spread to 20 bps and very close from inversion territory, a sign that an economic downturn could be brewing. At this point, Wall Street does not anticipate a recession in 2022 or 2023, but if the winds shift, forecasts could change rapidly. In this regard, looking at the shape of the yield curve could be helpful in offering a glimpse of what is to come (more info here).
Related: Dow Jones, Nasdaq 100, S&P 500 Technical Outlook
S&P 500 TECHNICAL OUTLOOK
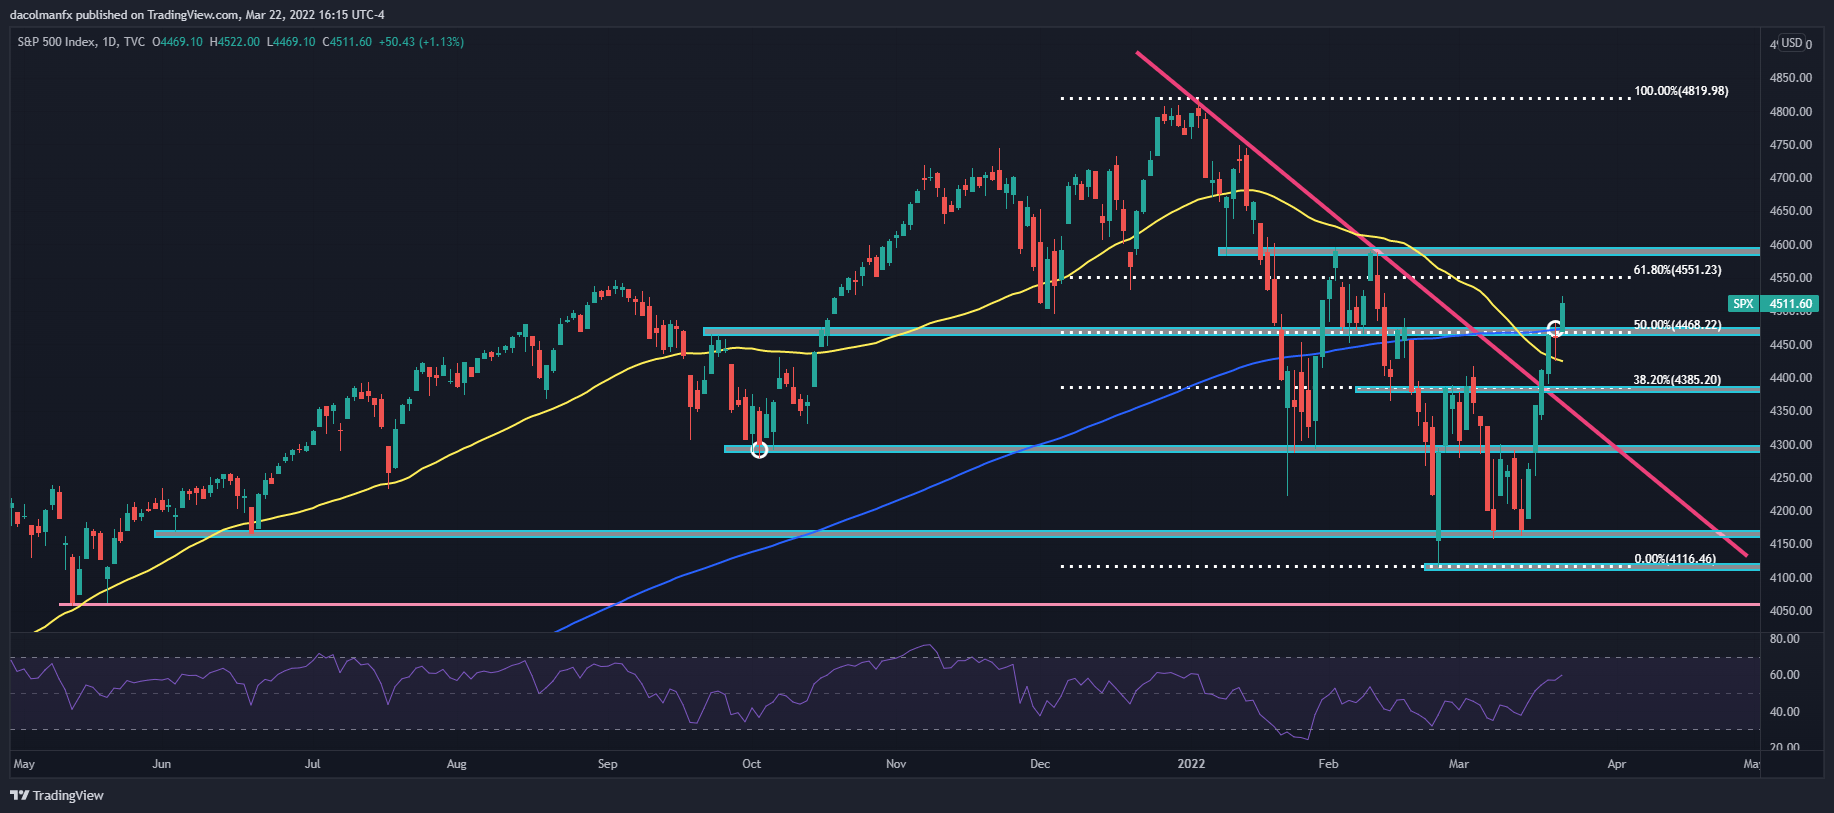
The process of repairing the extensive technical damage caused by the 2022 sell-off remains underway on Wall Street. Today, after a broad-based rally, the S&P 500 managed to clear Fibonacci resistance and reclaimed its 200-day moving average, a bullish breakout. Considering that the index has risen more than 8% since last week, some pause and some consolidation shouldn’t be ruled out in the coming sessions, but if prices keep charging higher, the rebound could extend toward 4,551, the 61.8% Fib retracement of January/February decline. On the other hand, if sellers resurface and retake control of the market, initial support rests at 4,468, followed by 4,385.
S&P 500 (SPX) Chart by TradingView
NASDAQ 100 TECHNICAL OUTLOOK
The Nasdaq 100 overcame key levels on Tuesday after knifing atop key resistance near 14,458, a technical barrier created by the 50-day SMA and the 38.2% Fibonacci retracement of the November 2021/March 2022 drop. After the powerful rally that started last week, it is possible to see some sideways price action, but if bulls remain at the wheel, a retest of 14,901 seems likely. In the event of a bearish reversal, support appears at 14,458, and 14,080 thereafter.
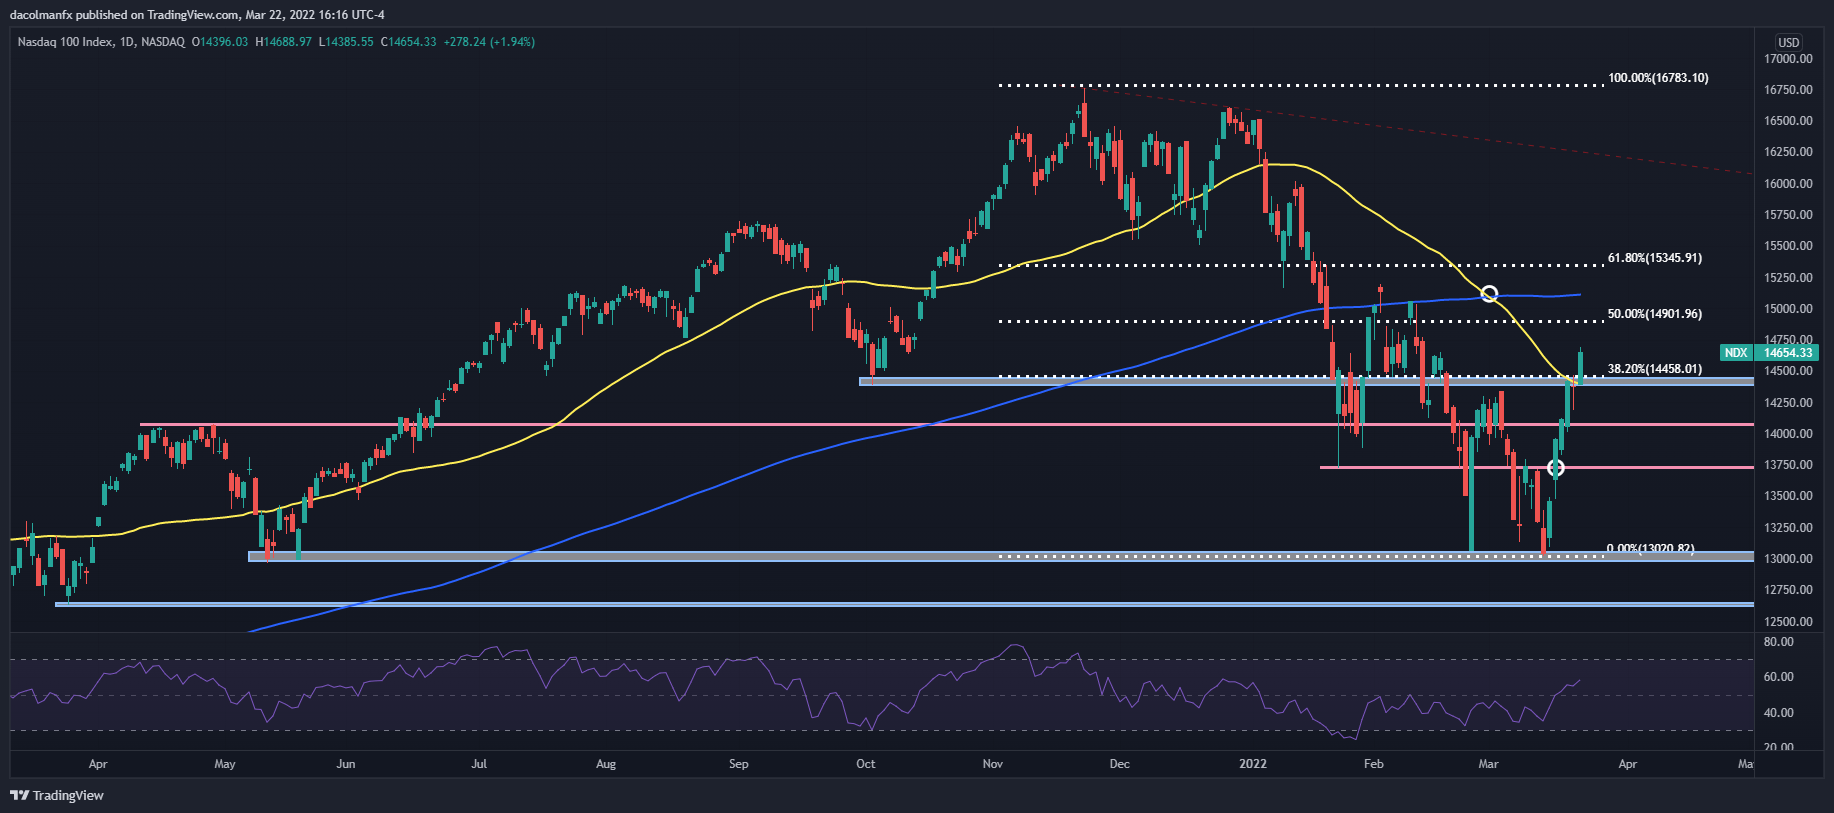
Nasdaq 100 (NDX) chart prepared in TradingView
EDUCATION TOOLS FOR TRADERS
- Are you just getting started? Download the beginners’ guide for FX traders
- Would you like to know more about your trading personality? Take the DailyFX quiz and find out
- IG’s client positioning data provides valuable information on market sentiment. Get your free guide on how to use this powerful trading indicator here.
—Written by Diego Colman, Contributor
Be the first to comment