

S&P 500, Mystery Block Seller, Quarter-end, Chinese Industrial Profits – Talking Points
- Wall Street investors unveil the identity of Friday’s mystery block trade seller
- Chinese economic data shows robust industrial profits despite skew from pandemic base effect
- S&P 500 momentum points to more upside, with recent bullish MACD cross on the 2-hour chart
Discover what kind of forex trader you are
Asia-Pacific equity indexes may be set for a volatile week ahead as investors reallocate their portfolio holdings into the end of the quarter on Wednesday. Investors digested some upbeat Chinese economic data over the weekend after China’s National Bureau of Statistics (NBS) released industrial profits data for January and February, which showed a sharp 178.9% increase on a year-over-year basis.
The base effect caused by the onset of the Covid pandemic bears responsibility for a large chunk of the gains, but from 2019, industrial profits are still up over 70%, highlighting China’s robust economic recovery. The figures will likely bode well for industrial metals like copper and iron ore, two metals heavily imported by China to fuel stimulus-driven infrastructure spending. The powerhouse economy is set to report manufacturing PMI on Wednesday, with analysts expecting a print of 51 for March, up from 50.6 in the prior month.
Meanwhile, traders are still digging into a series of large block trades that hit the market during Friday’s Wall Street trading session. Bloomberg reported over the weekend, citing two individuals familiar with the trades, that family office Archegos Capital Management, led by Bill Hwang, was responsible for the unusual selling in US equity markets last week. The family office was reportedly forced by its bank to initiate the massive sell orders, totaling over $20 billion.
The block trades – which represent a large number of securities sold or bought at an arranged price – caused a curious bout of speculation over the weekend surrounding the seller’s identity. The market weathered the unusual activity, although the shares involved saw deep losses. Two of those equities, Discovery and ViacomCBS, closed down over 27%, the biggest losses on record for both stocks.
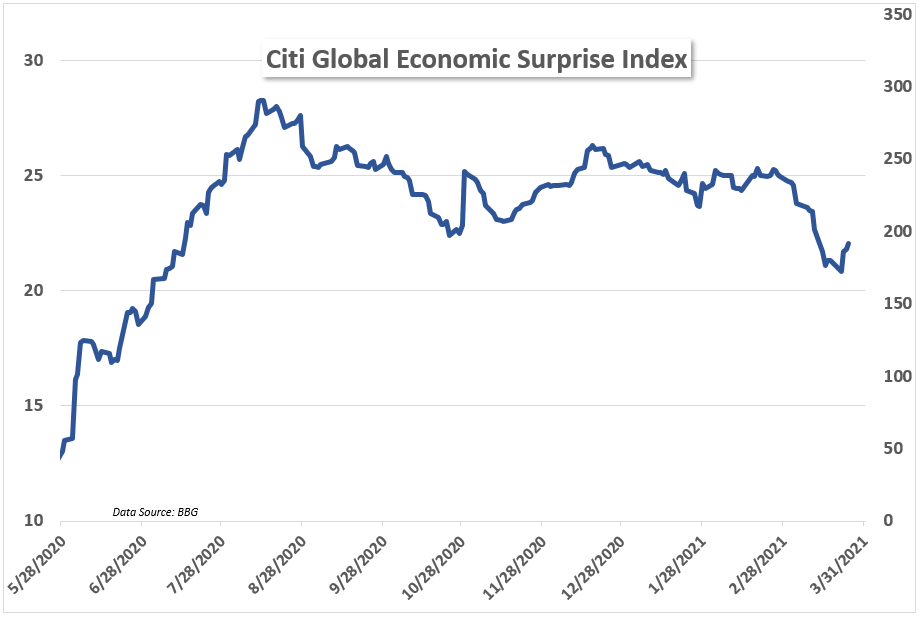
Monday’s economic calendar for the United States is rather sparse, but Federal Reserve Board of Governors member Christopher Waller will speak Monday afternoon. The Asia-Pacific region will see New Zealand report building permits for February, and Japan will release unemployment and retail sales data. The week will wrap up with the hard-hitting US Non-Farm Payrolls report for March, with economists expecting a big 655k print. Global economic prints have been improving recently, evidenced by the Citi Global Economic Surprise Index.
S&P 500 Technical Outlook
Short-term momentum in the S&P 500 index appears healthy, with a recent MACD cross above its center line on the 2-hour chart helping to drive bullish technical sentiment. Price action shows a supportive 50-day Simple Moving Average (SMA), which may help underpin prices on any short-term move lower. Moreover, with open air above the index at all-time highs, technical pressures remain largely absent.
S&P 500 Daily Chart
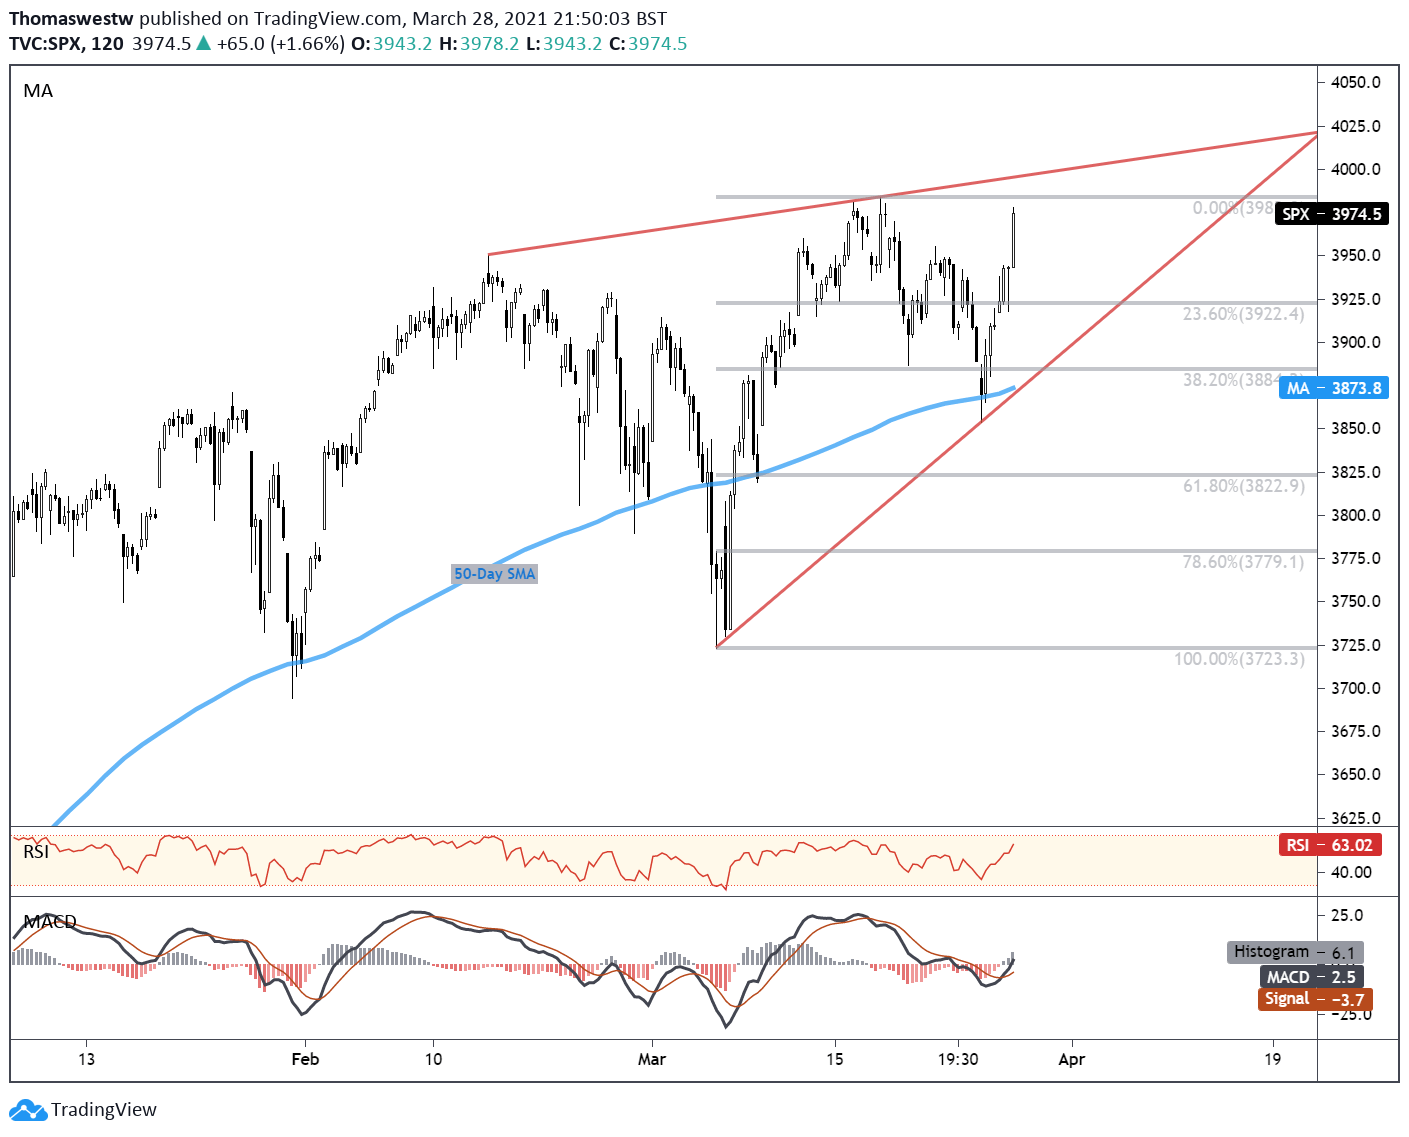
Chart created with TradingView

Recommended by Thomas Westwater
Learn how to become a more consistent forex trader
S&P 500 TRADING RESOURCES
— Written by Thomas Westwater, Analyst for DailyFX.com
To contact Thomas, use the comments section below or @FxWestwateron Twitter
Be the first to comment