

cemagraphics
Last weekend’s article warned the S&P500 (SPY) was at “Risk of Collapse” based on numerous bearish technical signals. Perhaps “collapse” isn’t the best way to describe what happened next, but the action sure wasn’t bullish. The most watched chart indicator of them all, the 200-day moving average, has been convincingly broken. As the market saying goes: “nothing good happens below the 200dma.”
I now have a minimum downside target of 4049 for the S&P500. But what about the maximum? This week’s article looks at how low it could go and what to look for to signal a reversal. Various technical analysis techniques will be applied to multiple timeframes in a top-down process which also considers the major market drivers. The aim is to provide an actionable guide with directional bias, important levels, and expectations for future price action.
S&P 500 Monthly
With two sessions left in October, the only way to nullify a bearish bar is for the S&P500 to rally back to the open at 4284 to create a “doji”. This is obviously unlikely and we might as well chalk off a negative month and focus on how the November bar could either continue or reverse.
Monthly support has now been tested in the 4130-40 area which is at the 20-month MA and the high volume node. The latter is shown by the histogram at the right of the chart which indicates 4130-40 is where the most volume has traded over the last two years. In other words, traders see this as a fair price to buy and sell. Actually, this is not a traditional support level (low volume nodes showing price rejection are better) but price is likely to gravitate to this area.
Since support has been reached, the November bar could develop a reversal either by trading an “inside bar” within the October range, or even better, briefly test lower and then recover back in the range. This would indicate a rejection of lower prices.
The other option is the November bar could continue lower. The next good monthly support is 4049 which is a low volume node and the April/May double bottom. It is also the 50% retrace of the 2022-2023 rally.
The early stages of the November bar together with clues from the lower timeframes should help signal which scenario plays out.
SPX Monthly (Tradingview)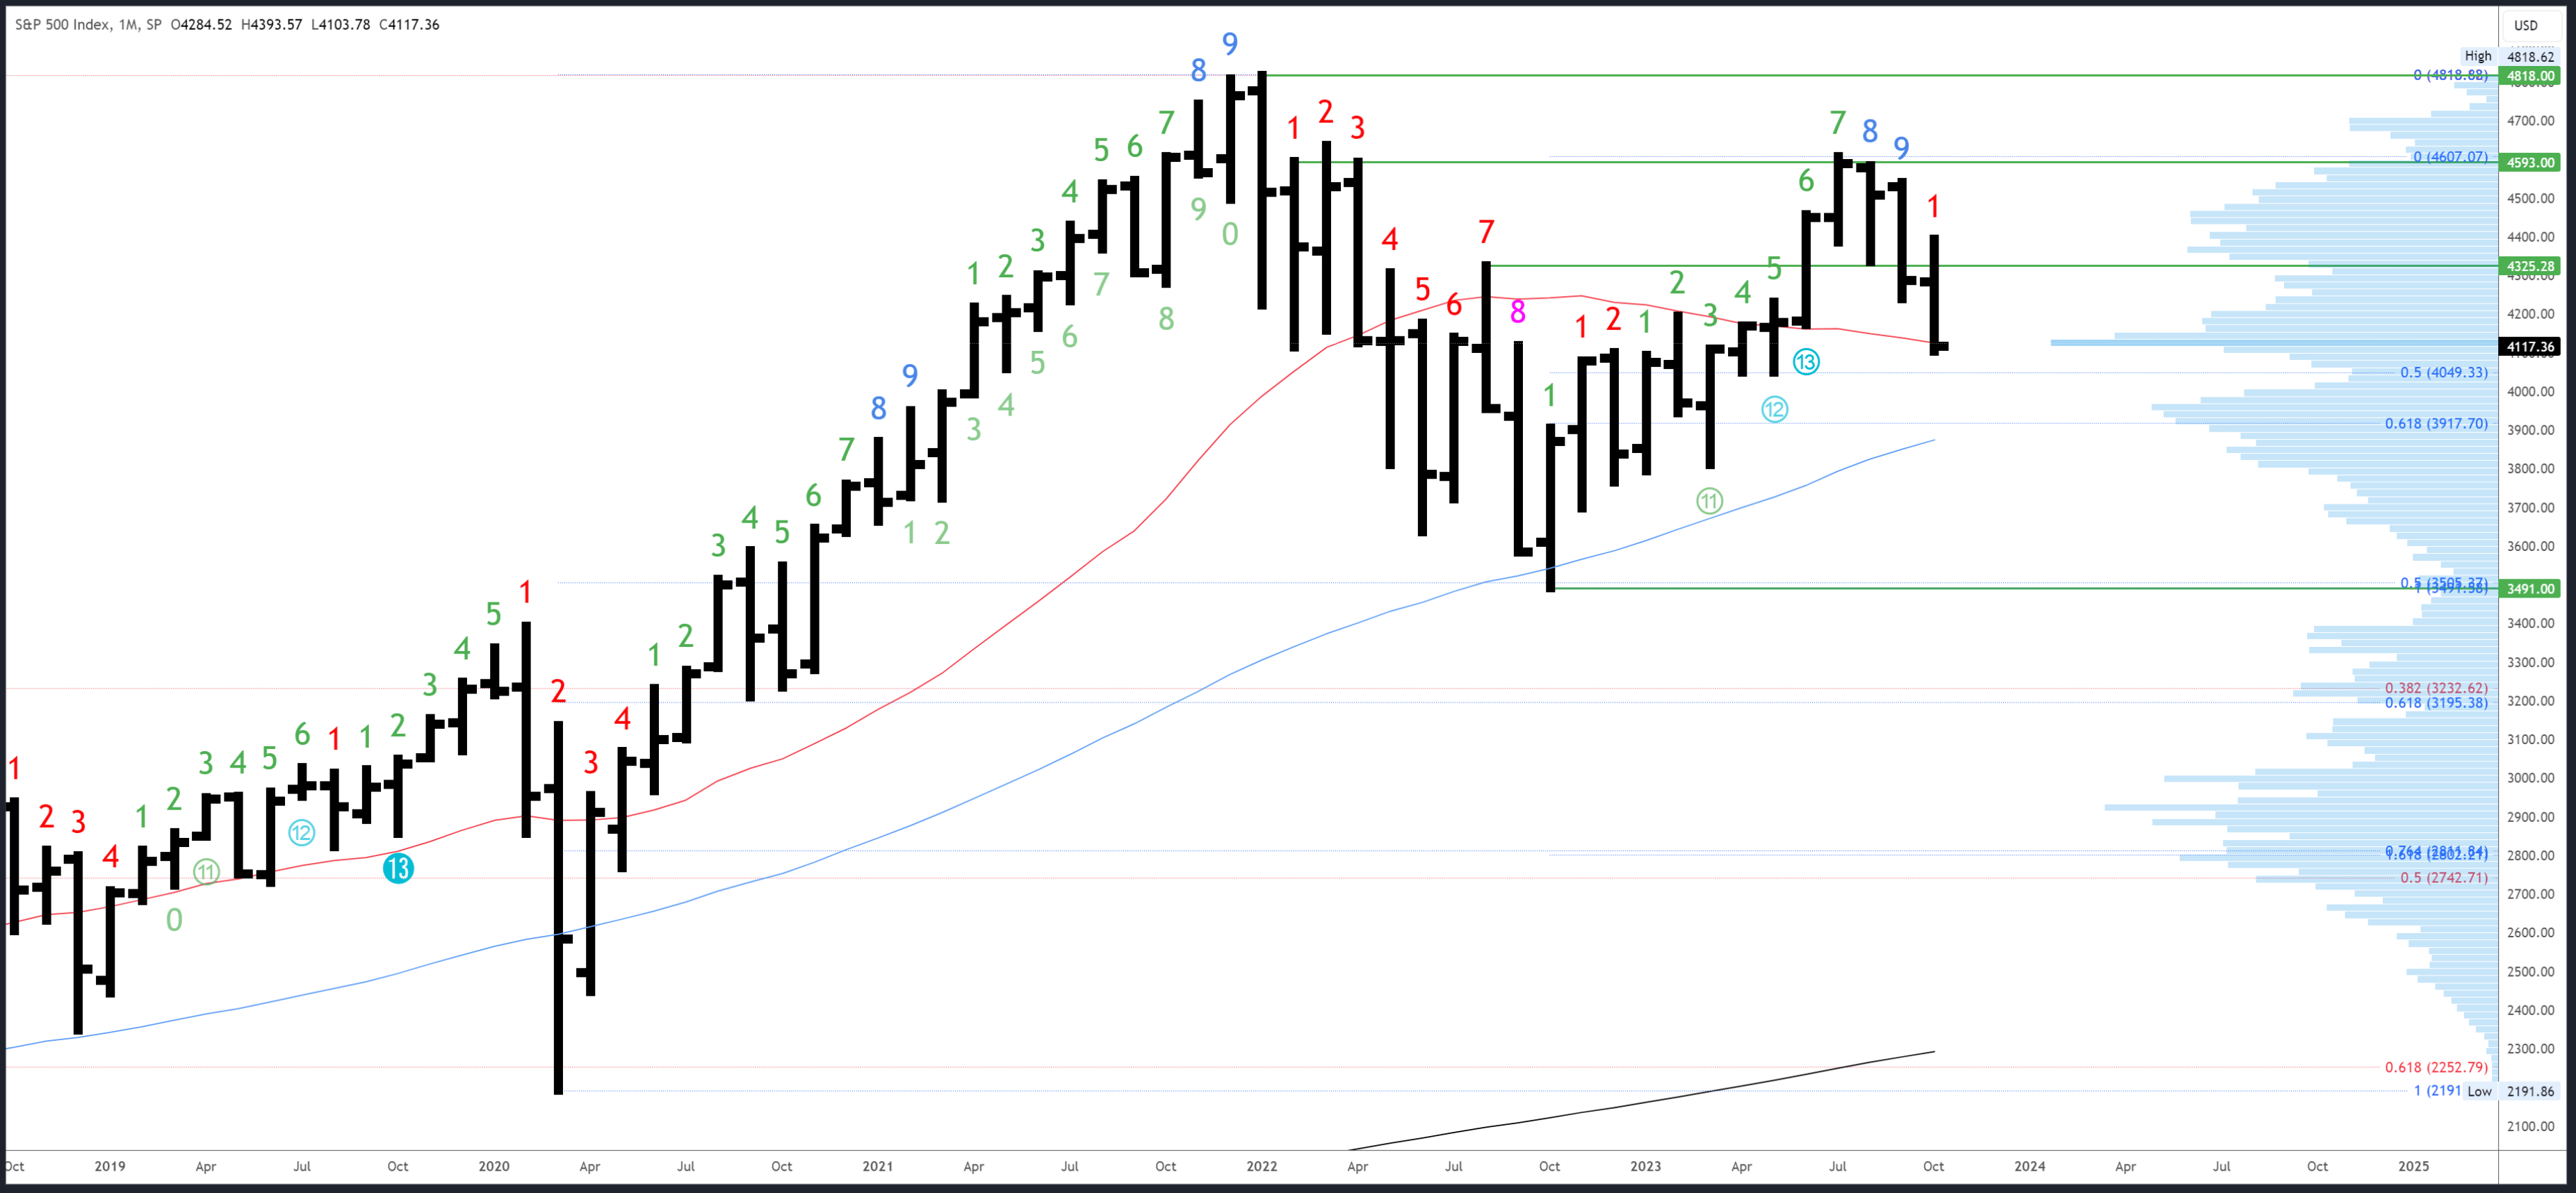
Monthly resistance is now the October high of 4393, then 4593-4607. 4325-35 may still be relevant at some point, but has been chopped through a little too much to be a strong level.
The next support is 4049 at the April-May double bottom in confluence with the 50% retrace. After that, the 50-month MA and 61.8% Fib are both around 3917.
The September bar completed a Demark upside exhaustion count. This is having a clear effect and the weakness can persist over several bars (months). November will be bar 2 (of a possible 9) in a new downside exhaustion count.
S&P 500 Weekly
The weekly channel has been convincingly broken. Indeed, the rally in the early part of this week turned back lower at its underside and I commented on Tuesday morning, “…the bounce may just be re-testing the broken channel at around 4366.”
This provides further evidence the uptrend starting at the October 2022 low is over and another phase is underway. There are a lot of possibilities for this stage ranging from a new bear market targeting 3280, to a much smaller drop ending at 4049 as part of a sideways range. At this point, I’m leaning on another option in the middle of these two extremes (for reasons too lengthy to explain here).
This week’s drop bottomed at 4103.78 which was right on the weekly TDST of 4103.98. TDST is a Demark derived support originating at the low of the preceding exhaustion count. A sustained break is unlikely without a recovery/consolidation first.
SPX Weekly (Tradingview)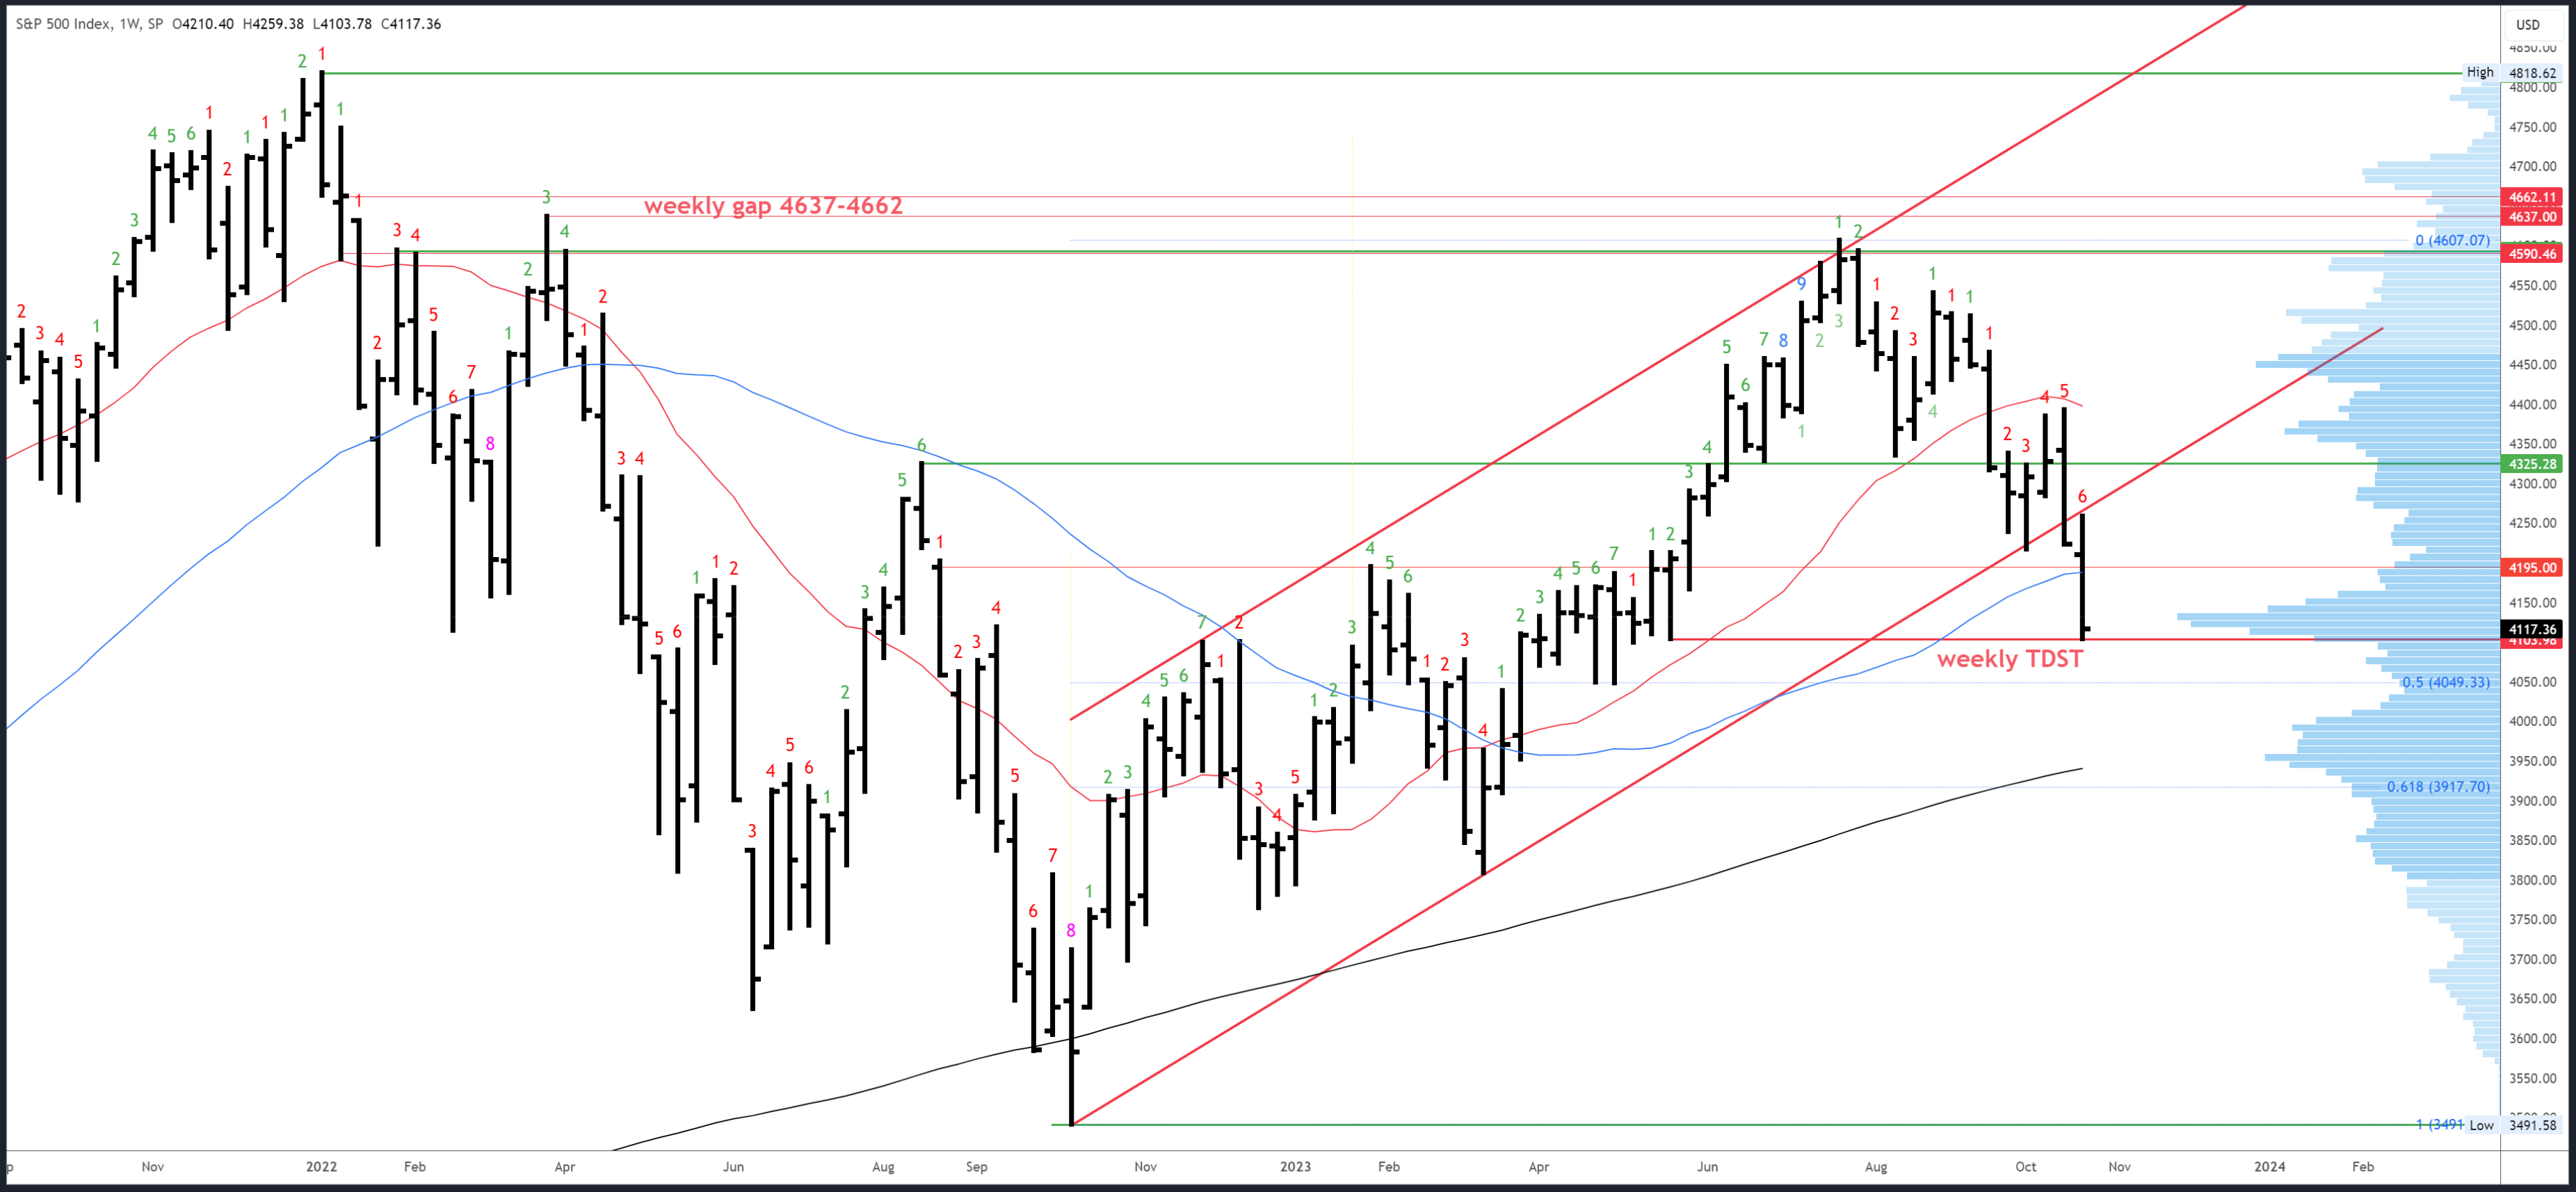
Initial resistance is now at the 50-week MA and 4195 level.
4103 is TDST support, with the 4049 monthly support below and the 200-week MA around 3950.
A downside (Demark) exhaustion count will be on bar 7 (of a possible 9) next week. Reactions generally happen on bars 8 or 9 so a potential exhaustion signal is close.
S&P 500 Daily
Friday’s weak close is likely undercut at some point. However, there are reasons to look for a bounce (not a bottom) in the 4100 area.
Channel support is in confluence with the aforementioned weekly level.
A daily Demark exhaustion signal completed on Friday. This may slow the decline but a sustainable bottom likely needs weekly exhaustion which is still developing.
The daily head and shoulders pattern is nearing its target of 4066 (not the 4093 I incorrectly labelled last week). Anyone short this pattern is likely looking to cover into weakness.
Volume is picking up but not quite at capitulation levels.
SPX Daily (Tradingview)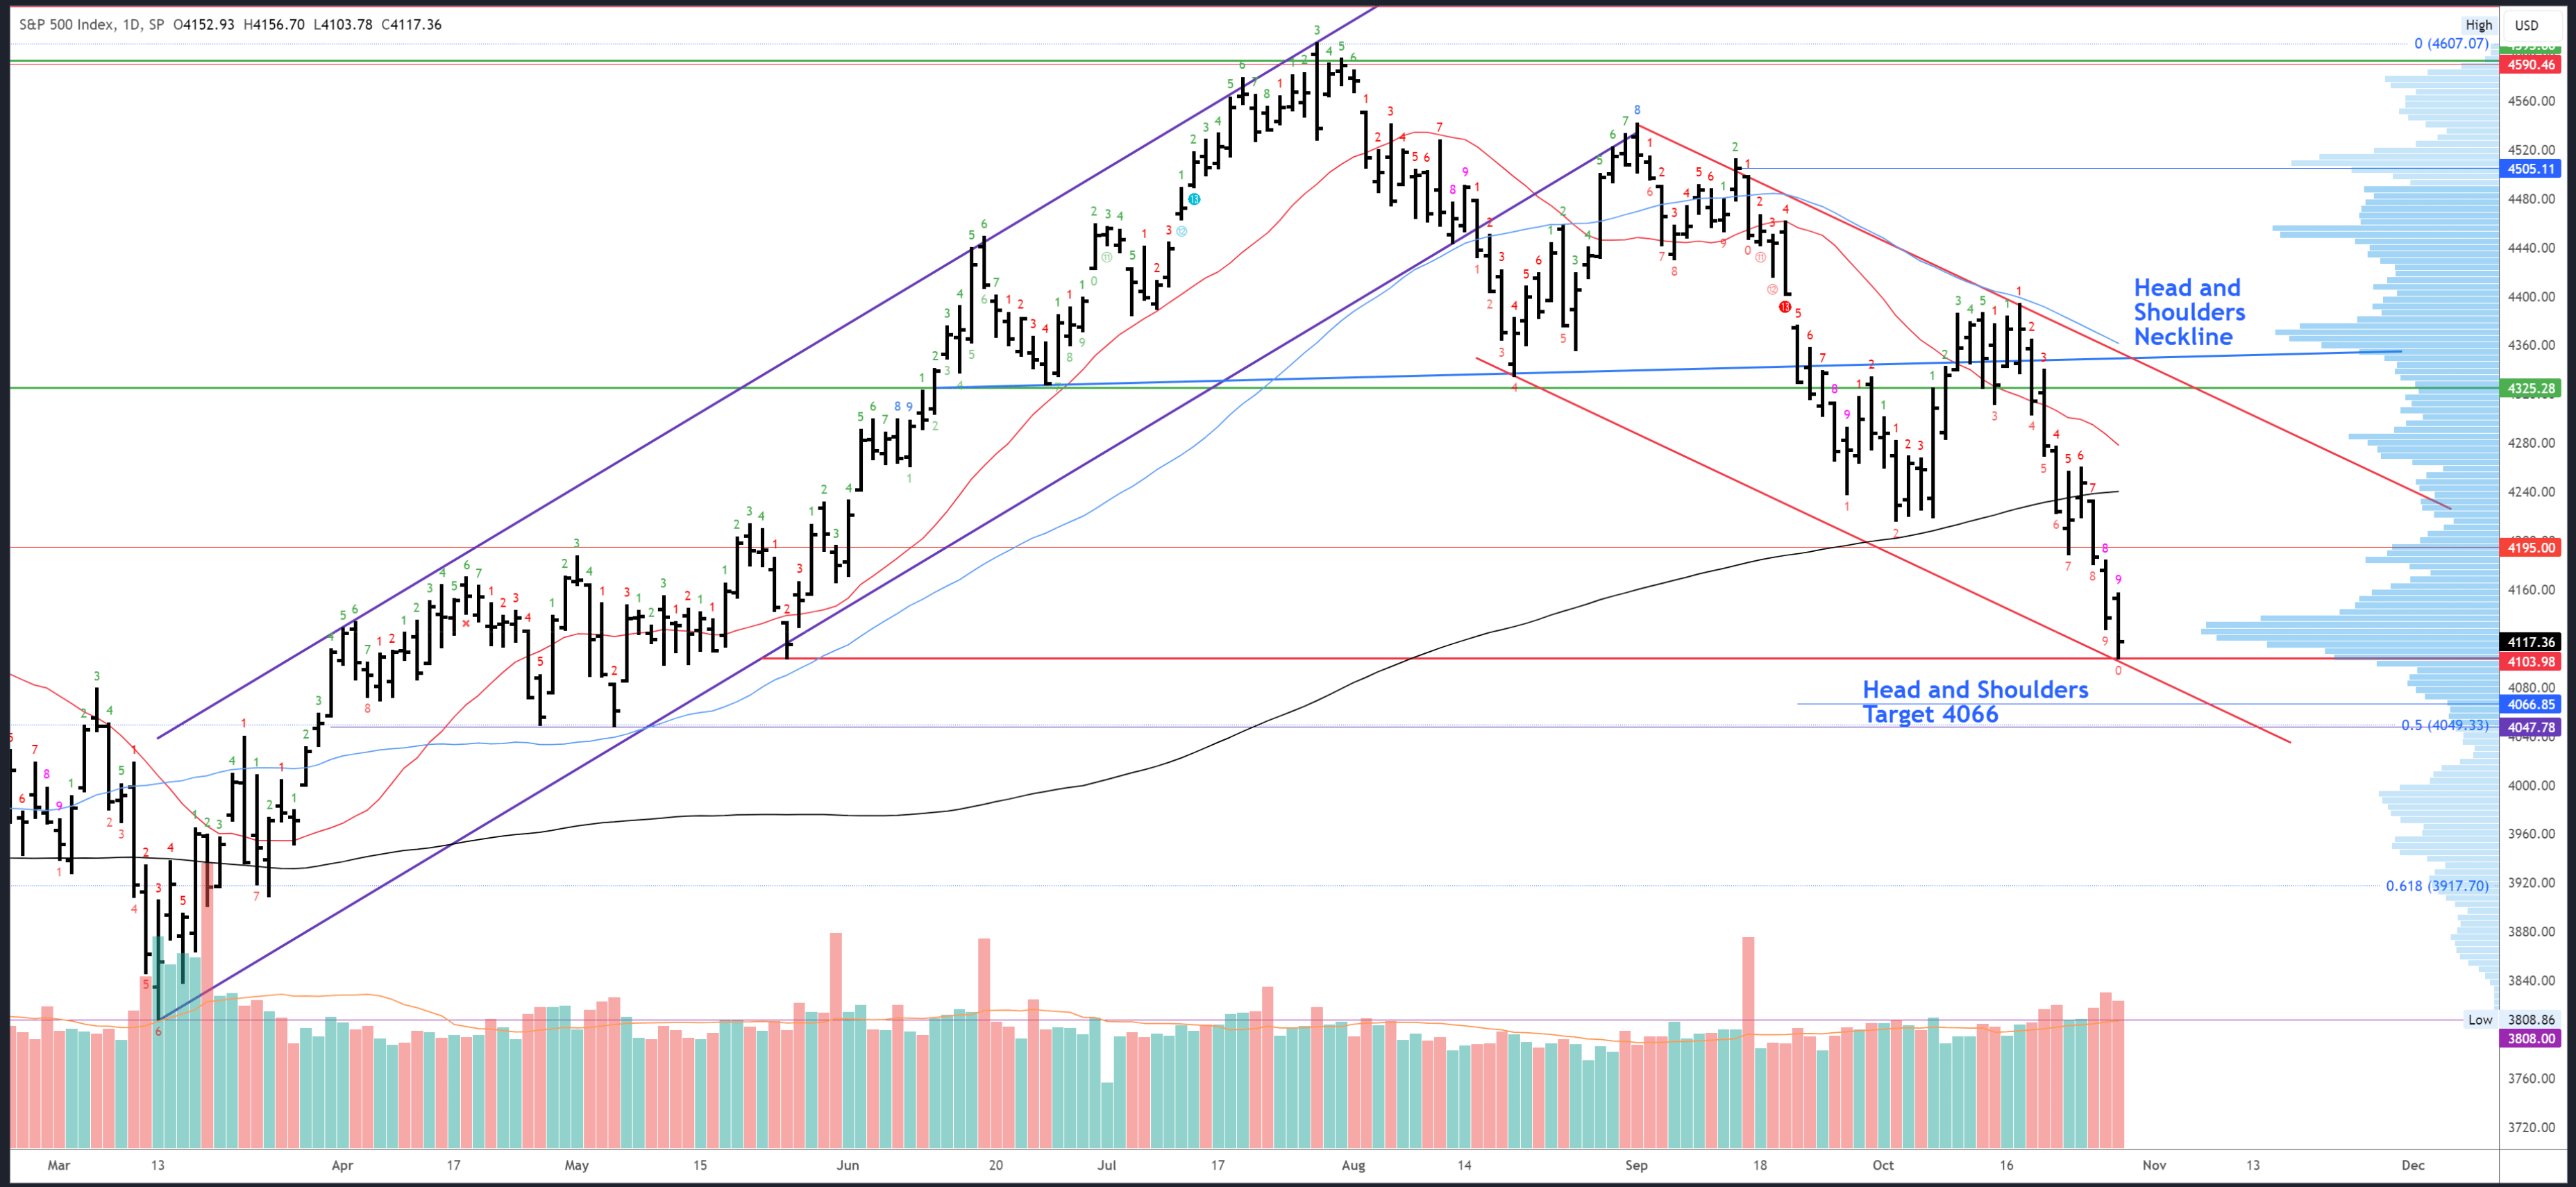
Resistance is 4186-89, then 4216 and the 200dma at 4240.
Support is 4100-103, then 4049.
As mentioned earlier. a downside (Demark) exhaustion count completed on Friday.
Drivers / Events Next Week
Next week will be a busy one.
Monday/Tuesday could see end-of-month re-balancing. If October closes near the lows, November is likely to continue the move down at some point.
The FOMC meeting is on Wednesday, with data on ISM Manufacturing and JOLTS Job Openings also due for release. Rates are almost guaranteed to be held steady despite inflation rising again, a blow-off NFP number and GDP printing 4.9% this week. So much for data dependency. Powell will at least try and sound hawkish and underline the “higher for longer” plan for rates.
Apple (AAPL) earnings are Thursday after the close. Earnings season has been positive overall with 3Q23 EPS gaining around 9% over 3Q22 figures. However, the effect has been limited and other drivers are at play.
NFP is on Friday. 182k is expected, down considerably from last month’s surprise 336k. Another upside surprise would be a real headache for the Fed.
Probable Moves Next Week(s)
Mondays have been very strong in recent weeks. Indeed, this Monday’s lower close ended a 15-day streak of higher closes on Mondays, the longest ever. Even then there was a 66 point rally.
The odds for another strong Monday look decent. With weekly and daily support levels already tested at around 4100-103, plus a daily exhaustion signal, there should be stabilization and a bounce. A strong close above 4118 should set the stage for 4156-70 into the FOMC meeting.
However, any low made next week is almost certainly not the bottom. Even if the S&P500 were to stage a multi-week rally through 4216 to as high as the 4400s, it would only set up another leg lower at a later date to a minimum of 4049.
If this large bounce is to play out it really needs to start next week. Any further bearish price action through 4100 would set up a much more direct move lower with smaller bounces from 4049 and 3917. The March low at 3808 could be the eventual target.
A collapse through 3491 to 3280 is possible, but I can’t call so far ahead, yet, and there are reasons why I think this won’t play out (the pattern on the Dow Jones (DJI) being one of them). This scenario would come to the fore if the S&P500 crashes to 3800 directly with negligible reactions at support.
Be the first to comment