

Deagreez/iStock via Getty Images
The correction of 2022 has brought a lot of volatility but also incredible buying opportunities for the world’s best dividend growth blue-chips.
Ycharts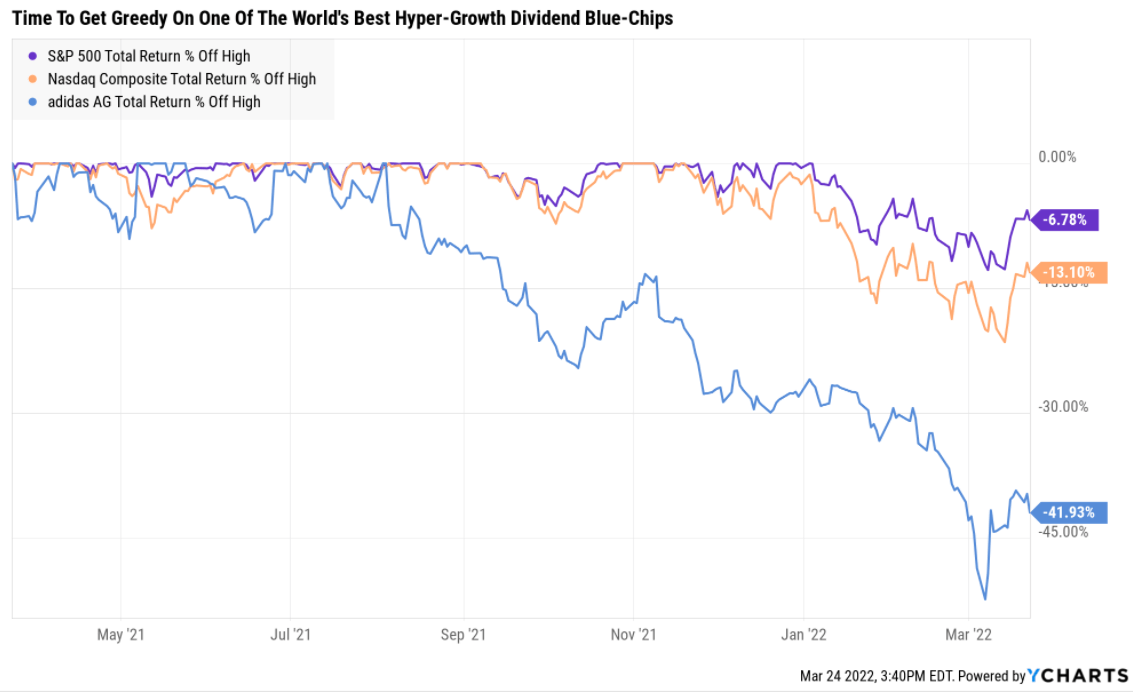
For example, while the S&P 500 never fell more than 14.6% so far in 2022, and the Nasdaq “just” 21%, adidas (OTCQX:ADDYY) plunged as much as 50%.
And it’s still in a 42% crash right now! Why should that get your attention?
ADDYY Historical Returns Since 2007
(Source: Portfolio Visualizer Premium)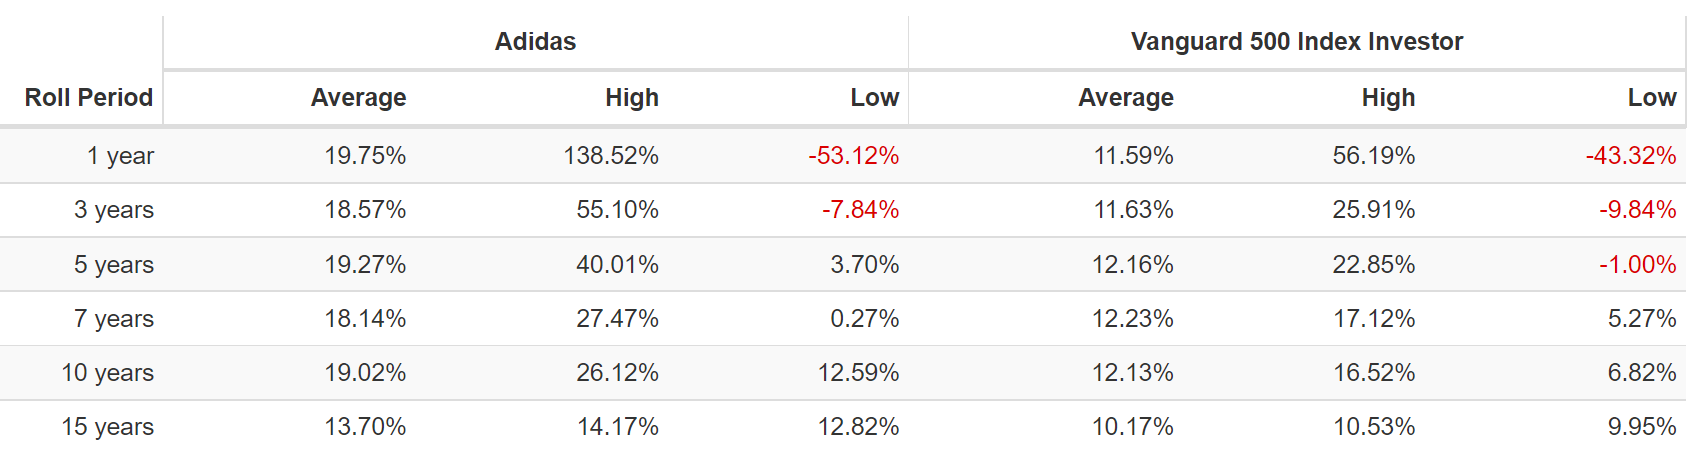
adidas has historically delivered 18% to 19% long-term returns, and from bear markets, like this one, those can soar to 26% annually for the next decade.
- 10X your money in 10 years
- Buffett-like returns from a blue-chip bargain hiding in plain sight
OK, that’s all well and good but maybe the reason for that crash is that the company’s growth prospects have evaporated? Maybe its safety and quality are collapsing and the market is correctly warning that adidas is a value trap to ignore like the plague?
Fundamental Risk Stable And Low According To The Bond Market
(Source: FactSet Research Terminal)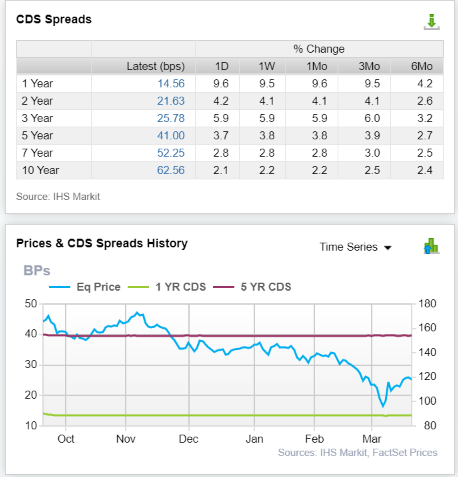
- we’ll talk about what CDS means later in this article
- but basically CDS = bankruptcy risk (Buffett’s definition of fundamental risk)
- and ADDY’s price collapse is NOT justified by fundamental risk
Ok, so maybe adidas doesn’t have one foot in the grave, but perhaps the growth outlook has collapsed?
| Investment Strategy | Yield | LT Consensus Growth | LT Consensus Total Return Potential | Long-Term Risk-Adjusted Expected Return | Long-Term Inflation And Risk-Adjusted Expected Returns | Years To Double Your Inflation-Adjusted Wealth |
10 Year Inflation And Risk-Adjusted Return |
| adidas (Analyst Consensus) | 1.6% | 27.90% | 29.5% | 20.7% | 18.5% | 3.9 | 5.45 |
| adidas (Management Guidance) | 1.6% | 17% | 18.6% | 13.0% | 10.8% | 6.6 | 2.80 |
| Europe | 2.6% | 12.8% | 15.4% | 10.7% | 8.6% | 8.4 | 2.27 |
| Value | 2.1% | 12.1% | 14.1% | 9.9% | 7.7% | 9.3 | 2.10 |
| High-Yield | 2.8% | 11.3% | 14.1% | 9.9% | 7.7% | 9.4 | 2.10 |
| High-Yield + Growth | 1.7% | 11.0% | 12.7% | 8.9% | 6.7% | 10.8 | 1.91 |
| Stanley Black & Decker | 2.1% | 10.0% | 12.1% | 8.5% | 6.3% | 11.4 | 1.84 |
| Safe Midstream + Growth | 3.3% | 8.5% | 11.8% | 8.3% | 6.1% | 11.8 | 1.80 |
| Safe Midstream | 5.5% | 6.0% | 11.5% | 8.1% | 5.9% | 12.3 | 1.77 |
| Nasdaq (Growth) | 0.8% | 10.7% | 11.5% | 8.1% | 5.9% | 12.3 | 1.77 |
| Dividend Aristocrats | 2.2% | 8.9% | 11.1% | 7.8% | 5.6% | 12.9 | 1.72 |
| REITs + Growth | 1.8% | 8.9% | 10.6% | 7.4% | 5.2% | 13.7 | 1.67 |
| S&P 500 | 1.4% | 8.5% | 9.9% | 7.0% | 4.8% | 15.1 | 1.59 |
| Realty Income | 4.6% | 5.2% | 9.8% | 6.9% | 4.7% | 15.4 | 1.58 |
| Dividend Growth | 1.6% | 8.0% | 9.6% | 6.7% | 4.5% | 15.9 | 1.56 |
| REITs | 2.9% | 6.5% | 9.4% | 6.6% | 4.4% | 16.4 | 1.54 |
| 60/40 Retirement Portfolio | 2.1% | 5.1% | 7.2% | 5.1% | 2.9% | 24.9 | 1.33 |
| 10-Year US Treasury | 2.3% | 0.0% | 2.3% | 1.6% | -0.5% | -131.1 | 0.95 |
(Source: Morningstar, FactSet, YCharts)
Management is guiding for historical returns to continue and analysts are even more optimistic.
Either way, investors are potentially looking at far better returns than the S&P, 500, aristocrats, Nasdaq, and just about any major investing strategy on Wall Street.
- management return guidance = approximately doubling your money every 6.6 years
- on a risk-adjusted basis!
What if ADDYY’s short-term growth outlook has fallen off a cliff? Maybe the reason for the stock collapse is the market doesn’t want to own “dead money” for the next 2 to 3 years?
adidas 2024 Conservative Consensus Return Potential (23 PE)
(Source: FAST Graphs, FactSet Research)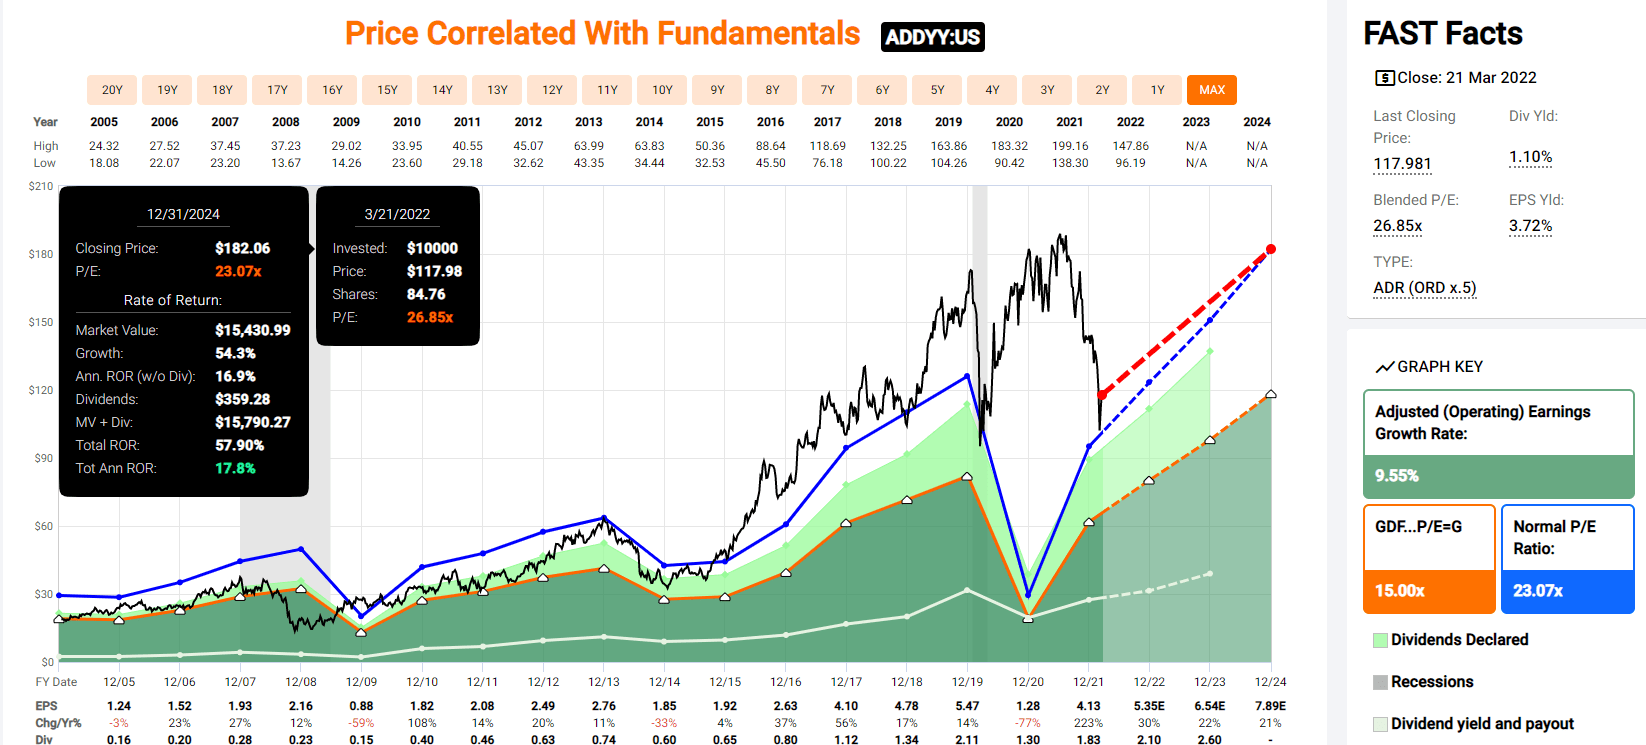
adidas Bullish 2024 Consensus Forecast
(Source: FAST Graphs, FactSet Research)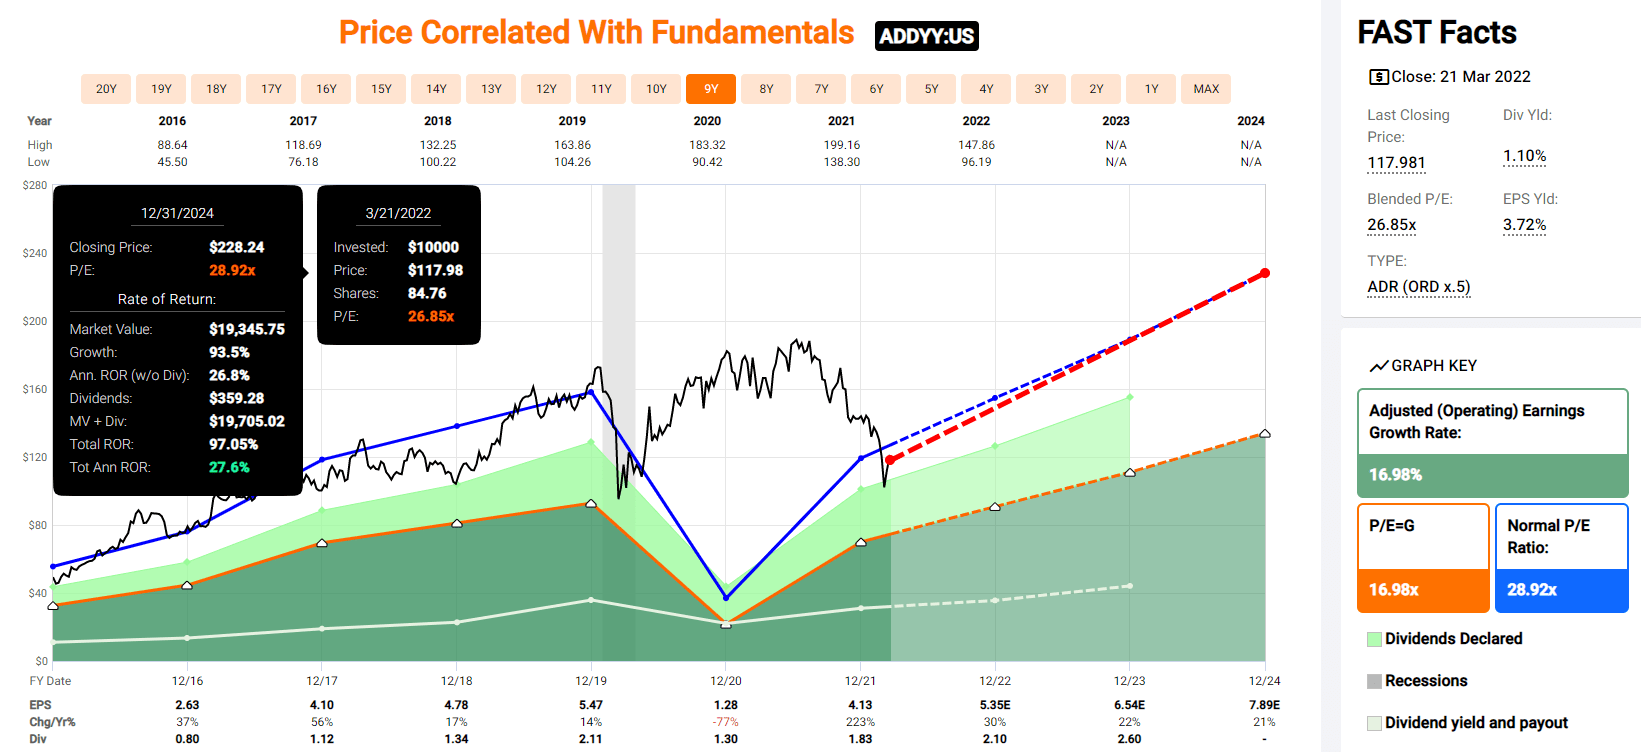
ADDYY could potentially deliver 100% returns through 2024, or 28% annually.
adidas 2027 Conservative Consensus Return Potential
(Source: FAST Graphs, FactSet Research)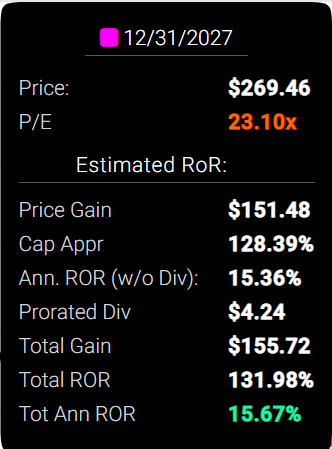
- about 4X the S&P 500 consensus
adidas 2027 Bullish Consensus Return Potential
(Source: FAST Graphs, FactSet Research)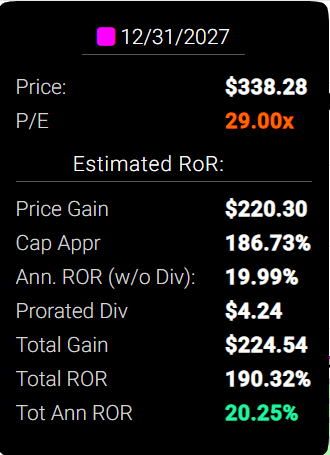
(Source: FAST Graphs, FactSet Research)
If ADDYY’s PE expands to the upper end of historical fair value (thanks to growth that’s 2X its historical norm) that could nearly triple your money over the next five years.
- literally, Buffett-like returns
- about 5X the S&P 500 consensus
Basically, there is no fundamental reason for ADDYY to have fallen this far, other than one.
adidas was about 40% overvalued and has now overshot due to the market correction, and is about 20% undervalued.
Or to put it another way… ADDYY is now a classic Buffett-style “wonderful company at fair price”.
In fact, as I’ll show you right now, there are three reasons I consider adidas a “wonderful company at a wonderful price”.
One that I just bought for my portfolio and you might want to do the same.
Why? Because as Buffett once said, “Be greedy when others are fearful.”
Well, there are three reasons why it’s time to bend it like Buffett and be greedy on adidas.
Reason One: One Of The World’s Greatest Companies
The Dividend King’s overall quality scores are based on a 241 point model that includes:
-
dividend safety
-
balance sheet strength
-
credit ratings
-
credit default swap medium-term bankruptcy risk data
-
short and long-term bankruptcy risk
-
accounting and corporate fraud risk
-
profitability and business model
-
growth consensus estimates
-
management growth guidance
-
historical earnings growth rates
-
historical cash flow growth rates
-
historical dividend growth rates
-
historical sales growth rates
-
cost of capital
-
long-term risk-management scores from MSCI, Morningstar, FactSet, S&P, Reuters’/Refinitiv, and Just Capital
-
management quality
-
dividend friendly corporate culture/income dependability
-
long-term total returns (a Ben Graham sign of quality)
-
analyst consensus long-term return potential
It actually includes over 1,000 metrics if you count everything factored in by 12 rating agencies we use to assess fundamental risk.
How do we know that our safety and quality model works well?
During the two worst recessions in 75 years, our safety model 87% of blue-chip dividend cuts, the ultimate baptism by fire for any dividend safety model.
How does adidas score on one of the world’s most comprehensive and accurate safety and quality models?
adidas Dividend Safety
| Rating | Dividend Kings Safety Score (149 Point Safety Model) | Approximate Dividend Cut Risk (Average Recession) |
Approximate Dividend Cut Risk In Pandemic Level Recession |
| 1 – unsafe | 0% to 20% | over 4% | 16+% |
| 2- below average | 21% to 40% | over 2% | 8% to 16% |
| 3 – average | 41% to 60% | 2% | 4% to 8% |
| 4 – safe | 61% to 80% | 1% | 2% to 4% |
| 5- very safe | 81% to 100% | 0.5% | 1% to 2% |
| ADDYY | 91% | 0.5% | 1.60% |
| Risk Rating | Low Risk (84th industry percentile consensus) | A+ stable outlook credit rating 0.0.6% 30-year bankruptcy risk | 20% OR LESS Max Risk Cap Recommendation |
Long-Term Dependability
| Company | DK Long-Term Dependability Score | Interpretation | Points |
| Non-Dependable Companies | 21% or below | Poor Dependability | 1 |
| Low Dependability Companies | 22% to 60% | Below-Average Dependability | 2 |
| S&P 500/Industry Average | 61% (58% to 70% range) | Average Dependability | 3 |
| Above-Average | 71% to 80% | Very Dependable | 4 |
| Very Good | 81% or higher | Exceptional Dependability | 5 |
| ADDYY | 96% | Exceptional Dependability | 5 |
Overall Quality
| ADDYY | Final Score | Rating |
| Safety | 91% | 5/5 very safe |
| Business Model | 80% | 3/3 wide moat |
| Dependability | 96% | 5/5 exceptional |
| Total | 92% | 13/13 Ultra SWAN |
| Risk Rating | 3/3 Low Risk | |
| 20% OR LESS Max Risk Cap Rec |
5% Margin of Safety For A Potentially Good Buy |
adidas: 31st Highest Quality Master List Company (Out of 508) = 94th Percentile
The DK 500 Master List includes the world’s highest quality companies including:
-
All dividend champions
-
All dividend aristocrats
-
All dividend kings
-
All global aristocrats (such as BTI, ENB, and NVS)
-
All 13/13 Ultra Swans (as close to perfect quality as exists on Wall Street)
- 48 of the world’s best growth stocks (on its way to 100)
adidas’s 92% quality score means its similar in quality to such blue-chips as
- Allianz SE (OTCPK:ALIZY)
- Automatic Data Processing (ADP) – dividend aristocrat
- Amazon (AMZN)
- 3M (MMM) – dividend king
- Lowe’s (LOW) – dividend king
- Apple (AAPL)
- Bank of Nova Scotia (BNS)
- V.F. Corp (VFC) – dividend king
Even among the most elite companies on earth, adidas is higher quality than 94% of them.
Why adidas Is One Of The Best Hyper-Growth Dividend Blue-Chips On Earth
adidas was founded in 1920 in Germany and is the world’s second-largest sports apparel maker behind Nike (NKE).
- built to last
- survived dozens of recessions, depressions, WWII, the cold war, and economic and market crises
adidas is so much more than shoes.
- 53% of sales from shoes
- 41% apparel
- 6% gear
- 6% of sales from Germany
- 37% of sales from Europe and the Middle East
- 23% from the US
- 40% from the rest of the world, including China.
adidas believes that North America could become its largest and most lucrative market eventually.
We think adidas is a leader in athletic and “athleisure” apparel with a narrow-moat rating based on an intangible brand asset. While sales declined 16% in 2020 due to the COVID-19 and there have been some supply chain disruptions in 2021, we think adidas is poised to meet many of the goals of its five-year Own the Game plan. For example, its e-commerce, now available in more than 50 countries, grew 53% in 2020 and generated more than EUR 4 billion in sales. adidas expects its e-commerce to rise to EUR 8 billion-EUR 9 billion in 2025, which we think is achievable. Further, we think the firm’s new sportswear offerings and plans to improve its position in key categories like running and outdoor will be successful…” – Morningstar (emphasis added)
Own The Game: adidas’ Ambitious 5-Year Growth Plan
Management believes it can grow at 8% to 10% through 2025 compared to 6% sales growth for the industry.
adidas estimates the global sports apparel market will increase by $110 billion to $440 billion in size by 2025.
- 5.9% CAGR
- 4% to 6% long-term growth for the industry
- adidas expects 9% sales growth indicating strong market share gains expected
Management expects to more than double its online sales over 4 years, representing over 19% annual growth.
By 2025 management expects DTC to rise from 35% of sales to 50% of sales.
- DTC cuts out the middlemen (retailers) and boosts profitability
adidas believes that North America, Europe, and China represent its best long-term growth drivers.
- DTC is growing 3X faster than traditional retail
- by 2025 analysts think 40% of sports apparel sales will be DTC
ADDYY plans to expand its gross margin to industry-leading 53% to 55% by 2025.
- gross margin is revenue – the cost of goods
Operating margins are expected to rise to 12% to 14%.
- industry median 5.2%
- up from 6.5% in 2018
Net income is expected to rise 16% to 18% CAGR through 2025.
- analysts expect buybacks to boost this to 21.4% CAGR
Management is planning to spend about $1.1 billion more in marketing annually through 2025, representing approximately 1% of annual sales.
- $220 million per year
- focused on brand building and DTC
- more targeted campaigns focused on content creation, influencers, and major product launches
- which increases consumer data and helps minimize discounting
- and thus increase both market share and margins
adidas plans to spend 3% to 4% of sales on growing its business.
Payout ratio policy: 35% to 50% of operating income.
Management expects to return $9 to $10 billion to shareholders via dividends and buybacks through 2025.
- about 2X the previous 5 years
- not counting Rebook sales
adidas Credit Ratings
| Rating Agency | Credit Rating | 30-Year Default/Bankruptcy Risk | Chance of Losing 100% Of Your Investment 1 In |
| S&P | A+ stable | 0.60% | 166.7 |
| Moody’s | A2 (A equivalent) Stable | 0.66% | 151.5 |
| Consensus | A+ stable | 0.63% | 158.7 |
(Sources: S&P, Moody’s)
Rating agencies estimate the risk of losing all your money in adidas over the next 30 years at 1 in 159.
adidas Leverage Consensus Forecast
| Year | Debt/EBITDA | Net Debt/EBITDA (3.0 Or Less Safe According To Credit Rating Agencies) |
Interest Coverage (8+ Safe) |
| 2020 | 1.50 | -0.39 | 3.50 |
| 2021 | 0.80 | -0.42 | 12.98 |
| 2022 | 0.66 | -0.11 | 16.74 |
| 2023 | 0.57 | -0.12 | 20.16 |
| 2024 | 0.51 | -0.29 | 23.46 |
| 2025 | NA | -0.24 | 24.87 |
| Annualized Change | -23.67% | -9.01% | 48.00% |
(Source: FactSet Research Terminal)
adidas has had a net cash balance sheet for a decade and management says this is going to continue in the future.
adidas Bond Profile
- $10.5 billion in liquidity
- $1.3 billion in net cash
- well staggered debt maturities
- 81% unsecured bonds (high financial flexibility)
- bond investors are so confident in ADDYY’s long-term growth plan they are willing to lend to it for 13.5 years at 1.66%
- 3.99% average borrowing cost
- 1.81% inflation-adjusted borrowing costs vs 24.4% returns on capital
adidas Credit Default Swaps: The Bond Market’s Real-Time Fundamental Risk Assessment
FactSet Research Terminal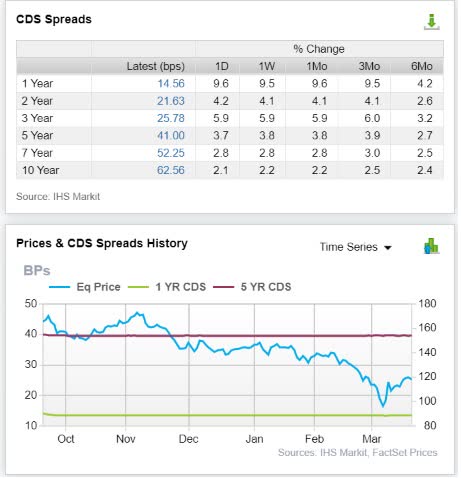
Credit default Swaps are insurance policies bond investors take out against default.
- the bond market’s real-time estimate of fundamental risk
- very useful when headlines are scary and stock prices are crashing
- ADDYY’s CDS are consistent with its credit ratings
- and relatively stable since September 2021
- when the stock price is crashing but the fundamental risk remains stable you can buy with more confidence
- analysts, rating agencies, and the bond market are all confirming ADDYY’s investment thesis remains intact
adidas Profitability: Wall Street’s Favorite Quality Proxy
adidas’ historical profitability is in the top 20% of peers.
adidas Trailing 12-Month Profitability Vs Peers
| Metric | Industry Percentile | Major Apparel Companies More Profitable Than ADDYY (Out Of 1,075) |
| Operating Margin | 67.02 | 355 |
| Net Margin | 75.38 | 265 |
| Return On Equity | 90.80 | 99 |
| Return On Assets | 82.05 | 193 |
| Return On Capital | 85.08 | 160 |
| Average | 80.07 | 214 |
(Source: Gurufocus Premium)
Despite numerous challenges to its supply chain and rising input costs, adidas maintained profitability in the top 20% of peers over the last year.
adidas’ profitability has been relatively stable or improving for the last 20 years, confirming a wide and stable moat.
adidas Profit Margin Consensus Forecast
| Year | FCF Margin | EBITDA Margin | EBIT (Operating) Margin | Net Margin | Return On Capital Expansion |
Return On Capital Forecast |
| 2020 | 4.8% | 10.6% | 3.8% | 2.2% | 1.48 | |
| 2021 | 11.7% | 14.8% | 9.4% | 7.0% | TTM ROC | 34.50% |
| 2022 | 8.2% | 15.8% | 10.8% | 7.7% | Latest ROC | NA |
| 2023 | 8.3% | 16.6% | 11.7% | 8.4% | 2026 ROC | 51.03% |
| 2024 | 8.4% | 17.3% | 12.5% | 9.0% | 2026 ROC | NA |
| 2025 | 7.8% | 17.8% | 13.2% | 9.6% | Average | 51.03% |
| 2026 | 8.6% | 19.1% | 13.8% | 9.8% | Industry Median | 9.76% |
| Annualized Growth | 10.27% | 10.18% | 24.13% | 28.66% | ADDYY/Peers | 5.23 |
| Vs S&P | 3.50 |
(Source: FactSet Research Terminal)
adidas’ profitability is expected to remain stable after recovering from the pandemic.
Returns on capital or ROC is Joel Greenblatt’s gold standard proxy for quality and moatiness. ROC = pre-tax profit/operating capital (the money it takes to run the business).
ADDYY’s ROC is expected to recover to 51% by 2026, similar to the 13-year median of 53%.
- for every $1 it takes to run the business, ADDYY historically generates $0.53 in annual pre-tax profit
- average ADDYY investment pays for itself in about two years
- S&P 500’s average in 2021 was 14.6% (average investment pays for itself in 7 years)
- according to one of the greatest investors in history, ADDYY is about 3.5X higher quality than the S&P 500
- and about 5X higher quality than its median peer
For two decades ADDYY’s ROC has been trending higher at 0.8% annually over time.
- further confirmation of its wide and stable moat
adidas Dividend Consensus Forecast
| Year | Dividend Consensus | EPS/Share Consensus | Payout Ratio | Retained (Post-Dividend) Earnings | Buyback Potential | Debt Repayment Potential |
| 2021 | $1.82 | $4.13 | 44.1% | $887 | 2.11% | 32.2% |
| 2022 | $2.13 | $5.44 | 39.2% | $1,271 | 3.03% | 46.1% |
| 2023 | $2.58 | $6.54 | 39.4% | $1,521 | 3.62% | 55.1% |
| 2024 | $2.98 | $7.77 | 38.4% | $1,839 | 4.38% | 66.6% |
| 2025 | $3.17 | $8.97 | 35.3% | $2,227 | 5.31% | 80.6% |
| 2026 | $3.74 | $9.97 | 37.5% | $2,392 | 5.70% | NA |
| Total 2021 Through 2026 | $16.42 | $42.82 | 38.3% | $10,137.60 | 24.16% | 367.84% |
| Annualized Rate | 15.49% | 19.27% | -3.17% | 21.95% | 21.95% | 25.80% |
(Source: FactSet Research Terminal)
Credit rating agencies consider 60% a safe payout ratio in this industry.
- 35% to 50% of operating earnings is management’s policy
Analysts expect a 38% average payout ratio through 2026.
Allowing adidas to retain over $10 billion in post-dividend earnings.
Enough to pay off 4X its existing debt or buy back as much as 24% of shares at current valuations.
adidas Buyback Consensus Forecast
| Year | Consensus Buybacks ($ Millions) | % Of Shares (At Current Valuations) | Market Cap |
| 2022 | $1,856.0 | 4.4% | $41,955 |
| 2023 | $600.0 | 1.4% | $41,955 |
| 2024 | $552.0 | 1.3% | $41,955 |
| Total 2022-2024 | $3,008.00 | 7.2% | $41,955 |
| Annualized Rate | 2.46% | Average Annual Buybacks | $1,002.67 |
(Source: FactSet Research Terminal)
adidas has been buying back stock consistently since 2015, at a net rate of 1.2% annually.
Analysts, based on management guidance, think that this net buyback rate will approximately double in the future.
| Time Frame (Years) | Net Buyback Rate | Shares Remaining | Net Shares Repurchased |
| 5 | 1.2% | 94.09% | 5.91% |
| 10 | 1.2% | 88.54% | 11.46% |
| 15 | 1.2% | 83.31% | 16.69% |
| 20 | 1.2% | 78.39% | 21.61% |
| 25 | 1.2% | 73.76% | 26.24% |
| 30 | 1.2% | 69.40% | 30.60% |
| 35 | 1.2% | 65.31% | 34.69% |
| 40 | 1.2% | 61.45% | 38.55% |
| 45 | 1.2% | 57.82% | 42.18% |
| 50 | 1.2% | 54.41% | 45.59% |
| 55 | 1.2% | 51.19% | 48.81% |
| 60 | 1.2% | 48.17% | 51.83% |
| 65 | 1.2% | 45.33% | 54.67% |
| 70 | 1.2% | 42.65% | 57.35% |
| 75 | 1.2% | 40.13% | 59.87% |
| 80 | 1.2% | 37.76% | 62.24% |
| 85 | 1.2% | 35.53% | 64.47% |
| 90 | 1.2% | 33.43% | 66.57% |
| 95 | 1.2% | 31.46% | 68.54% |
| 100 | 1.2% | 29.60% | 70.40% |
(Source: FactSet Research Terminal)
1.2% annual buybacks (the historical rate) might not sound like much. But over the decades it can have a powerful effect on increasing your ownership in adidas.
And what if ADDYY does double its buyback growth rate?
| Time Frame (Years) | Net Buyback Rate | Shares Remaining | Net Shares Repurchased |
| 5 | 2.5% | 88.29% | 11.71% |
| 10 | 2.5% | 77.95% | 22.05% |
| 15 | 2.5% | 68.82% | 31.18% |
| 20 | 2.5% | 60.77% | 39.23% |
| 25 | 2.5% | 53.65% | 46.35% |
| 30 | 2.5% | 47.37% | 52.63% |
| 35 | 2.5% | 41.82% | 58.18% |
| 40 | 2.5% | 36.92% | 63.08% |
| 45 | 2.5% | 32.60% | 67.40% |
| 50 | 2.5% | 28.78% | 71.22% |
| 55 | 2.5% | 25.41% | 74.59% |
| 60 | 2.5% | 22.44% | 77.56% |
| 65 | 2.5% | 19.81% | 80.19% |
| 70 | 2.5% | 17.49% | 82.51% |
| 75 | 2.5% | 15.44% | 84.56% |
| 80 | 2.5% | 13.63% | 86.37% |
| 85 | 2.5% | 12.04% | 87.96% |
| 90 | 2.5% | 10.63% | 89.37% |
| 95 | 2.5% | 9.38% | 90.62% |
| 100 | 2.5% | 8.28% | 91.72% |
(Source: FactSet Research Terminal)
Then over the next 10 years, the company could buy back 22% of its shares and over the next 30 cut its share count in half.
Or to put it another way, in the future each share of ADDYY you own could present more than 2X the ownership stake in the company it does today.
And this is a company that’s not dying like the recent crash might have you believe but growing like a weed.
Reason Two: Exceptional Growth Potential For As Far As The Eye Can See
We’ve already seen how ADDYY has been executing brilliantly on direct-to-consumer and has a reasonable and prudent plan to deliver 17% long-term earnings growth (not counting buybacks).
Here’s what analysts expect in just the next few years.
adidas Medium-Term Growth Consensus Forecast
| Year | Sales | Free Cash Flow | EBITDA | EBIT (Operating Income) | Net Income |
| 2020 | $23,607 | $1,133 | $2,514 | $893 | $510 |
| 2021 | $23,454 | $2,737 | $3,462 | $2,194 | $1,648 |
| 2022 | $26,516 | $2,185 | $4,186 | $2,863 | $2,052 |
| 2023 | $28,889 | $2,384 | $4,804 | $3,387 | $2,422 |
| 2024 | $31,426 | $2,653 | $5,429 | $3,941 | $2,834 |
| 2025 | $34,170 | $2,658 | $6,091 | $4,526 | $3,264 |
| 2026 | $35,319 | $3,047 | $6,730 | $4,887 | $3,461 |
| Annualized Growth | 6.95% | 17.93% | 17.84% | 32.75% | 37.60% |
| Annualized Growth (Ignoring Pandemic | 8.53% | 2.17% | 14.22% | 17.37% | 16.00% |
(Source: FactSet Research Terminal)
ADDYY’s higher growth spending is expected to limit FCF growth but its overall top and bottom line forecasts are consistent with management guidance and very impressive.
| Metric | 2021 Growth Consensus | 2022 Growth Consensus | 2023 Growth Consensus | 2024 Growth Consensus (Bond Market Recession Forecast) | 2025 Growth Consensus |
2026 Growth Consensus |
| Sales | 20% | 6% | 9% | 8% | 9% | 3% |
| Dividend | 10% | 16% | 22% | 15% | 6% | 18% |
| EPS | 223% | 30% | 22% | 21% | 15% | 11% |
| Operating Cash Flow | 137% | -15% | 13% | 14% | 16% | 5% |
| Free Cash Flow | 143% | -24% | 14% | 11% | 45% | NA |
| EBITDA | 60% | 16% | 13% | 13% | NA | NA |
| EBIT (operating income) | 164% | 24% | 19% | 14% | NA | NA |
(Source: FAST Graphs, FactSet Research)
The only thing more impressive than ADDYY’s EPS growth forecast is its dividend growth forecast.
adidas Long-Term Growth Outlook
(Source: FactSet Research Terminal)
While management is saying to expect about 18% EPS growth including historical buybacks, analysts think ADDYY might grow at 28% over time.
- 23.3% to 27.9% CAGR consensus growth range
- individual analyst growth estimates range from 0% (Baader Heivea Equity Research) to 72.3% CAGR (Warburg Research)
- Deutsche Bank thinks adidas can grow 23.3% CAGR over the long-term
- management guidance (not including buybacks) is 16% to 18%
- 17% to 19% CAGR including historical buybacks
How accurate are analyst forecasts?
Smoothing for outliers, historical analyst margins-of-error are 45% to the downside and 33% to the upside
- 12% to 28% margin-of-error adjusted growth consensus range (capped by historical growth rates)
- 70% statistical probability that adidas will grow at 12% to 28% over time
If we ignore the pandemic’s temporary collapse, ADDYY’s historical growth rates are 5% to 14% annually.
- 11% CAGR over the last 20 years (similar to Nike)
- historical PEG ratio: 2.1
- 23 to 29X PE is what investors paid for this wonderful company growing at such rates
- now you can buy ADDYY at 20X earnings with management guiding for 55% faster growth
- if the historical PEG ratio holds adidas’ fair value could actually be 35.5X earnings (similar to Nike’s)
Reason Three: A Wonderful Company At A Wonderful Price
For 20 years tens of millions of investors have paid between 23 and 29X earnings for ADDYY, ignoring the recent spike caused by the pandemic collapse of earnings.
- 91% statistical probability that ADDYY is worth 23 to 29X earnings
- possibly more if it can deliver on the fastest growth rate in the company’s history (35.5 PE is historical PEG justified multiple)
| Metric | Historical Fair Value Multiples (10-years) | 2021 | 2022 | 2023 | 2024 |
12-Month Forward Fair Value |
| 13-Year Median Yield | 1.36% | $133.82 | $134.71 | $134.71 | $219.12 | |
| Earnings | 27.74 | $114.57 | $150.63 | $181.14 | $215.54 | |
| Average | $123.45 | $142.22 | $154.51 | $217.31 | $145.06 | |
| Current Price | $115.88 | |||||
|
Discount To Fair Value |
6.13% | 18.52% | 25.00% | 46.68% | 20.11% | |
|
Upside To Fair Value (NOT Including Dividends) |
6.53% | 22.73% | 33.34% | 87.53% | 25.18% (26.8% including dividend) | |
| 2022 EPS | 2023 EPS | 2022 Weighted EPS | 2023 Weighted EPS | 12-Month Forward EPS | 12-Month Average Fair Value Forward PE |
Current Forward PE |
| $5.43 | $6.53 | $4.18 | $1.51 | $5.68 | 25.5 | 20.4 |
Ignoring the fact that ADDYY is expected to grow 55% faster than it has historically, it’s historically worth about 25.5X earnings.
Today you can buy it for 20.4X.
But wait, don’t forget about ADDYY’s net cash balance sheet!
- EV/EBITDA = cash-adjusted earnings
- ADDYY’s EV/EBITDA is 11.2!
For context, before the pandemic, private equity deals were averaging 12.3 EV/EBITDA.
Or to put it another way, ADDYY is a bargain…by private equity standards.
Except that instead of locking up your money for 7 to 15 years, you have one of the world’s highest quality companies, with 100% liquidity.
And I’m hardly the only one who thinks ADDYY is a wonderful company at a fair price or better.
|
Analyst Median 12-Month Price Target |
Morningstar Fair Value Estimate |
| $162.82 (24.9 PE) | $117.00 (20.6 PE) |
|
Discount To Price Target (Not A Fair Value Estimate) |
Discount To Fair Value |
| 28.83% | 0.96% |
|
Upside To Price Target (Not Including Dividend) |
Upside To Fair Value (Not Including Dividend) |
| 40.51% | 0.97% |
|
12-Month Median Total Return Price (Including Dividend) |
Fair Value + 12-Month Dividend |
| $164.65 | $118.83 |
|
Discount To Total Price Target (Not A Fair Value Estimate) |
Discount To Fair Value + 12-Month Dividend |
| 29.62% | 2.48% |
|
Upside To Price Target (Including Dividend) |
Upside To Fair Value + Dividend |
| 42.09% | 2.55% |
Morningstar’s fair value estimate of 20.6X earnings is based on lower expected margins than either analysts or management expect.
- Morningstar expects management to miss its long-term growth guidance
- but ADDYY growing at 5% is still worth at least 23X earnings based on 20 years of historical market data
- Morningstar’s fair value estimate is 91% likely to be too conservative
Analysts expect ADDYY to approach my fair value estimate within a year, and deliver exceptional 42% total returns.
About 27% total returns over the next 12 months would be fundamentally justified.
But of course, I don’t care about 12-month return forecasts, I care about whether or not a blue-chip’s margin of safety sufficiently compensates investors for its risk profile.
| Rating | Margin Of Safety For Low-Risk 13/13 Ultra SWAN Quality Companies | 2022 Price | 2023 Price |
12-Month Forward Fair Value |
| Potentially Reasonable Buy | 0% | $142.22 | $154.51 | $145.06 |
| Potentially Good Buy | 5% | $135.11 | $146.78 | $137.81 |
| Potentially Strong Buy | 15% | $120.89 | $131.33 | $123.30 |
| Potentially Very Strong Buy | 25% | $101.33 | $115.88 | $108.79 |
| Potentially Ultra-Value Buy | 35% | $92.44 | $100.43 | $94.29 |
| Currently | $116.00 | 18.44% | 24.92% | 20.03% |
| Upside To Fair Value (Not Including Dividends) | 22.61% | 33.20% | 25.05% |
For anyone comfortable with its risk profile ADDYY is a potentially strong buy and here’s why.
Consensus Total Return Potential That Puts The S&P 500 To Shame
For context, here’s the return potential of the 18% overvalued S&P 500.
| Year | EPS Consensus | YOY Growth | Forward PE | Blended PE | Overvaluation (Forward PE) |
Overvaluation (Blended PE) |
| 2021 | $206.32 | 50.39% | 20.7 | 21.4 | 20% | 22% |
| 2022 | $225.15 | 9.13% | 20.0 | 20.4 | 16% | 16% |
| 2023 | $247.63 | 9.98% | 18.2 | 19.1 | 6% | 9% |
| 2024 | $274.54 | 10.87% | 16.4 | 17.3 | -4% | -2% |
| 12-Month forward EPS | 12-Month Forward PE | Historical Overvaluation | PEG | 25-Year Average PEG | S&P 500 Dividend Yield |
25-Year Average Dividend Yield |
| $227.41 | 19.839 | 17.88% | 2.33 | 3.62 | 1.44% | 2.01% |
(Source: DK S&P 500 Valuation And Total Return Tool)
Stocks have already priced in 96% EPS growth from 2020 through 2024 and are trading at 18.5X forward earnings.
- 16.84 is the 25-year average
- 14% correction needed to get back to historical market fair value
S&P 500 2027 Consensus Return Potential
| Year | Upside Potential By End of That Year | Consensus CAGR Return Potential By End of That Year | Probability-Weighted Return (Annualized) |
Inflation And Risk-Adjusted Expected Returns |
| 2027 | 34.75% | 6.15% | 4.61% | 1.27% |
(Source: DK S&P 500 Valuation And Total Return Tool)
Adjusted for inflation, the risk-expected returns of the S&P 500 are about 1.3% for the next five years.
- S&P’s historical inflation-adjusted returns are 6% to 7% CAGR
| S&P Earnings Yield | 10-Year US Treasury Yield | Earning Yield Risk-Premium (3.7% 10 and 20-year average) |
| 5.04% | 2.37% | 2.67% |
| Theoretical Interest Rate Justified Market Fair Value Forward PE | Current PE |
Theoretically Interest Rate Justified Market Decline |
| 16.47 | 19.84 | 17.00% |
(Source: DK S&P 500 Valuation And Total Return Tool) updated weekly
Even adjusting for low (and rising) interest rates, stocks still require an even larger 17% correction before they become theoretically fairly valued.
- 5-year consensus return potential range: 14% to 23% CAGR
adidas 2024 Consensus Total Return Potential
(Source: FAST Graphs, FactSet)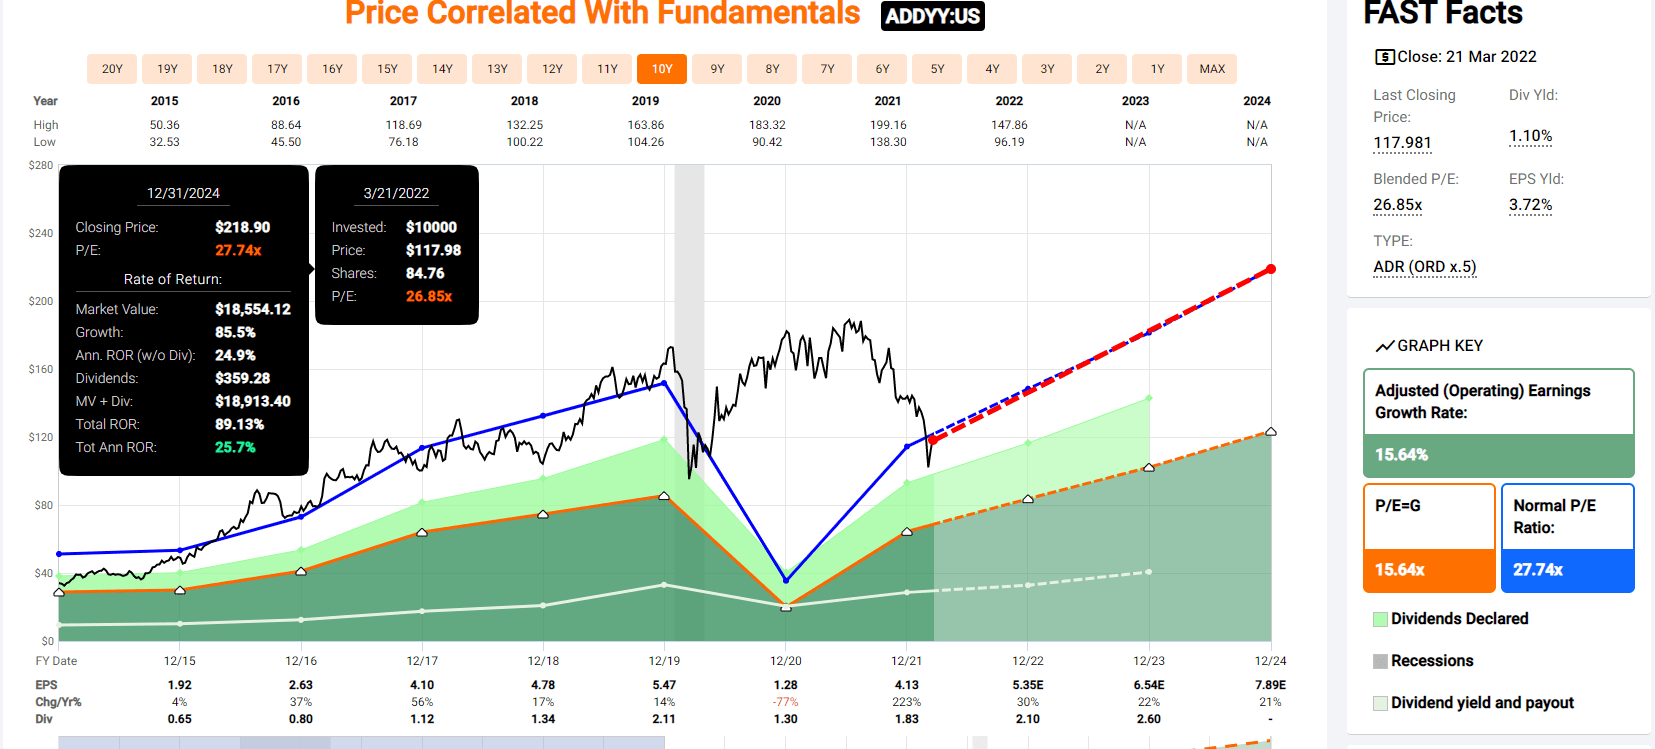
If ADDYY grows as expected and returns to historical mid-range fair value by the end of 2024, investors could nearly double their money, achieving 26% annual total returns.
adidas 2027 Consensus Return Potential
(Source: FAST Graphs, FactSet)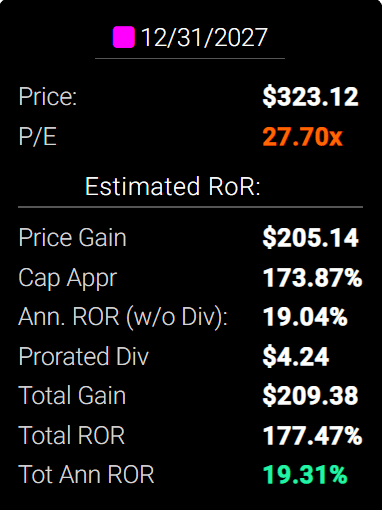
If ADDY grows as expected and returns to historical mid-range fair value
- then 178% total returns or 19% CAGR
- about 5X more than the S&P 500 consensus
But before you start measuring the drapes for your Miami Beach penthouse, don’t forget that even low-risk Ultra SWANs have risks you need to be comfortable with before investing a penny.
Risk Profile: Why adidas Isn’t Right For Everyone
There are no risk-free companies and no company is right for everyone. You have to be comfortable with the fundamental risk profile.
adidas’s Risk Profile Summary
- economic cyclicality risk: sales could suffer in a recession
- M&A risk: Reebok was a failed acquisition
- technology disruption risk: falling retail sales (though offset by DTC)
- consumer taste risk: different brands go in and out of fashion (effected by occasional scandals)
- margin compression risk: over 1,000 major global rivals
- supply chain disruption risk: big impact in 2021
- labor retention risk (tightest job market in over 50 years and finance is a high paying industry) – rising wage pressures
- currency risk
- accounting fraud risk: significantly less than 17.5% statistical chance of accounting fraud per the Beneish M-score (advanced accounting metric is 74% effective at finding accounting fraud)
In a deal that we regard as a poor use of capital, adidas acquired Reebok in 2005 for $3.8 billion. Once a legitimate rival to Nike in the U.S., Reebok has fallen far behind it and other major athletic brands. Reebok generated only EUR 1.4 billion in sales in 2020 versus EUR 18.4 billion for the adidas brand. Thus, we have a positive view of adidas’ recent announcement that will sell Reebok to Authentic Brands Group for EUR 2.1 billion. This deal is expected to close in 2022’s first quarter. While adidas is expected to return most of this cash to shareholders, it has not provided specifics.
adidas has not acquired a company in more than five years. Its most recent deal was Austria-based fitness app Runtastic, acquired by previous management for $240 million in 2015. We think adidas overpaid, as 50.1% of it had been sold just two years earlier at an enterprise value of just $25 million. As Under Armour was making acquisitions in the fitness app space at around the same time, we think adidas may have felt pressure to follow suit. We do not expect adidas to pursue large acquisitions and expect it will use much of its free cash flow for stock buybacks and dividends.” – Morningstar (emphasis added)
adidas is taking a $1.6 billion loss on its acquisition of Reebok after 17 years of trying to compete with Nike and failing.
Recession Watch
The bond futures market expects the 10-2 yield curve to invert in July and a mild recession to begin around February 2024.
| Bonds | Yield |
| 3-Month Treasury Yield | 0.52% |
| 2-Year Treasury Yield | 2.14% |
| 10-Year Treasury Yield | 2.37% |
| 10-3M Curve (Most Accurate Recession Forecasting Tool) | 1.85% |
| 10-2 Curve (Most Popular Yield Curve Followed By Wall Street) | 0.23% |
| Bond Futures Pricing In Inversion | June 2022 |
| Bond Futures Pricing In Recession Start | January 2024 |
(Source: DK S&P 500 Valuation & Total Return Tool)
The 10-2 curve is the most closely watched by Wall Street but a study from the NY Fed finds that the 10-3 curve is the most accurate at forecasting recessions.
Currently, the bond market is mildly concerned about recession risk and we are monitoring the situation closely each day.
- recession scare is likely in the next few months
- yield curve + BaR economic grid makes it very likely that we’ll see a recession coming at least 12 months out
How do we quantify, monitor, and track such a complex risk profile? By doing what big institutions do.
Material Financial ESG Risk Analysis: How Large Institutions Measure Total Risk
Here is a special report that outlines the most important aspects of understanding long-term ESG financial risks for your investments.
- ESG is NOT “political or personal ethics based investing”
- it’s total long-term risk management analysis
ESG is just normal risk by another name.” Simon MacMahon, head of ESG and corporate governance research, Sustainalytics” – Morningstar
ESG factors are taken into consideration, alongside all other credit factors, when we consider they are relevant to and have or may have a material influence on creditworthiness.” – S&P
ESG is a measure of risk, not of ethics, political correctness, or personal opinion.
S&P, Fitch, Moody’s, DBRS (Canadian rating agency), AMBest (insurance rating agency), R&I Credit Rating (Japanese rating agency), and the Japan Credit Rating Agency have been using ESG models in their credit ratings for decades.
- credit and risk management ratings make up 41% of the DK safety and quality model
- dividend/balance sheet/risk ratings make up 82% of the DK safety and quality model
adidas Long-Term Risk Management Consensus
| Rating Agency | Industry Percentile |
Rating Agency Classification |
| MSCI 37 Metric Model | 100.0% |
AAA, Industry Leader, Stable Trend |
| Morningstar/Sustainalytics 20 Metric Model | 84.8% |
13.4/100 Low-Risk |
| Reuters’/Refinitiv 500+ Metric Model | 100.0% |
#1 Industry Leader, Exceptional |
| S&P 1,000+ Metric Model | 85.0% |
Excellent, Stable Trend |
| FactSet | 50.0% |
Average, Positive Trend |
| Morningstar Global Percentile | 94.3% | Exceptional (844th out of 14765) |
| Consensus | 86% |
Very Good, Industry Leader, Low-Risk |
(Sources: MSCI, Morningstar, Reuters’, S&P, FactSet Research)
adidas Long-Term Risk Management Is The 28th Best In The Master List (94th Percentile)
- master list average: 62nd percentile
- dividend kings: 63rd percentile
- aristocrats: 67th percentile
- Ultra SWANs: 71st percentile
ADDYY’s risk-management consensus is in the top 6% of the world’s highest quality companies and similar to that of such other companies as
- Applied Materials (AMAT)
- W.W. Grainger (GWW) – dividend king
- Novo Nordisk (NVO) – global aristocrat
- Lowe’s (LOW) – dividend king
- BlackRock (BLK)
- Autodesk (ADSK)
- Pepsi (PEP) – dividend king
- Lockheed Martin (LMT)
- Colgate-Palmolive (CL) – dividend king
- Allianz (OTCPK:ALIZY)
- Enbridge (ENB) – global aristocrat
The bottom line is that all companies have risks, and adidas is very good at managing theirs.
How We Monitor adidas’ Risk Profile
- 31 analysts
- 2 credit rating agencies
- 6 total risk rating agencies
- 37 experts who collectively know this business better than anyone other than management
- and the bond market for real-time fundamental risk analysis
When the facts change, I change my mind. What do you do sir?” – John Maynard Keynes
There are no sacred cows at iREIT or Dividend Kings. Wherever the fundamentals lead we always follow. That’s the essence of disciplined financial science, the math retiring rich and staying rich in retirement.
Bottom Line: Buy adidas: One Of The World’s Best Hyper-Growth Dividend Blue-Chips
Is the market correction ending? Lipper Financial thinks so.
Or are we headed for a sharp crash as we saw in December 2018 due to an inverting yield curve and a recession scare?
Daily Shot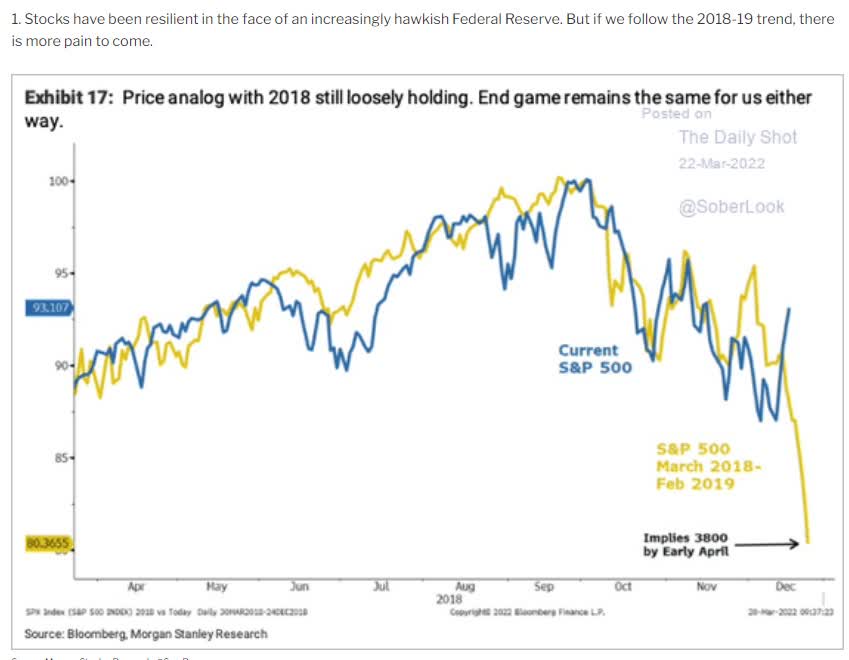
I can’t tell you that, no one can. I don’t have a crystal ball. But here’s what I can tell you.
Reasons To Potentially Buy ADDYY
- 92% quality low-risk 13/13 Ultra SWAN quality apparel maker
- very safe 1.6% yield (91% safety score)
- 0-year dividend growth streak (suspended during the pandemic)
- 120% conservatively undervalued (potential strong buy)
- Fair Value: $144.94
- 20.4 PE vs 23 to 29 historical
- cash-adjusted PE: 11.2!
- A+ stable outlook credit rating = 0.6% 30-year bankruptcy risk
- risk management consensus 86th industry percentile = Very Good
- risk-management in the top 6% of the world’s safest companies
- 12% to 28% CAGR margin-of-error growth consensus range
- 27.9% CAGR median growth consensus
- management guidance: 16% to 18% CAGR growth (NOT counting buybacks)
- 5-year consensus total return potential: 14% to 23% CAGR
- base-case 5-year consensus return potential: 20% CAGR (5X market consensus)
- consensus 12-month total return forecast: 42% (24.9 PE, reasonable)
- Fundamentally Justified 12-Month Returns: 27% CAGR
How good a potential investment is adidas right now?
ADDYY Investment Decision Score
Dividend Kings (Source: DK Automated Investment Decision Tool)
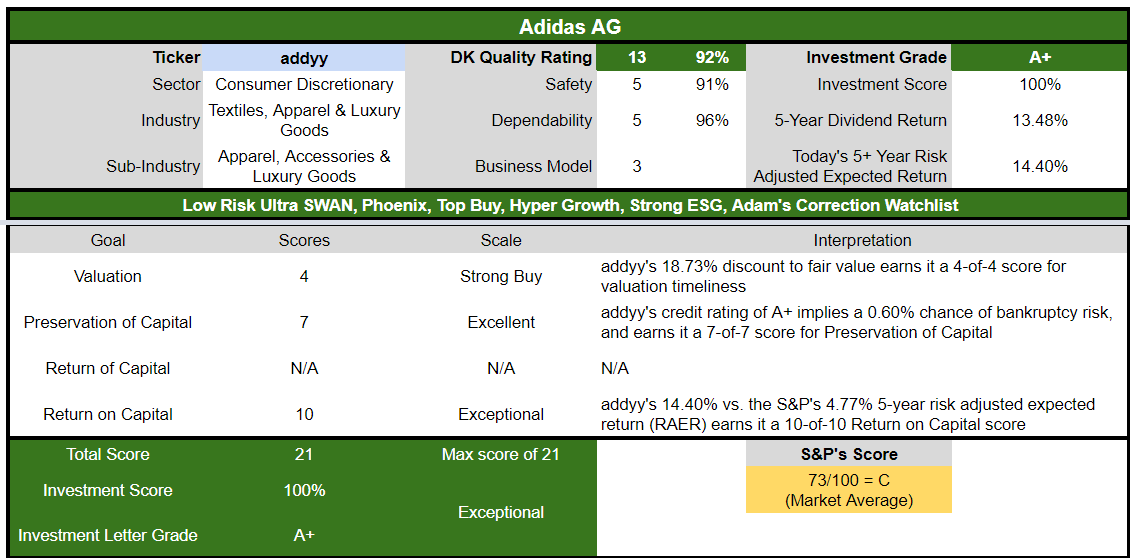
For anyone comfortable with its risk profile, adidas is as close to a perfect hyper-growth blue-chip investment as exists on Wall Street today.
- 20% discount vs 17% market premium
- far superior fundamental quality and safety
- 70% higher long-term return potential than S&P 500 overtime
- almost 3X the risk-adjusted expected return for the next five years
This is how you stop gambling on Wall Street and turn into the house that always wins.
This is how you take charge of your financial destiny and retire in safety and splendor.
This is how you can make your own luck, no matter what the economy, stock market, or interest rates are doing.
Luck is what happens when preparation meets opportunity.” – Roman philosopher Seneca the younger
This is why I just bought adidas and you might want to consider doing the same.
Be the first to comment