

Foreword
The many ways to evaluate the S&P 500 list include pitfalls and perils. A straight listing by yield, for example, includes as many top dogs poised to fall amid a few rising stars. This high-dividend yield index list narrows the field to (Now) 70 stocks with (mostly) positive returns over the past year and yields greater than 2.9%, assuming their good fortune holds. Nevertheless, past pleasantries are never a guarantee of future fates. Witness the ten S&P 500 dearly departed high dividends from this index in March and April: F, GPS, JWN, LB, M, TPR, GM, KSS, BA, and CCL.
The S&P 500 High Dividend Index (Ticker: SPXHDUP) serves as a benchmark for income-seeking equity investors. The index is designed to measure the performance of 80 high-yield companies within the S&P 500 and is equally weighted to best represent the performance of this group, regardless of constituent size.
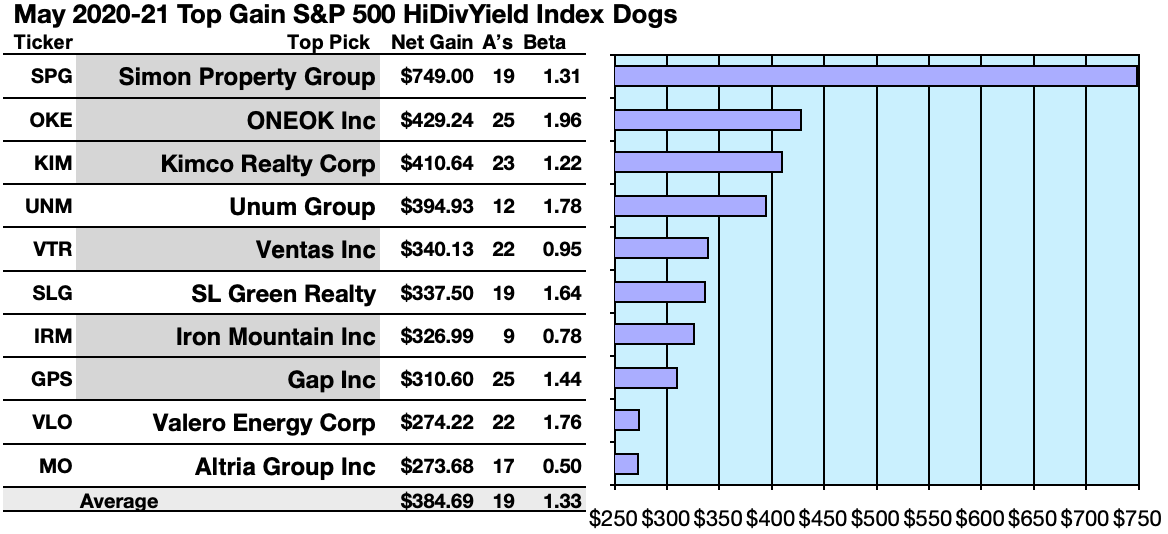
Actionable Conclusions (1-10): Analysts Forecast 27.37% To 74.9% Top Ten S&P High-Yield Net Gains To May 2021
Six of ten top S&P 500 high-yield index dogs by yield were among these top ten gainers for the coming year based on analyst 1-year target prices. (They are tinted gray in the chart below). Thus, this yield-based S&P 500 forecast was graded by Wall St. brokers as 60% accurate.
These projections were based on estimated dividends from $1,000 invested in each of the highest yielding stocks and the median of aggregate 1-year analyst target prices, as reported by YCharts. Note: 1-year target prices by lone analysts were not applied. Ten probable profit-generating trades projected to April 28, 2021, were:
Source: YCharts.com
Simon Property Group (SPG) was projected to net $749.00, based on dividends, plus the median of target price estimates from nineteen analysts, less broker fees. The Beta number showed this estimate subject to risk 31% more than the market as a whole.
ONEOK, Inc. (OKE) was projected to net $429.24, based on dividends, plus the median of target price estimates from twenty-five analysts, less broker fees. The Beta number showed this estimate subject to risk 96% greater than the market as a whole.
Kimco Realty Corp. (KIM) was projected to net $410.64, based on a median of target price estimates from twenty-three analysts, plus dividends, less broker fees. The Beta number showed this estimate subject to risk 22% more than the market as a whole.
Unum Group (UNM) was projected to net $394.93, based on a median of target price estimates from twelve analysts, plus the estimated annual dividend, less broker fees. The Beta number showed this estimate subject to risk 78% more than the market as a whole.
Ventas, Inc. (VTR) was projected to net $340.13, based on the median of target price estimates from twenty-two analysts, plus annual dividend, less broker fees. The Beta number showed this estimate subject to risk 5% less than the market as a whole.
SL Green Realty (SLG) was projected to net $337.50, based on the median of target price estimates from nineteen analysts, plus annual dividend, less broker fees. The Beta number showed this estimate subject to risk 64% more than the market as a whole.
Iron Mountain (IRM) was projected to net $326.99, based on dividends, plus the median of target price estimates from nine analysts, less broker fees. The Beta number showed this estimate subject to risk 22% less than the market as a whole.
Gap, Inc. (GPS) netted $310.60 based on the median of estimates from twenty-five analysts, plus dividends. The Beta number showed this estimate subject to risk 44% greater than the market as a whole.
Valero Energy Corp. (VLO) was projected to net $274.22, based on dividends, plus a mean target price estimate from twenty-two analysts, less broker fees. The Beta number showed this estimate subject to risk 76% over the market as a whole.
Altria Group, Inc. (MO) was projected to net $273.68, based on a median target estimates from seventeen analysts, plus dividends, less broker fees. The Beta number showed this estimate subject to risk 50% less than the market as a whole.
The average net gain in dividend and price was estimated at 38.47% on $10k invested as $1k in each of these ten stocks. Their averaged beta risk was 33% over the market as a whole.
Source: dreamstime.com

The Dividend Dogs Rule
Stocks earned the “dog” moniker by exhibiting three traits: (1) paying reliable, repeating dividends, (2) their prices fell to where (3) yield (dividend/price) grew higher than their peers. Thus, the highest yielding stocks in any collection became known as “dogs.” More precisely, these are, in fact, best called, “underdogs”.
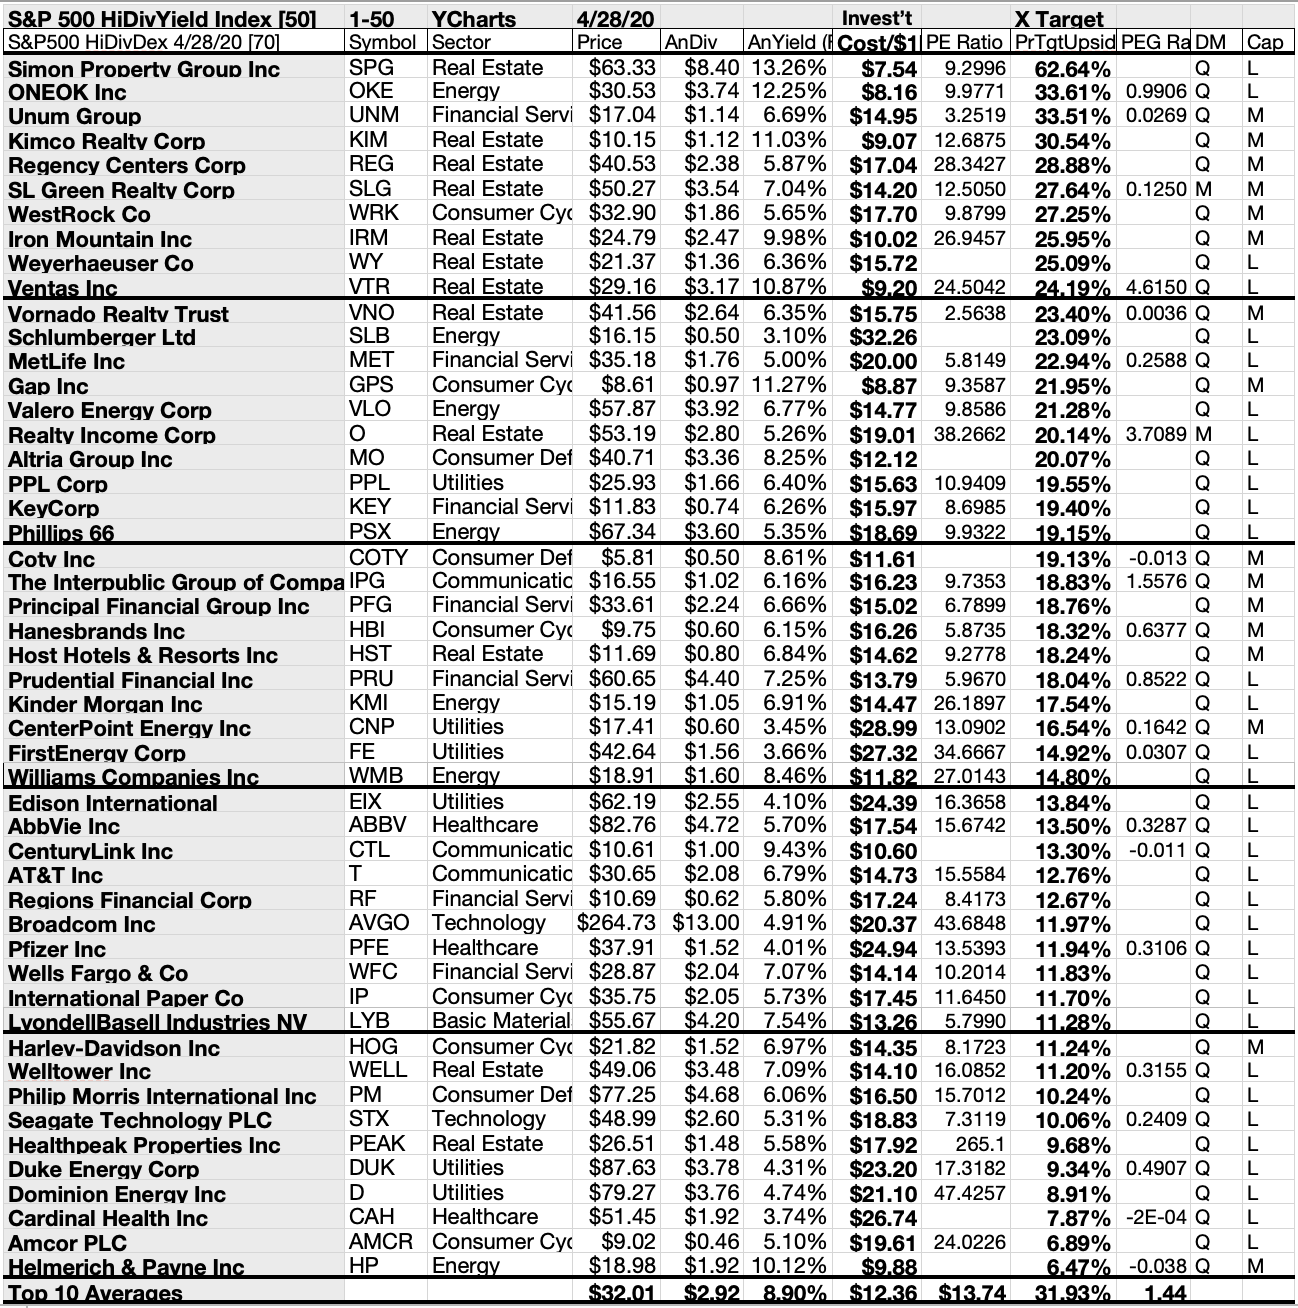
50 S&P 500 High Dividend Yield Index Dogs By Broker Target Gains
Source: us.spindices/YCharts
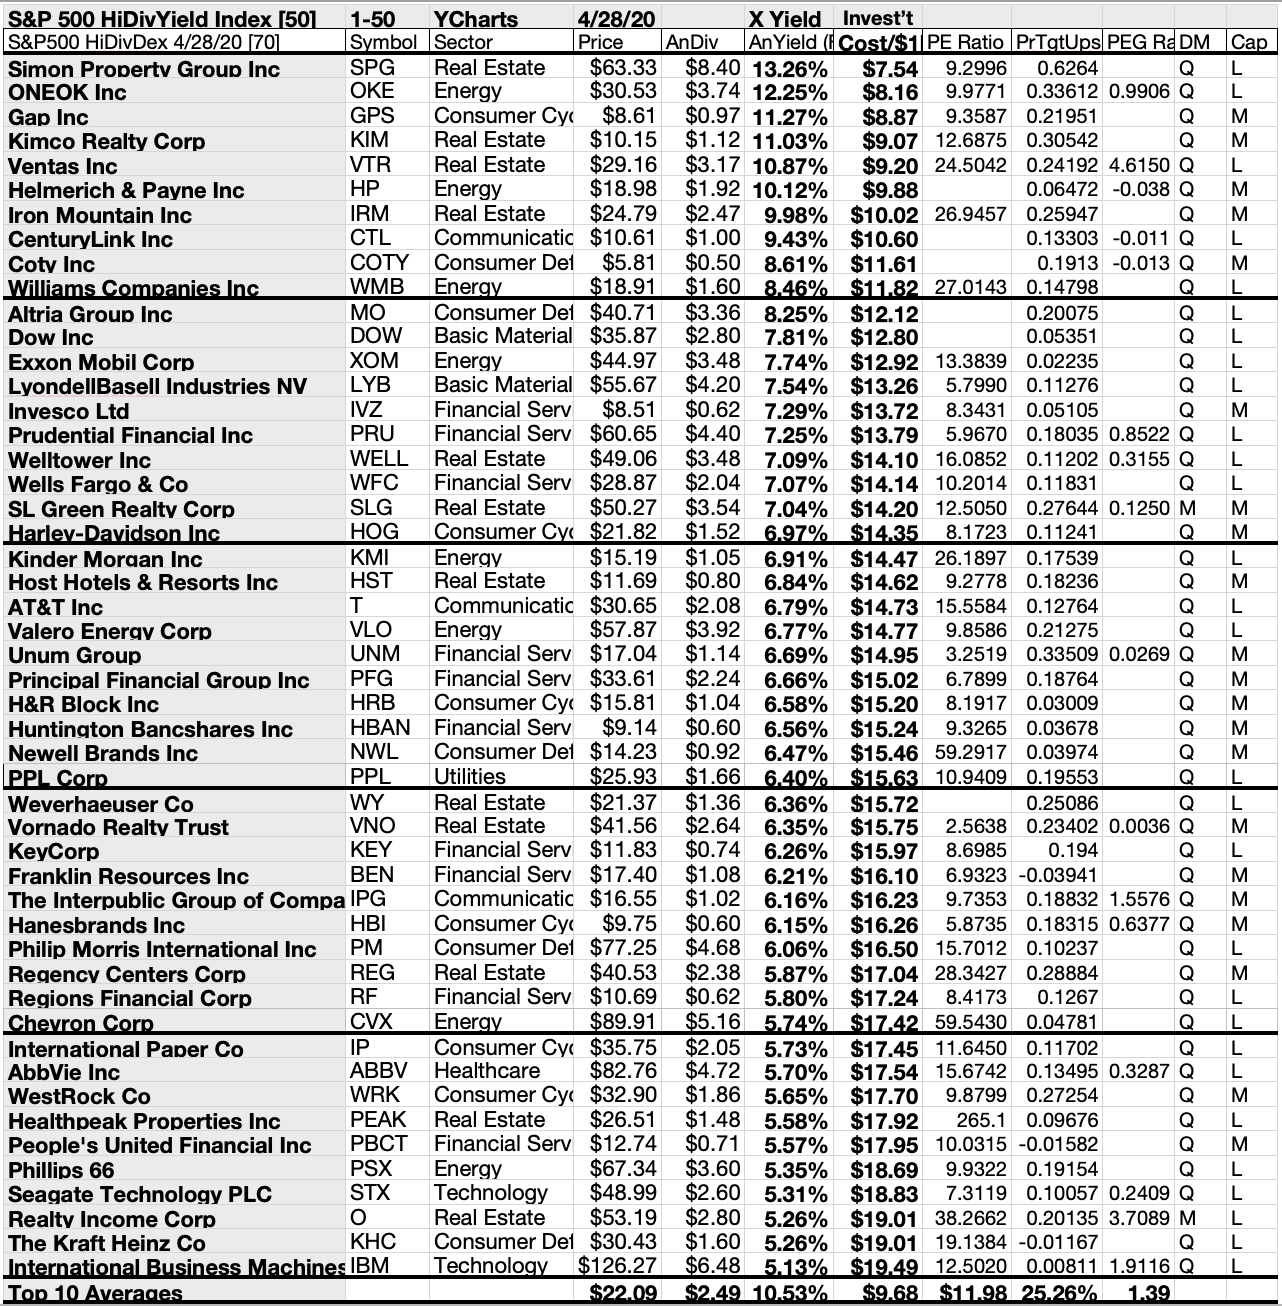
50 S&P 500 High Dividend Yield Index Dogs By Yield
Source: us.spindices/YCharts
Actionable Conclusions (11-20): 10 High Dividend Yield S&P 500 Dividend Dogs By Yield
Top ten S&P 500 top return stocks selected 4/28/20 by yield represented five of eleven Morningstar sectors. First place was claimed by one of four real estate sector representatives – Simon Property Group Inc. [1]; the other three placed fourth, fifth, and seventh – Kimco Realty [4], Ventas. Inc. [5], and Iron Mountain [7].
Three energy representatives placed second, sixth, and tenth – ONEOK, Inc. [2], Helmerich & Payne, Inc. (HP) [6], and Williams Companies, Inc. (WMB) [10]. Then, one consumer cyclical representative placed third – Gap, Inc. [3].
A lone communication services representative placed eighth – CenturyLink Inc. (CTL) [8]. Finally, one consumer defensive representative placed ninth – Coty, Inc. (COTY) [9] – to complete the S&P 500 high dividend yield index top ten dogs by yield for May 20-21.
Actionable Conclusions: (21-30) Top Ten S&P 500 HiDiv Index Stocks Showed 29.73% To 62.64% Upsides To May 2021; (31) No Downsiders Were Identified
Source: YCharts.com
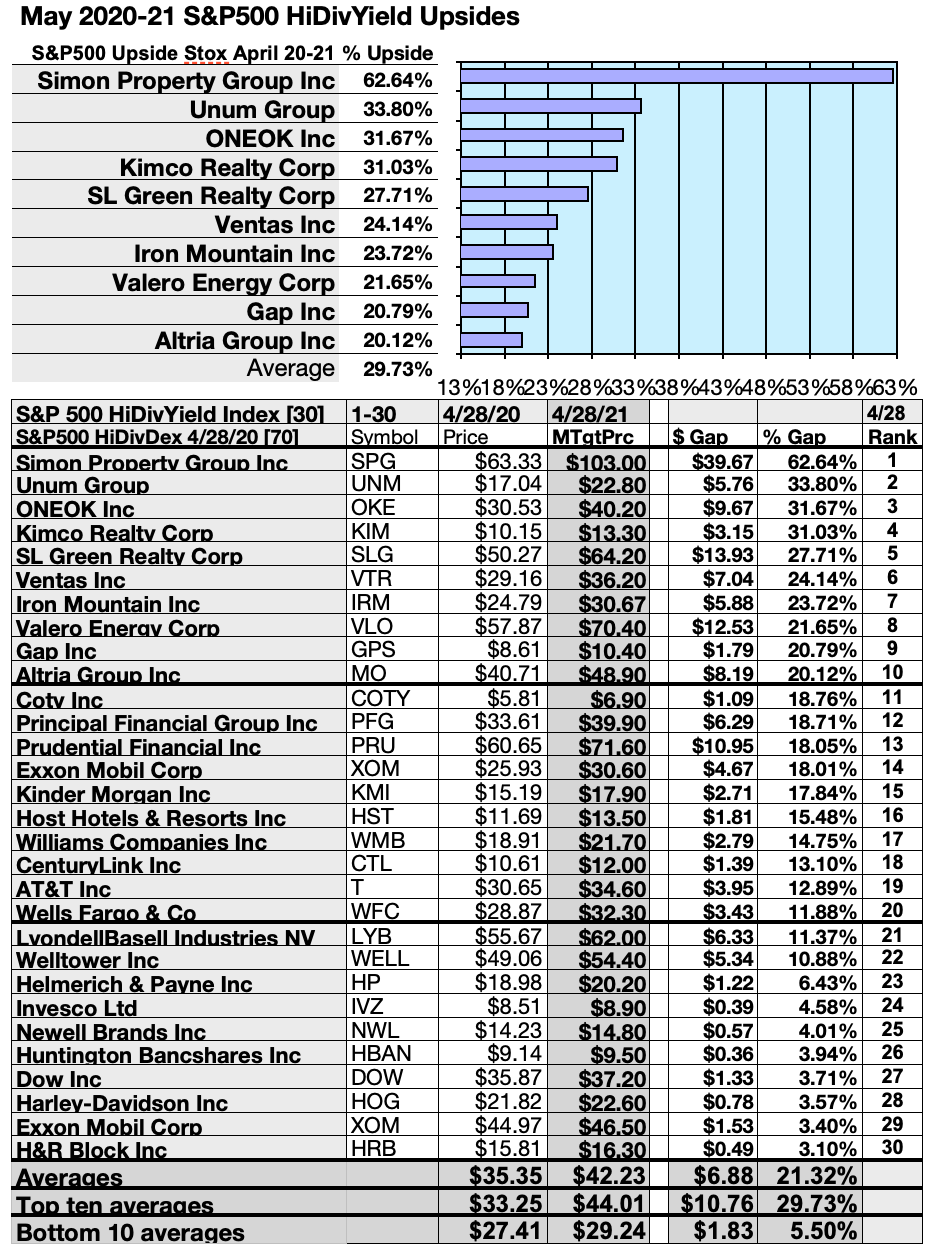
To quantify top dog rankings, analyst median price target estimates provided a “market sentiment” gauge of upside potential. Added to the simple high-yield metrics, analyst mean price target estimates became another tool to dig out bargains.
Analysts Forecast A 16.9% Disadvantage For 5 Highest Yield, Lowest Priced S&P 500 High Dividend Yield Index Dogs To May 2021
Ten top S&P 500 dividend dogs were culled by yield for this monthly update. Yield (dividend/price) results verified by YCharts did the ranking.
Source: YCharts.com
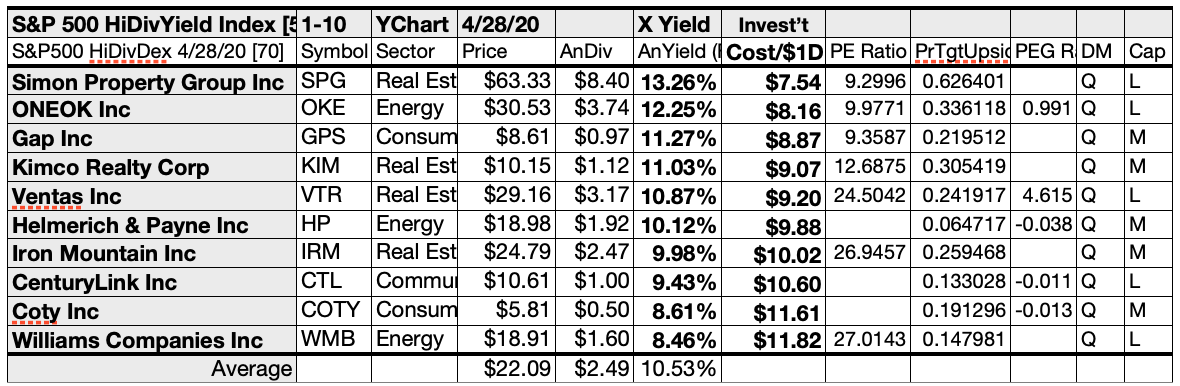
As noted above, ten top S&P 500 high dividend yield index dogs selected 4/28/20 showing the highest dividend yields represented five of eleven in the Morningstar sector scheme.
Actionable Conclusions: Analysts Forecast 5 Lowest-Priced Of the Top Ten Highest-Yield S&P 500 High Dividend Yield Index Dogs (32) Delivering 28.45% Vs. (33) 34.23% Net Gains by All Ten Come May 2021
Source: YCharts.com
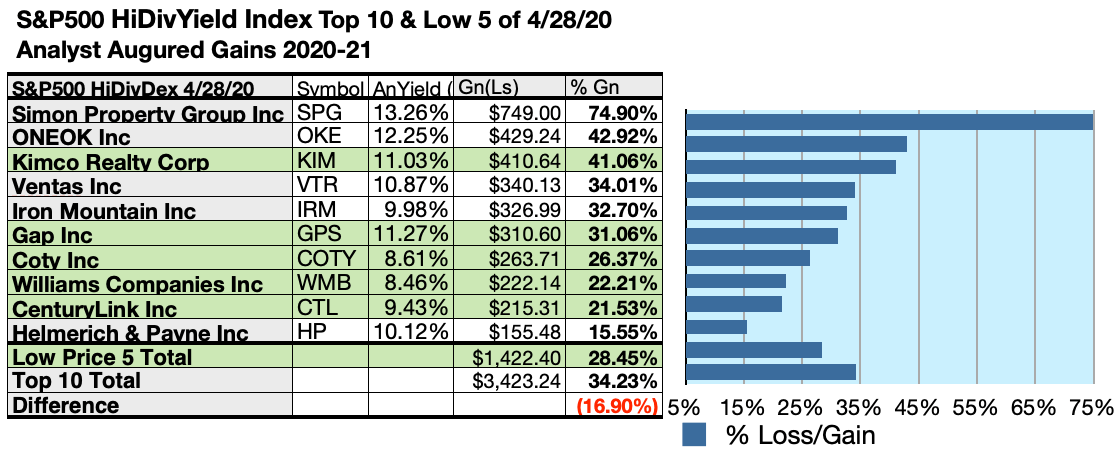
$5,000 invested as $1k in each of the five lowest-priced stocks in the top ten Dividend S&P 500 kennel by yield were predicted by analyst 1-year targets to deliver 16.9% less gain than $5,000 invested as $.5k in all ten. The highest-priced selection, Simon Property Group, Inc., was projected by analyst target prices to deliver the best net gain of 74.9%.
Source: YCharts.com
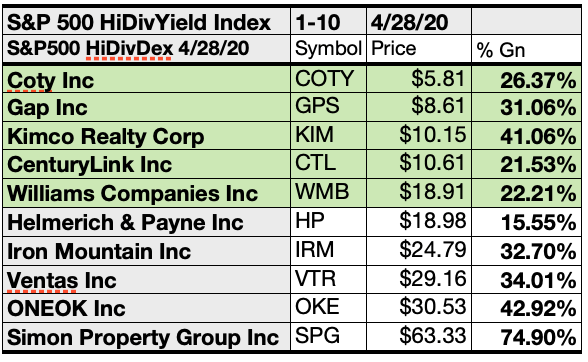
The five lowest-priced S&P 500 high dividend yield index dogs as of April 28 were: Coty, Inc.; Gap, Inc.; Kimco Realty; CenturyLink, Inc.; and Williams Companies, Inc., with prices ranging from $5.81 to $18.91.
Five higher-priced S&P 500 high dividend yield index dogs as of April 28 were: Helmerich & Payne, Inc.; Iron Mountain, Inc.; Ventas, Inc.; ONEOK, Inc.; and Simon Property Group, Inc., whose prices ranged from $18.98 to $63.33.
The distinction between five low-priced dividend dogs and the general field of ten reflected Michael B. O’Higgins’ “basic method” for beating the Dow. The scale of projected gains based on analyst targets added a unique element of “market sentiment” gauging upside potential. It provided a here-and-now equivalent of waiting a year to find out what might happen in the market. Caution is advised since analysts are historically only 20% to 80% accurate on the direction of change and just 0% to 20% accurate on the degree of change.
The net gain/loss estimates above did not factor in any foreign or domestic tax problems resulting from distributions. Consult your tax advisor regarding the source and consequences of “dividends” from any investment.
Stocks listed above were suggested only as possible reference points for your S&P 500 high dividend yield index dog purchase or sale research process. These were not recommendations.
Get The Entire S&P 500 ‘Safer’ Dividend Dog Story
Click here to subscribe to The Dividend Dogcatcher. Get more information, the follow-up to this article, and a free two-week trial.
Catch A Dog On Facebook At 8:45 AM every NYSE trade day on Facebook/Dividend Dog Catcher, A Fredrik Arnold live video highlights a portfolio candidate in the Underdog Daily Dividend Show!
Root for the Underdog. Comment below on any stock ticker to make it eligible for my next FA follower report.
Disclosure: I am/we are long PFE, T. I wrote this article myself, and it expresses my own opinions. I am not receiving compensation for it (other than from Seeking Alpha). I have no business relationship with any company whose stock is mentioned in this article.
Additional disclosure: Disclaimer: This article is for informational and educational purposes only and should not be construed to constitute investment advice. Nothing contained herein shall constitute a solicitation, recommendation or endorsement to buy or sell any security. Prices and returns on equities in this article except as noted are listed without consideration of fees, commissions, taxes, penalties, or interest payable due to purchasing, holding, or selling same.
Graphs and charts were compiled by Rydlun & Co., LLC from data derived from www.indexarb.com; YCharts.com; finance.yahoo.com; analyst mean target price by Thomson/First Call in YahooFinance. Dog photo: dreamstime.com
Be the first to comment