

oobqoo/iStock via Getty Images
This market update is unusual in that it follows closely on the heels of my last full market update on August 29, “S&P 500: Where We Go After Jackson Hole,” and the brief update on September 13, “Ignore The Inflation Noise,” following the August CPI report.
With the S&P 500 (NYSEARCA:SPY) resuming its downtrend following the August CPI report, and concerns about inflation and interest rates front and center, there is increasing uncertainty in the markets. It is in these periods of heightened uncertainty that the noise level becomes the loudest, increasing the risk of mistaking noise for signals.
A rapid and recessionary phase transition is unfolding within important sectors of the economy, which is well ahead of reported statistics. As bear markets create the greatest opportunities while exposing the greatest risks, it is in these periods that outsized future returns and current risks are on the table. Noise reduction is critical during such high-impact phase transitions.
Filter The Noise
The greatest source of noise today is the underlying trend of inflation and interest rates. As the stock market is intimately connected to both, filtering this noise is of utmost importance.
The underlying inflation trend, deceleration, was covered in my September 13 report. As a result, here I will turn to interest rate trends and then transition to what they mean for the stock market. In the following table, I display interest rate changes across the major segments of the bond market since my August 29 market update. I have highlighted in yellow the uniform message of the bond market over the weeks since Jackson Hole. The data was compiled from the Wall Street Journal.
Source: The Wall Street Journal. Created by Brian Kapp, stoxdox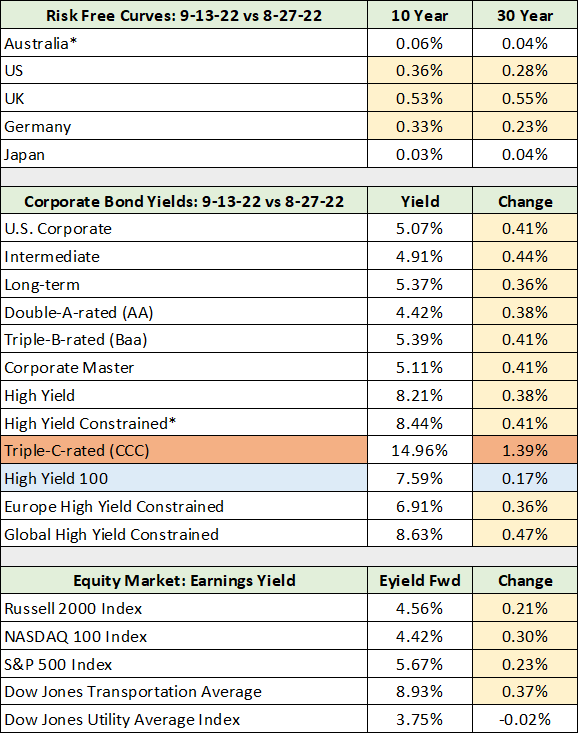
Notice that the interest rate changes highlighted in yellow are roughly identical. The differences in the yellow highlighted yield changes are too small to be meaningful. For example, the US 10-year Treasury yield rose 0.36% compared to 0.41% for Triple-B-rated bonds, 0.38% for the High Yield index, and 0.30% for the Nasdaq 100 index earnings yield (using forward earnings estimates).
Importantly, the similar yield changes are across all segments of the bond market as well as the earnings yield on the major stock market indices, including the S&P 500. Since Jackson Hole, we have experienced a uniform rise in interest rates without credit spreads noticeably widening.
The signal from the broad bond and stock market is clear, rates have risen uniformly across the board since Jackson Hole. This uniform rate increase is also evident across the major risk-free yield curves as can be seen in the next table compiled from Bloomberg.
Source: Bloomberg. Created by Brian Kapp, stoxdox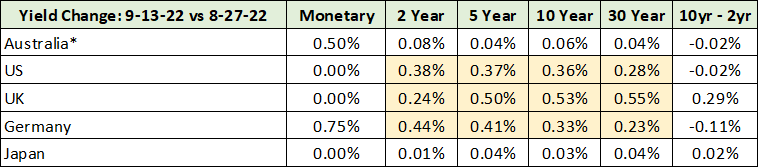
I have highlighted in yellow the yield change from 2 years to 30 years for the major risk-free bond markets. The uniform change in yields across market segments is depicted in the first table while the second table above confirms that the yield change was uniform across the maturity spectrum.
Interestingly, the bond index which experienced the smallest yield increase (the first table) was the High Yield 100 index at 0.17%. Importantly, the broad high-yield bond market, or junk bonds, is not setting new interest rate highs. Conversely, the higher quality segments of the corporate bond market are setting new highs. The distance from the 52-week high yields for each segment of the corporate bond market are displayed in the following table.
Source: The Wall Street Journal. Created by Brian Kapp, stoxdox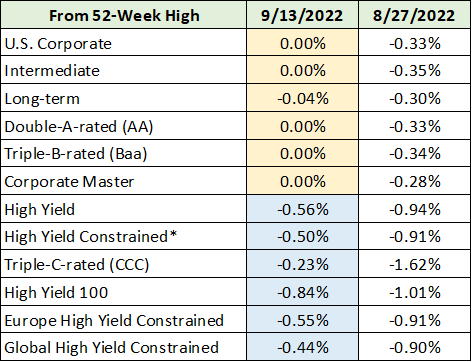
I have highlighted in yellow the high-quality segments of the corporate bond market. Notice that high-quality rates are now pinned at 52-week highs. Importantly, yields in the junk bond market, highlighted in blue, remain below 52-week highs by roughly 0.5%. This confirms the lack of spread widening and the uniform nature of the interest rate increase since Jackson Hole. The following quote, from my August 29 market update, is being confirmed by the above rate data.
The higher-quality segments of the bond market… continue to face material interest rate risk. Conversely, the lower-quality sectors appear to have largely priced in the current rate hike cycle…
The only segment of the bond market in which spreads widened was the Triple-C-rated junk bond index, which is highlighted in orange in the first table above. This is the riskiest end of the corporate bond market with yields now at 15%. The signal here is that the weakest corporations are facing increasing economic risks. This is no surprise as a recession looks highly likely to be in progress, with a start date near Q2 2022 into Q3 2022.
Recession
If a recession is in fact in progress, as appears to be the case, the noise surrounding the CPI report and the risk of inflation going forward requires filtering. The noise in this case, rising inflation, is so backward-looking that it dramatically increases the probability of mistaking noise for signals.
As documented in the inflation report on September 13, the CPI report significantly lags reality. In the case of the largest CPI component, housing, the inflation being reported today is more in line with that which occurred roughly 18 months ago.
Given the lags and flaws inherent in economic statistics and data collection, an extra filter is required. As a result, it is helpful to go directly to the source for confirmation of where we are in the economic cycle. The source is the corporations themselves.
For example, on the day of the CPI report Eastman Chemical (NYSE:EMN) warned about its Q3 earnings. I covered Eastman on September 6 in the report, “Eastman Chemical Is Entering A Bull Market.” What is most important about Eastman, as an economic indicator, is its broad industry diversification.
In essence, Eastman Chemical is a great representation of the broad economy. The company supplies specialty materials to most economic sectors, such as plastics. Eastman’s CEO, Mark Costa, warned of the following in the company’s Q3 2022 8-K filed with the SEC on September 13 (emphasis added).
While demand across some end markets, including agriculture and personal care, is demonstrating resilience, demand has slowed more than expected in August and September, in particular in the consumer durables and building and construction end markets and the European and Asian regions.
Notice that the cyclical economic sectors, such as consumer durable goods and real estate-related sectors, slowed more rapidly than expected in August and September. While cyclical industries were expected to slow, the slowdown looks to be gaining velocity in relation to expectations when entering Q3. Additionally, Europe looks to be well into a recessionary environment, which is being aggravated by skyrocketing energy prices and war. Finally, Asia is also dealing with recessionary conditions.
Eastman is a top-quality, industry-leading basic materials supplier with broad economic exposure. The company is signaling recessionary conditions during Q3 for cyclical sectors of the economy. Notice that the building and construction markets in particular are experiencing recessionary conditions.
This is in stark contrast to the “hot” CPI report on September 13, for which housing accounts for roughly 43%. Clearly the real estate sector is contracting in response to the rapid interest rate increases, which are largely in the rearview mirror. The mild 0.38% inversion of the U.S. Treasury yield curve (2-year yield > 10-year yield) also suggests we are nearing the end of the current rate hike cycle.
It should be self-evident that a doubling of mortgage rates will lead to lower activity and real estate prices, as it’s embedded in the mathematics and scale of the rate increase. Gary Friedman, Chairman and Chief Executive Officer of RH (NYSE:RH), confirmed this in RH’s June 29, 2022 8-K filed with the SEC, when the company lowered its 2022 guidance (emphasis added):
The deteriorating macro-economic environment has resulted in lower than expected demand since our prior forecast… With mortgage rates double last year’s levels, luxury home sales down 18% in the first quarter, and the Federal Reserve’s forecast for another 175 basis point increase to the Fed Funds Rate by year end, our expectation is that demand will continue to slow throughout the year.
Friedman reiterated the trend more recently in the company’s Q2 2022 8-K earnings release (emphasis added):
As we’ve mentioned, there continues to be widespread discounting across our industry… As noted in our updated Outlook provided on June 29, 2022, our expectation is for continued softening… as a result of ongoing weakness in the housing market over the next several quarters and possibly longer…
In summary, Eastman Chemical’s Q3 warning points to recessionary conditions being in effect with a likely start date of Q2 2022 into Q3 2022. Eastman is confirming what we have already heard from RH and other cyclical industries, such as semiconductors. For example, Nvidia (NASDAQ:NVDA), a semiconductor leader, warned about earnings several times in August alone.
It is highly unlikely that the Fed will hike interest rates aggressively into a recession, as that would open the door to systemic risks. This is how I summarized the Fed’s likely position in the August 29 market update:
One thing the Fed is not trying to do is create a systemic event by destroying asset values broadly. That would take them back to the zero-interest rate and QE quagmire, which I view as a worst-case scenario that they are likely to avoid as best they can.
S&P 500
With a recession at hand and within an established bear market, the key question is: what does all this mean for the stock market? Using the S&P 500 as the benchmark, I will begin with where I ended the August 29 market update in regard to the S&P 500 or SPY:
The first support zone is in the $338 to $351 area… The downtrend looks likely to persist for the broad US equity indices… With earnings estimates being generally revised lower, this support zone may not hold and will be dependent on how much earnings downside materializes. As a result, the zone… between $285 and $300 cannot be ruled out.
The first support zone for the SPY represents downside potential of -11% to -14%. This is a high probability target with the S&P 500 in a confirmed bear market and the recent onset of recessionary conditions. It is probable that the market will continue to trend lower into Q4 as earnings estimates likely need to come down. With consensus estimates too high, the key question now becomes: what is already priced into the market?
What Is Priced Into the Markets?
I will begin with the Eastman Chemical example as it serves as a framework within which to view the market as a whole. Eastman reduced its Q3 earnings guidance by 20% to $2 per share. The table below displays consensus earnings estimates as of my September 6 Eastman report.
Source: Seeking Alpha. Created by Brian Kapp, stoxdox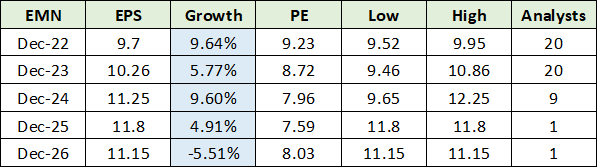
At the time, Eastman was trading at 9x the 2022 consensus earnings estimate, which is roughly half the market-wide multiple. Clearly investors were anticipating Eastman missing the consensus estimate for 2022, which I infer from Eastman’s trading history near a mid-teen earnings multiple.
If 16x is a normal multiple for Eastman, we can roughly estimate what level of earnings the market is pricing into Eastman. With Eastman trading near $82 today, applying a 16x multiple, we can extrapolate the market’s earnings estimate into the 2022 to 2023 timeframe. While it is a crude estimate of the market’s expectation for Eastman’s earnings, at $5.12 per share, it is a good place to start.
It should be noted that Eastman’s 5-year average PE is actually 18 rather than 16. Nonetheless, $5.12 of annual earnings is well below consensus estimates for 2022 and 2023, roughly half. The current share price appears to account for much lower earnings than consensus expectations.
Eastman just reduced Q3 earnings guidance by 20% to $2. This reduced earnings level of $2 for Q3 remains well above a $5.12 per share annual earnings run rate. With this being the first major warning from Eastman, the cyclical trend in earnings is decidedly lower. That said, I don’t foresee Eastman breaching the $5.12 per share level, which I inferred to be in the ballpark of what the market expects Eastman to actually earn.
In the case of Eastman, much of the recessionary economic trend appears to already be priced into the shares. Here is how I summed it up in the September 6 report:
I expect exceptionally strong support near $80, there is additional technical downside potential to the $70 range… While the current retest of recent lows near $85 may fail to hold given the current bear market in stocks broadly, the downside appears to be well contained.
The Market
Eastman is sitting on top of a major support zone between $70 and $80, with the majority of the earnings downside largely priced in while offering a bond-like dividend yield at 3.7% and growing. The downside does appear well contained, outside of a systemic risk event.
As discussed at the onset of this section, the S&P 500 has downside of -11% to -14% to its equivalent major support zone. This looks to be a high probability target range with the S&P 500 trading at 22x trailing 12 months earnings and a dividend yield of 1.7%. The table below displays the current valuation data and dividend yields for the major averages and was compiled from the Wall Street Journal.
Source: The Wall Street Journal. Created by Brian Kapp, stoxdox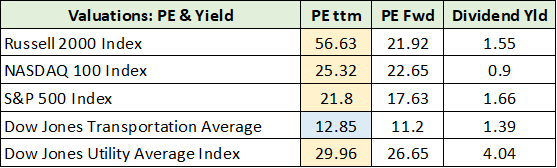
In relation to Eastman trading at 9x earnings compared to its historical average in the mid-teens, the market indices are well above historical averages, which are also in the mid-teens. Interestingly, the transportation index appears well advanced in pricing in recessionary conditions, highlighted in blue.
A final note on the above valuation data. Adobe Systems (NASDAQ:ADBE) announced an acquisition today valued at 100x sales. This highlights a risk that remains across large segments of the market, extreme valuations. Interestingly, both Eastman (0.03% weight) and Adobe (0.53% weight) are S&P 500 members, highlighting the dispersion underneath the market surface. The following quote is from the August 29 market update:
There is a high probability that the bear market in US equities carries lower into the fourth quarter of 2022… That said… there are segments of the market which are more advanced in their declines (or normalization) than are the popular equity indices.
Summary
The rapid and recessionary phase transition in the economy is well ahead of reported statistics, with all signs pointing to a recession being in progress. Bear markets create the greatest opportunities and expose the greatest risks. It is in these periods that outsized future returns and current risks are on the table.
A hallmark of such phase transitions is that the noise level in the information flow becomes the loudest, greatly increasing the risk of mistaking noise for signals. Noise reduction is critical during these high-impact phase transitions. The rate hike cycle is nearing a mature stage with much in the rearview mirror. While the S&P 500 and broad market averages are likely to trend lower into Q4 given economic headwinds, there are extraordinary opportunities developing under the surface for those looking.
Be the first to comment