

ipopba/iStock via Getty Images
The strategic framework
Based on my research, the full-blown bear market has three phases:
- The Fed-induced liquidity shock;
- The immediate recession sell-off; and
- The credit crunch sell-off.
Since Jan 4th, S&P 500 (SPX) (SPY) (SP500) has been in a near 20% correction, and with the recent 6% rally of the bottom, the current total drawdown is around 14% YTD. The question is now whether the 20% correction has been completed without the full-blown bear market, or there will be another immediate leg down for the S&P 500.
My analysis shows that the current bounce still has room to run. In fact, there are 4 reasons to buy stocks now. However, there is 1 good reason to worry about the deeper selloff. So, as always, the strategic outlook for S&P500 has to be balanced. Here are 4 reasons to buy and 1 reason to sell.
Reasons to buy
-
The Liquidity Shock is receding
The current 20% correction in S&P500 was the Phase 1 selloff, or the Fed-induced liquidity shock. Specifically, the monetary policy tightening expectations have turned very aggressive since January 4th when, based on Federal funds futures, the market expected the Fed to hike to around 0.80% in 2022, while in May 4th, the market expected the Fed to hike to 3% in 2022, which was the peak in the expected Fed hawkishness.
The sharp increase in expectations of Fed tightening, caused the burst in all speculative bubbles, primarily causing the deep selloff in cryptocurrencies (BTC-USD) and overvalued tech stocks (QQQ). The expectations of liquidity removal by the Fed caused the liquidity shock sell-off.
In addition to expectations of the Fed interest rate hikes, the market also priced the reduced liquidity due to ending of QE program in March and the commencement of the QT program in June, which caused the significant rise in real interest rates, which were around -1% for 10Y Treasuries in January, and now are positive. Increase in real interest rates (also nominal interest rates) contributed to the liquidity shock selloff as the market repriced the overvalued PE ratios for tech stocks.
However, it appears that the liquidity shock selloff reached its climax on May 10th, when the volatility index VIX (VXX) reached the top, before S&P500 reached the bottom on May 20th.
Last week, all speculative assets reached some stability, and it appears that liquidity-based selling is receding. This signals that the Phase 1 sell-off is possibly over. Thus, S&P500 is likely to continue rising – propelled by short covering by speculators who still short with expectations of the further downside.
2. The probability of an immediate recession is low
The next leg down in S&P500 will likely be the sell-off in expectation of an immediate recession. In recessions, corporate earnings decrease, thus the PE ratios have to further adjust downward to price decline in earnings.
Historically, the inversion of the yield curve, specifically the 10Y-3mo spread, signals an immediate recession. In fact, the Fed uses the 10y-3mo spread to estimate the probability of a recession within the 12-month period. Currently, the 10y-3mo spread is 1.80% – thus the probability of a recession within the next 12 months is very low or 3.71% based on NY Fed estimation.
As a result, I don’t expect the Phase 2 sell-off anytime soon. Furthermore, the estimated terminal rate for the current Fed hiking cycle of around 3% might be too low to cause the recession and favors the soft landing.
3. The credit risk is very moderate and easing
The credit crunch sell-off, or the Phase 3 of the bear market, is usually triggered during the recession when/if the recession causes major corporate bankruptcies, especially as related to the crash in the housing market.
Currently, the economy is very strong and housing market remains resilient. One of the key measures of the credit risk is the spread between the BBB-rated bonds and the 10Y Treasury Bonds. Historically, the risk if an imminent credit crunch increases when this ratio exceeds 3%. Currently, the spread is 2.10%, which is very moderate. Furthermore, the spread has been decreasing from the high point of 2.36%. Thus, the probability of the credit crunch Phase 3 sell-off is extremely low.
4. The Fed’s Modest Dovish Pivot
The minutes from the May FOMC meeting show that the Fed has possibly made a modest dovish turn. Specifically, the Fed aims to front-load the increase in interest rates, but only to the neutral level. At that point, possibly in Sep 2022, the Fed could pause the hiking cycle and evaluate the effect of higher interest on the real economy. Thus, the risk of the Fed-induced recession has significantly decreased, which increases the probability that the current bounce in stocks continues.
One reason to sell – increase in inflation expectations
As soon as the Fed indicated the modest dovish turn, the long-term inflationary expectations started to rise. Historically, the Fed gets hawkish as 10Y Breakeven inflation expectations cross 2.75%. In fact, the Fed made the infamous hawkish pivot in November 2021 as 10Y BE expectations reached 2.75%.
Just recently, on May 24th, the 10Y BE inflation expectations fell to 2.55%. However, last week the inflation expectations rose to 2.74%. If this number keeps rising above 2.75%, the Fed will have to turn hawkish again, which will increase the expectations of monetary policy tightening.
As a result, the liquidity shock sell-off (Phase 1) could resurface. More importantly, the expectations of the more aggressive Fed will re-invert parts of the yield curve (10y-2y), and significantly narrow the 10Y-3mo spread and likely invert it later this year, which will significantly increase the recession probability and thus the probability of the Phase 2 sell-off. Here is the chart of 10 BE inflation:
FRED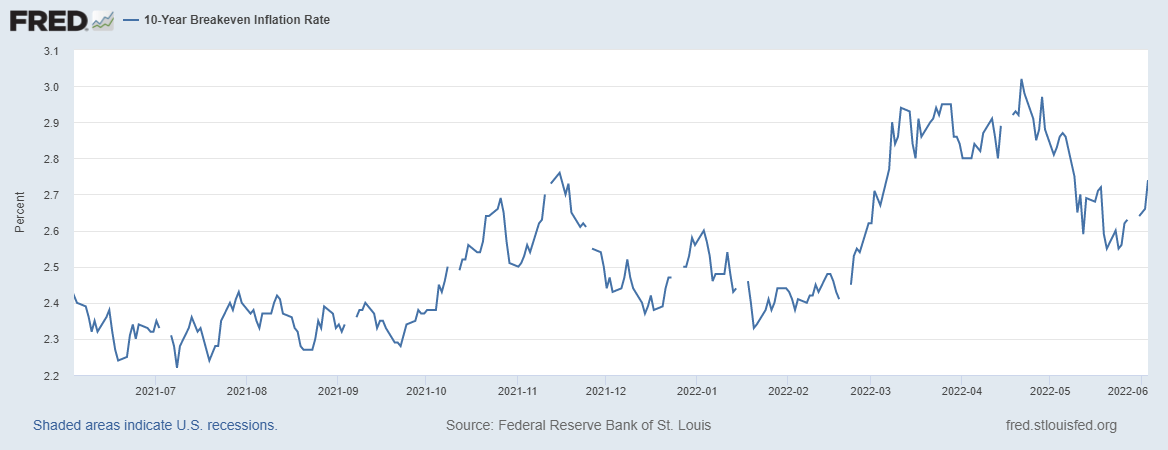
What’s driving the inflation expectations higher? First, there is the possibility that the market views the Fed’s modest dovish turn as premature and another Fed error. Second, the price of crude oil keeps rising, now above the March 7th Russian invasion of Ukraine level.
Implications
The key macro indicators are positive for the stock market. The liquidity risk is receding, the recession probability is low, and the credit risk is falling. However, the entire collective macro bullish outlook is dependent on stable-to-falling inflation expectations, and last week inflation expectations rose to the key level.
Over the short term, the market direction might be held hostage by the volatile oil prices. However, on balance, investors should look past those volatile oil prices and focus instead on the longer-term inflation outlook. For this reason, it is important to follow with the possible drop of the China tariffs imposed by the Trump administration, as a sign of re-globalization, which is beneficial to longer-term inflation expectations.
Be the first to comment