

Jae Young Ju/iStock via Getty Images
Thesis
The iShares Semiconductor ETF (NASDAQ:SOXX) has historically been traded at a premium relative to the overall market represented by the SPDR S&P 500 Trust ETF (NYSEARCA:SPY) for good reasons. By concentrating on one of the most innovative sectors (information technologies), SOXX has outperformed SPY in the long term by a good margin. Even after the recent corrections, SOXX currently trades at a PE about 31.5x and SPY about 26.5x according to Yahoo Finance data, a pretty substantial premium of almost 20%.
However, their valuations deserve a more careful interpretation. And as you will see, the thesis of this article is that:
- PE only provides partial information and can be misleading. There are differences between the accounting earnings and owners’ earnings and valuation based on the latter provides more insights.
- Dividends provide a backdoor for investors to approximate owners’ earnings.
- The recent price corrections have brought their valuation in line with each other as measured by their dividend yield spread. Their current yield spread is close to the historical average.
Basic information about SOXX and SPY ETFs
SOXX is a popular sector fund provided by iShares. It provides a convenient avenue for investors to gain exposure to U.S. companies that design, manufacture, and distribute semiconductors. And if this is one ETF fund that needs no introduction, it is probably SPY. It is one of the largest S&P 500 funds, offering diversified exposure to the overall U.S. economy with a very low 0.09% expense ratio and excellent liquidity.
With the above overview, now let’s examine the funds more closely. The following chart summarizes the top holdings in both funds for readers who are not familiar with them yet.
As you can see, SOXX provides concentrated exposure to the semiconductor sector. It only holds 32 stocks as of right now. And all of them are companies with operations focused on information technology, semiconductors, and semiconductor equipment. Furthermore, the fund is really top-heavy and the top ten holdings represent more than 56% of the total assets in the fund. In contrast, the SPY fund is more diversified. It includes the largest ~500 companies in the economy and includes all major market sectors. It’s less top-heavy also. The top ten holdings represent only about 30% of the total assets.
Source: www.ETF.com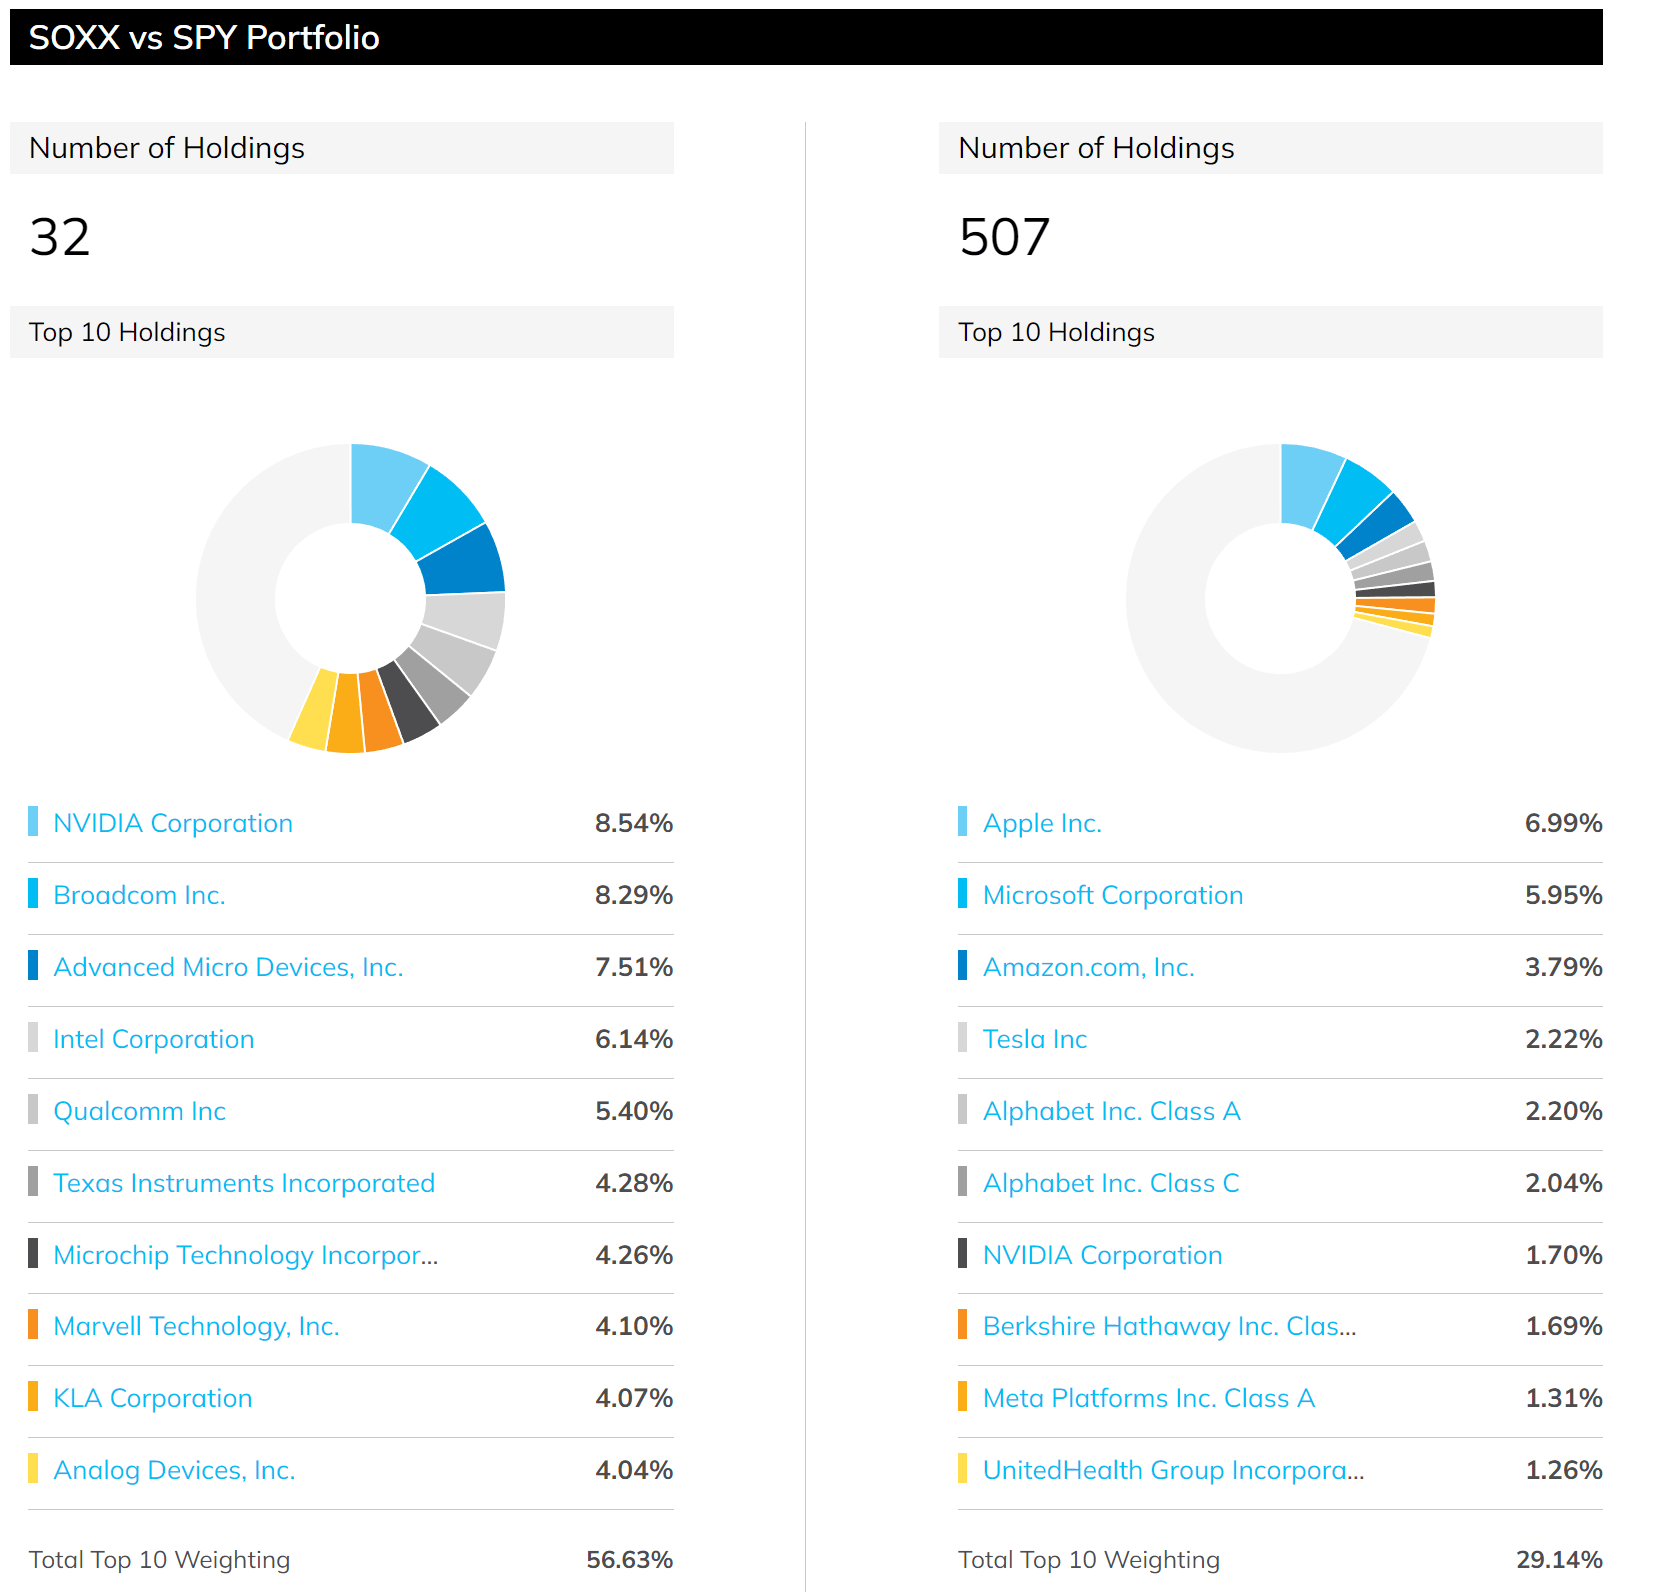
By concentrating on one of the most innovative sectors (information technologies), SOXX has outperformed SPY in the long term by a good margin. As you can see from the following chart, SOXX has delivered an annual return of more than 11% since its inception in 20O2. In contrast, SPY has delivered about 8.9% of annual return, lagging SOXX by more than 2% per annum. And over a long time, say 20 years, such a lag can lead to a large difference in terms of total dollar amount as you can see.
Although at the same time, because of its concentration to a very specific sector and also to a handful of stocks, it has also suffered larger volatility risks. As you can see, its standard deviation is almost twice the SPY (~27% vs ~14%). Its worst year and maximum drawdown are also significantly larger than the SPY fund (which are already at nerve-wracking levels). Depending on your risk appetite, such large volatilities can either be a problem or an opportunity, as we are going to see immediately next.
Source: Portfoliovisualizer.com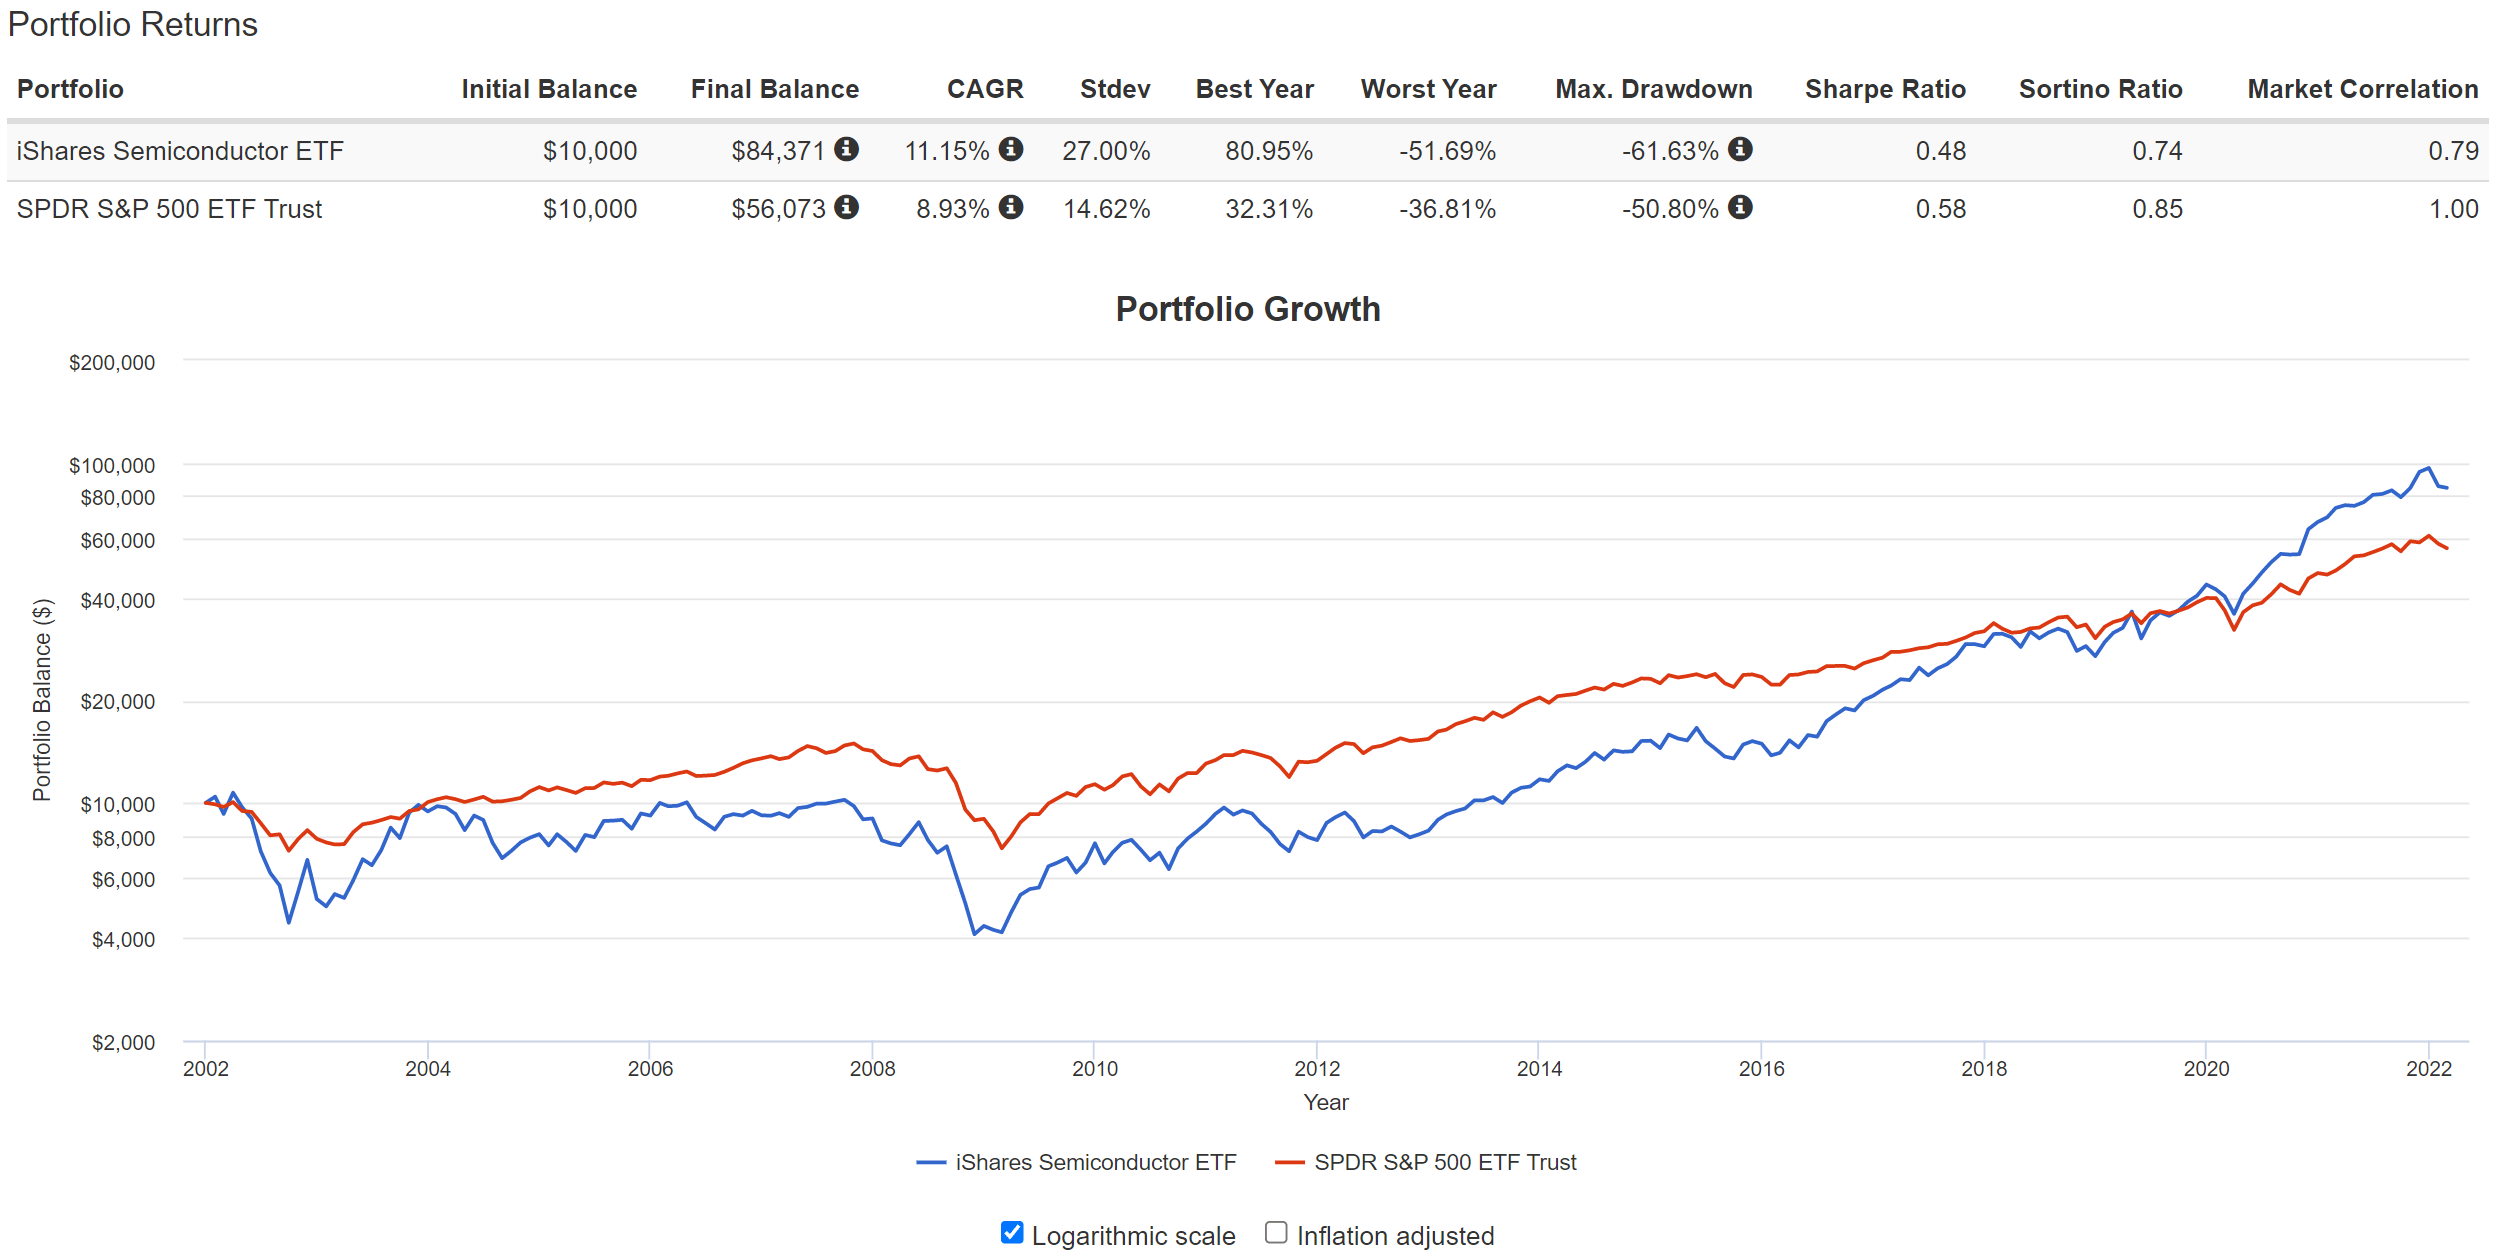
Dividends as a measure of owners’ earnings
The price volatilities as aforementioned create large valuation swings. For equities funds such as SOXX and SPY which pay regular dividends, an effective way to evaluate their valuations is by their dividend yield, and an effective way to evaluate their relative valuations is by their dividend yields either relative to each other or relative to the risk-free rates. Details of these concepts and approaches have been provided in our earlier article. Dividends yields and yield spread are what we first check before making any investment decisions. We’ve fortunately had very good success with this approach because of:
- The common PE multiple provides partial and even misleading information due to the differences between accounting earnings and owners’ earnings.
- Dividends provide a backdoor to quickly estimate the owners’ earnings. Dividends are the most reliable financial information and least open to interpretation. In investing, we always prefer a simpler method that relies on fewer and unambiguous data points rather than a more complicated method that depends on more ambiguous data points.
- Dividend yield spreads are based on a timeless intuition. No matter how times change, the risk-free rate serves as the gravity on all asset valuations and consequently, the spread ALWAYS provides a measurement of the risk premium investors are paying relative to risk-free rates. And similarly, the yield spread between two securities always measures their risk premium relative to each other. A large spread provides a higher margin of safety and vice versa.
Based on the above understanding, you can see how the valuation of both SOXX and SPY changed in tandem with the risk-free rates (represented by the yield from IEF, iShares 7-10 Year Treasury Bond ETF) in the past decade. Due to the steady decline of the treasury rates, the valuation of both SOXX and SPY rose steadily as reflected in our declining dividend yields. When the 10-year treasury rates reached their secular bottom during 2020~2021, valuations of SOXX and SPY reached their peak values. The recent surges in the treasury rates were accompanied by SOXX and SPY price corrections, pushing up their dividend yields.
Also, you can see that SOXX has consistently paid a lower dividend yield than SPY almost all the time. And as you probably could have guessed, when the SOXX yield approaches that of SPY, these are good times to trade SPY for SOXX, and vice versa. And the next section will confirm this intuition.
Seeking Alpha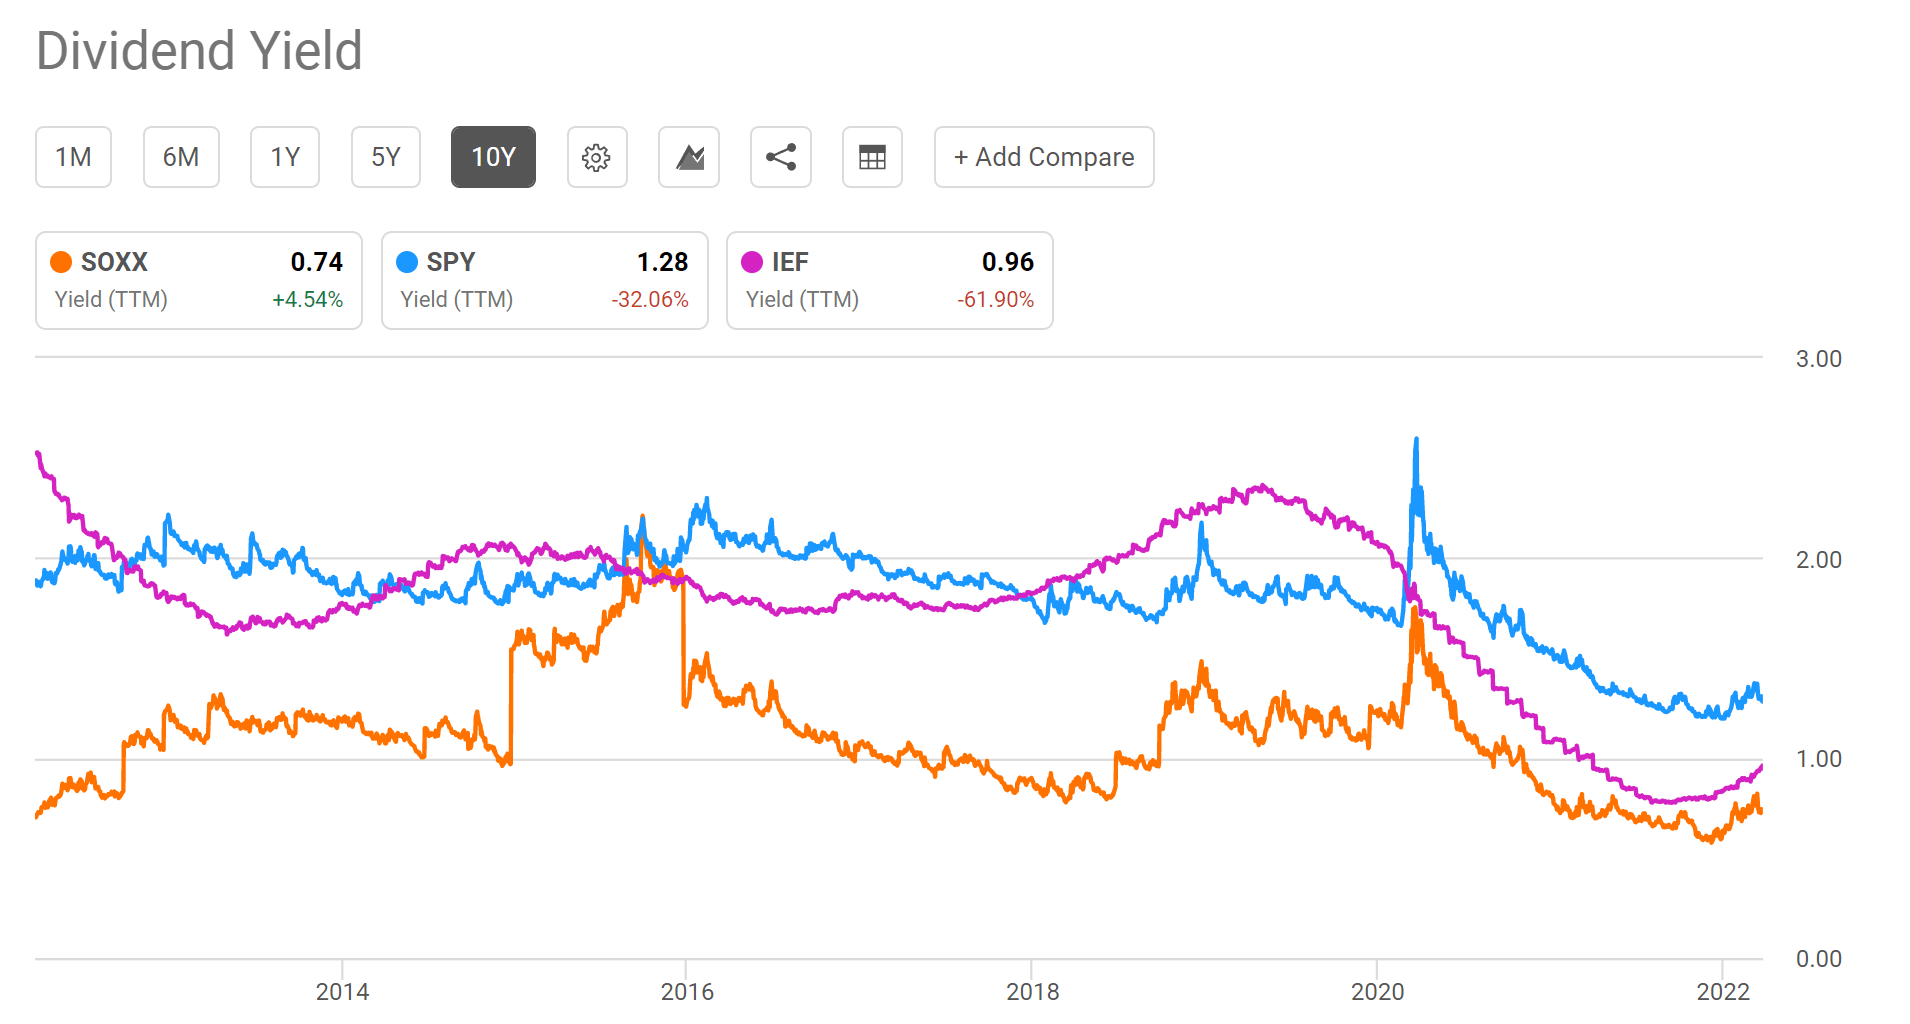
SOXX Vs. SPY – Yield spread analysis
The following chart shows the yield spread between SOXX and SPY. The dividend yield is calculated using the TTM dividends and based on quarterly averaged prices. As can be seen, the spread is negative because SOXX has consistently paid a lower dividend yield than SPY in the past. Furthermore, you can see that the spread is bounded and tractable most of the time. The spread has been in the range between about -0.4% and -1.2% the majority of the time during the past decade. Such a tractable YS suggests that when the spread is near or above -0.4%, SOXX is significantly undervalued relative to SPY (i.e., I would trade SPY for SOXX). These are times when SOXX are severely undervalued relative to SPY. And vice versa.
You can see the screaming buy signal for SOXX in 2016 when the yield spread surged – and this is why this dashboard is the first thing we look at when we make our investment decisions.
As of this writing, the spread is close to the average of the historical range as you can see, suggesting that SOXX is fairly valued relative to SPY (despite the fact that SOXX trades at about 20% premium above SPY in terms of PE multiples).
Author 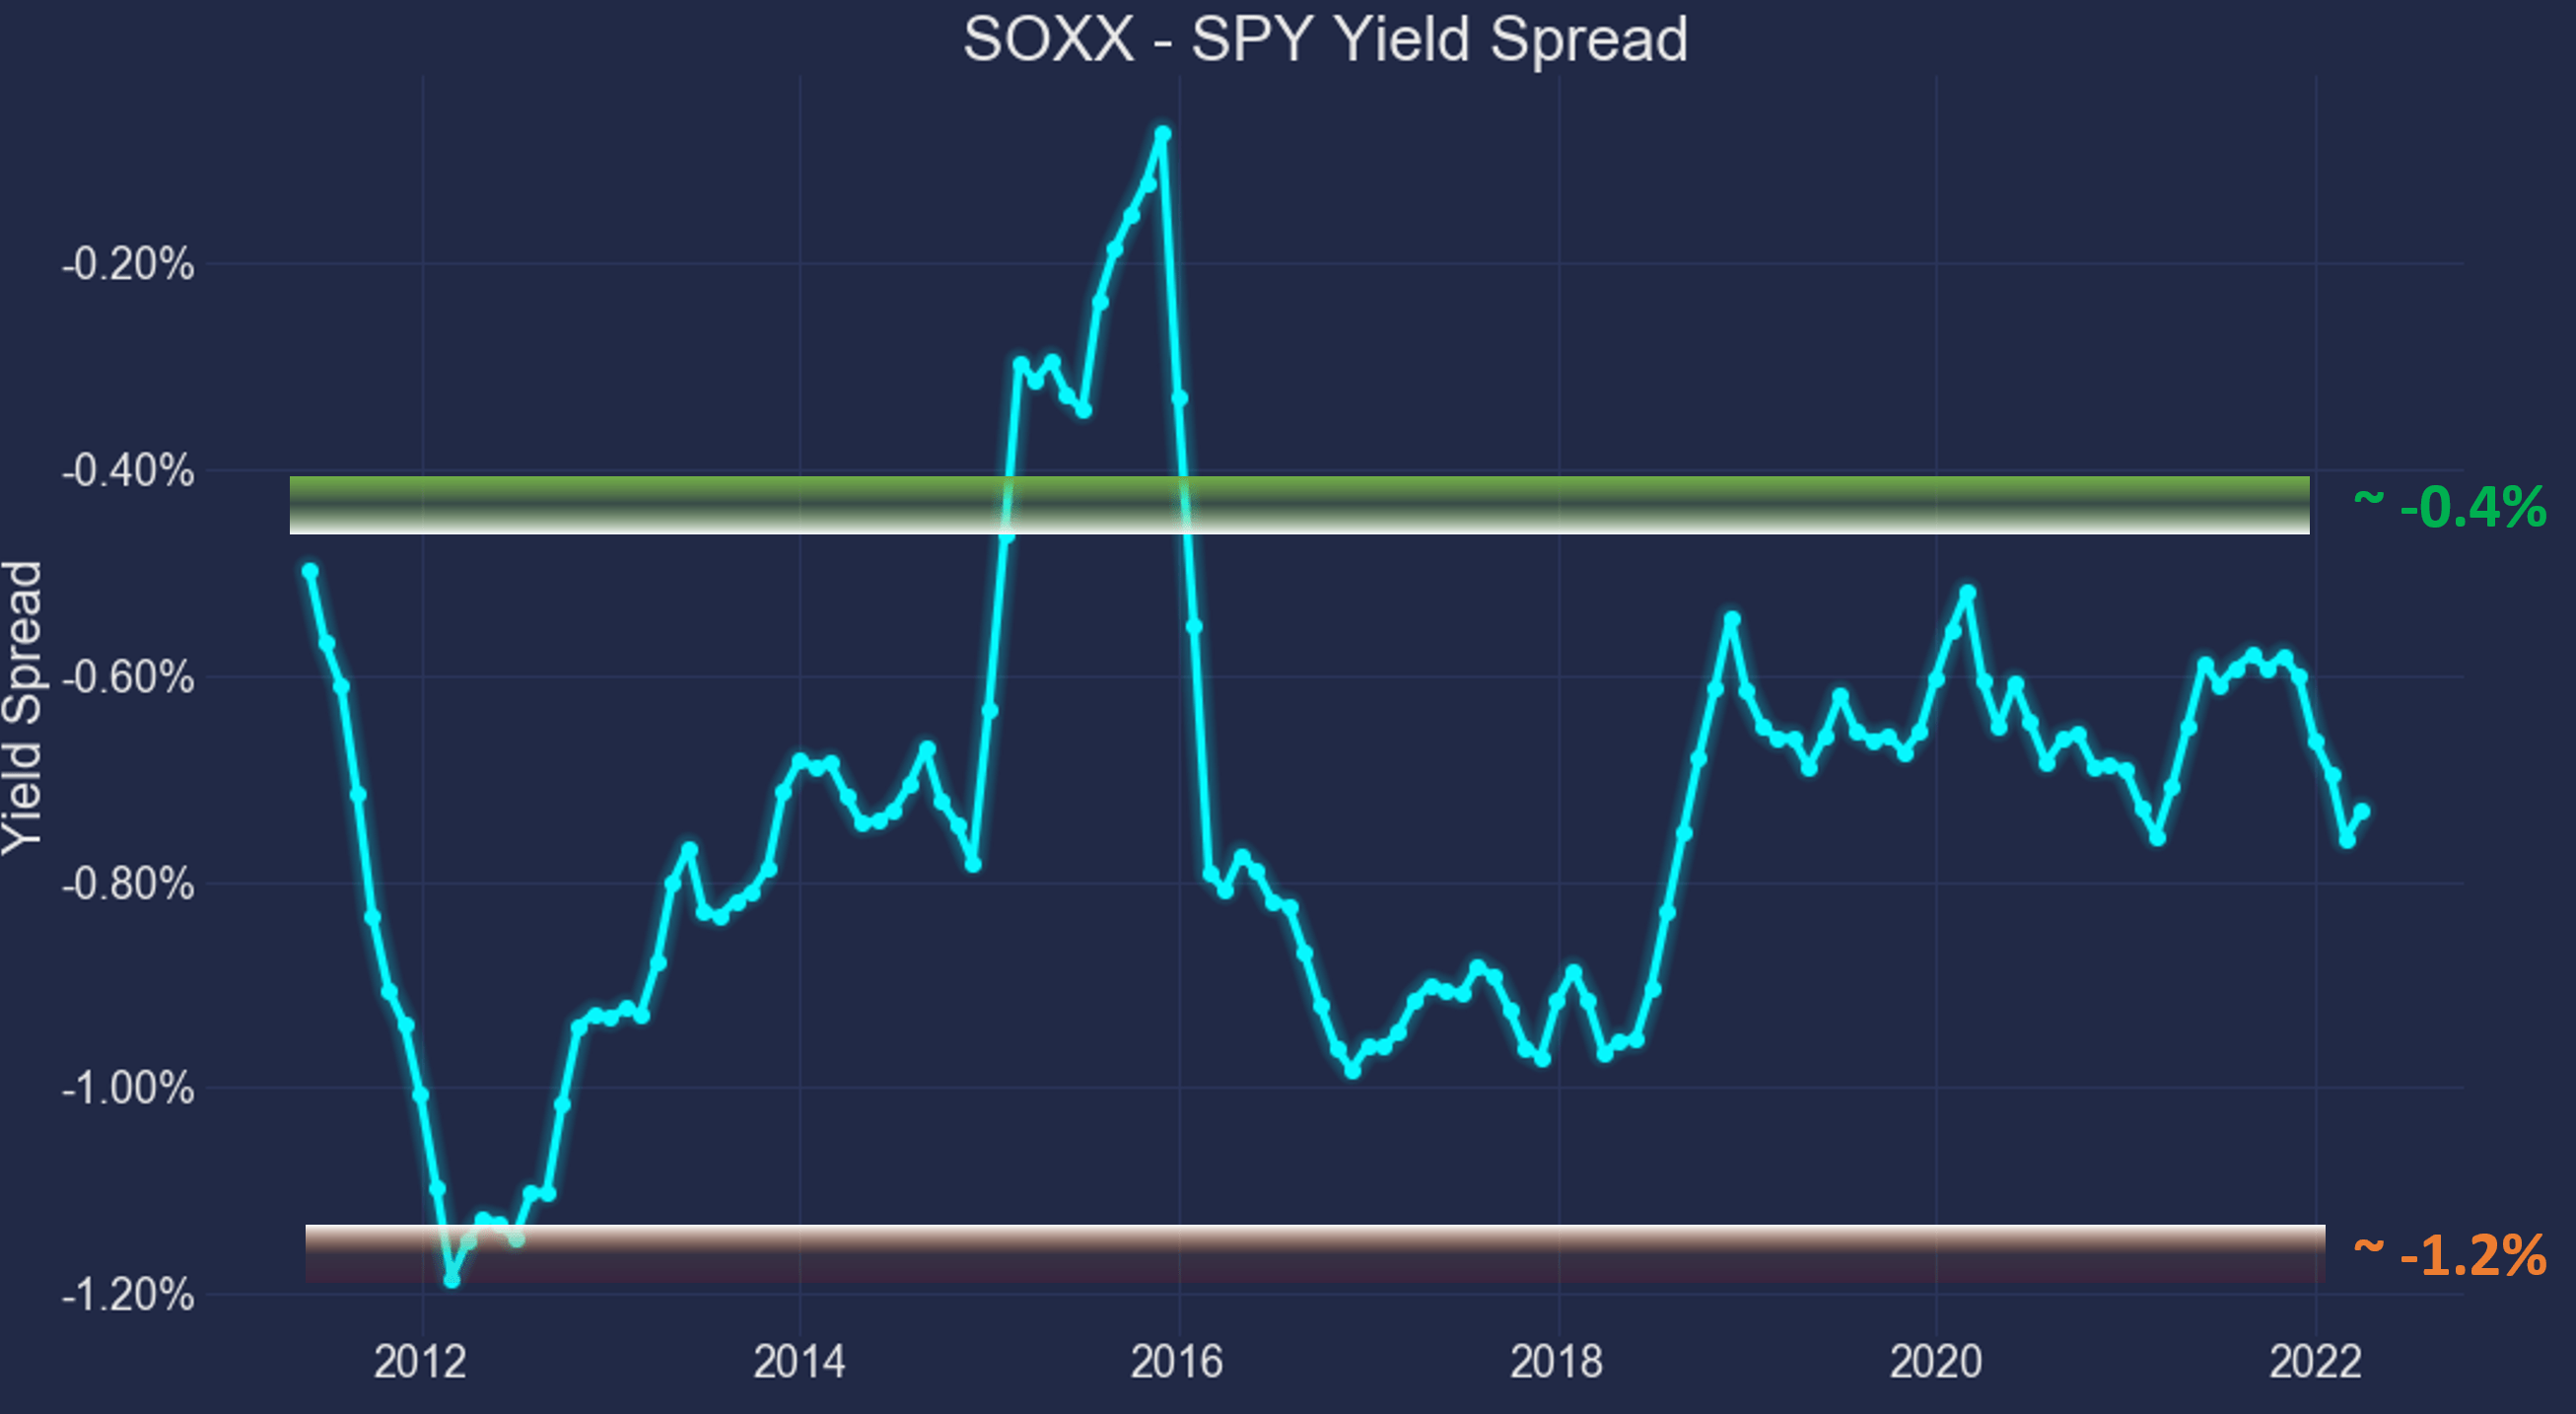
For readers familiar with our analyses, you know that the short-term returns are closely correlated with the yield spread for funds or stocks that have demonstrated stable earning powers and dividends. And as you can see from the chart below, it is also true for SOXX and SPY. This chart shows the two-year total return (including price appreciation and dividend) from SOXX minus that from SPY when the purchase was made under different yield spreads. In other words, this chart shows the alpha from SOXX relative to SPY at different yield spreads.
You can see that there is a clear positive trend and the Pearson correlation coefficient is 0.44. You can also again see the screaming buying opportunities for SOXX in 2016 when the spread surged above the negative 0.4% level, as highlighted by the data points in the yellow box. All these data points featured large alphas relative to SPY in the next 1 year.
As of this writing, the yield spread is -0.54%. It is close to the average of the historical spectrum and signals that the valuation of SOXX and SPY are in line with each other.
Author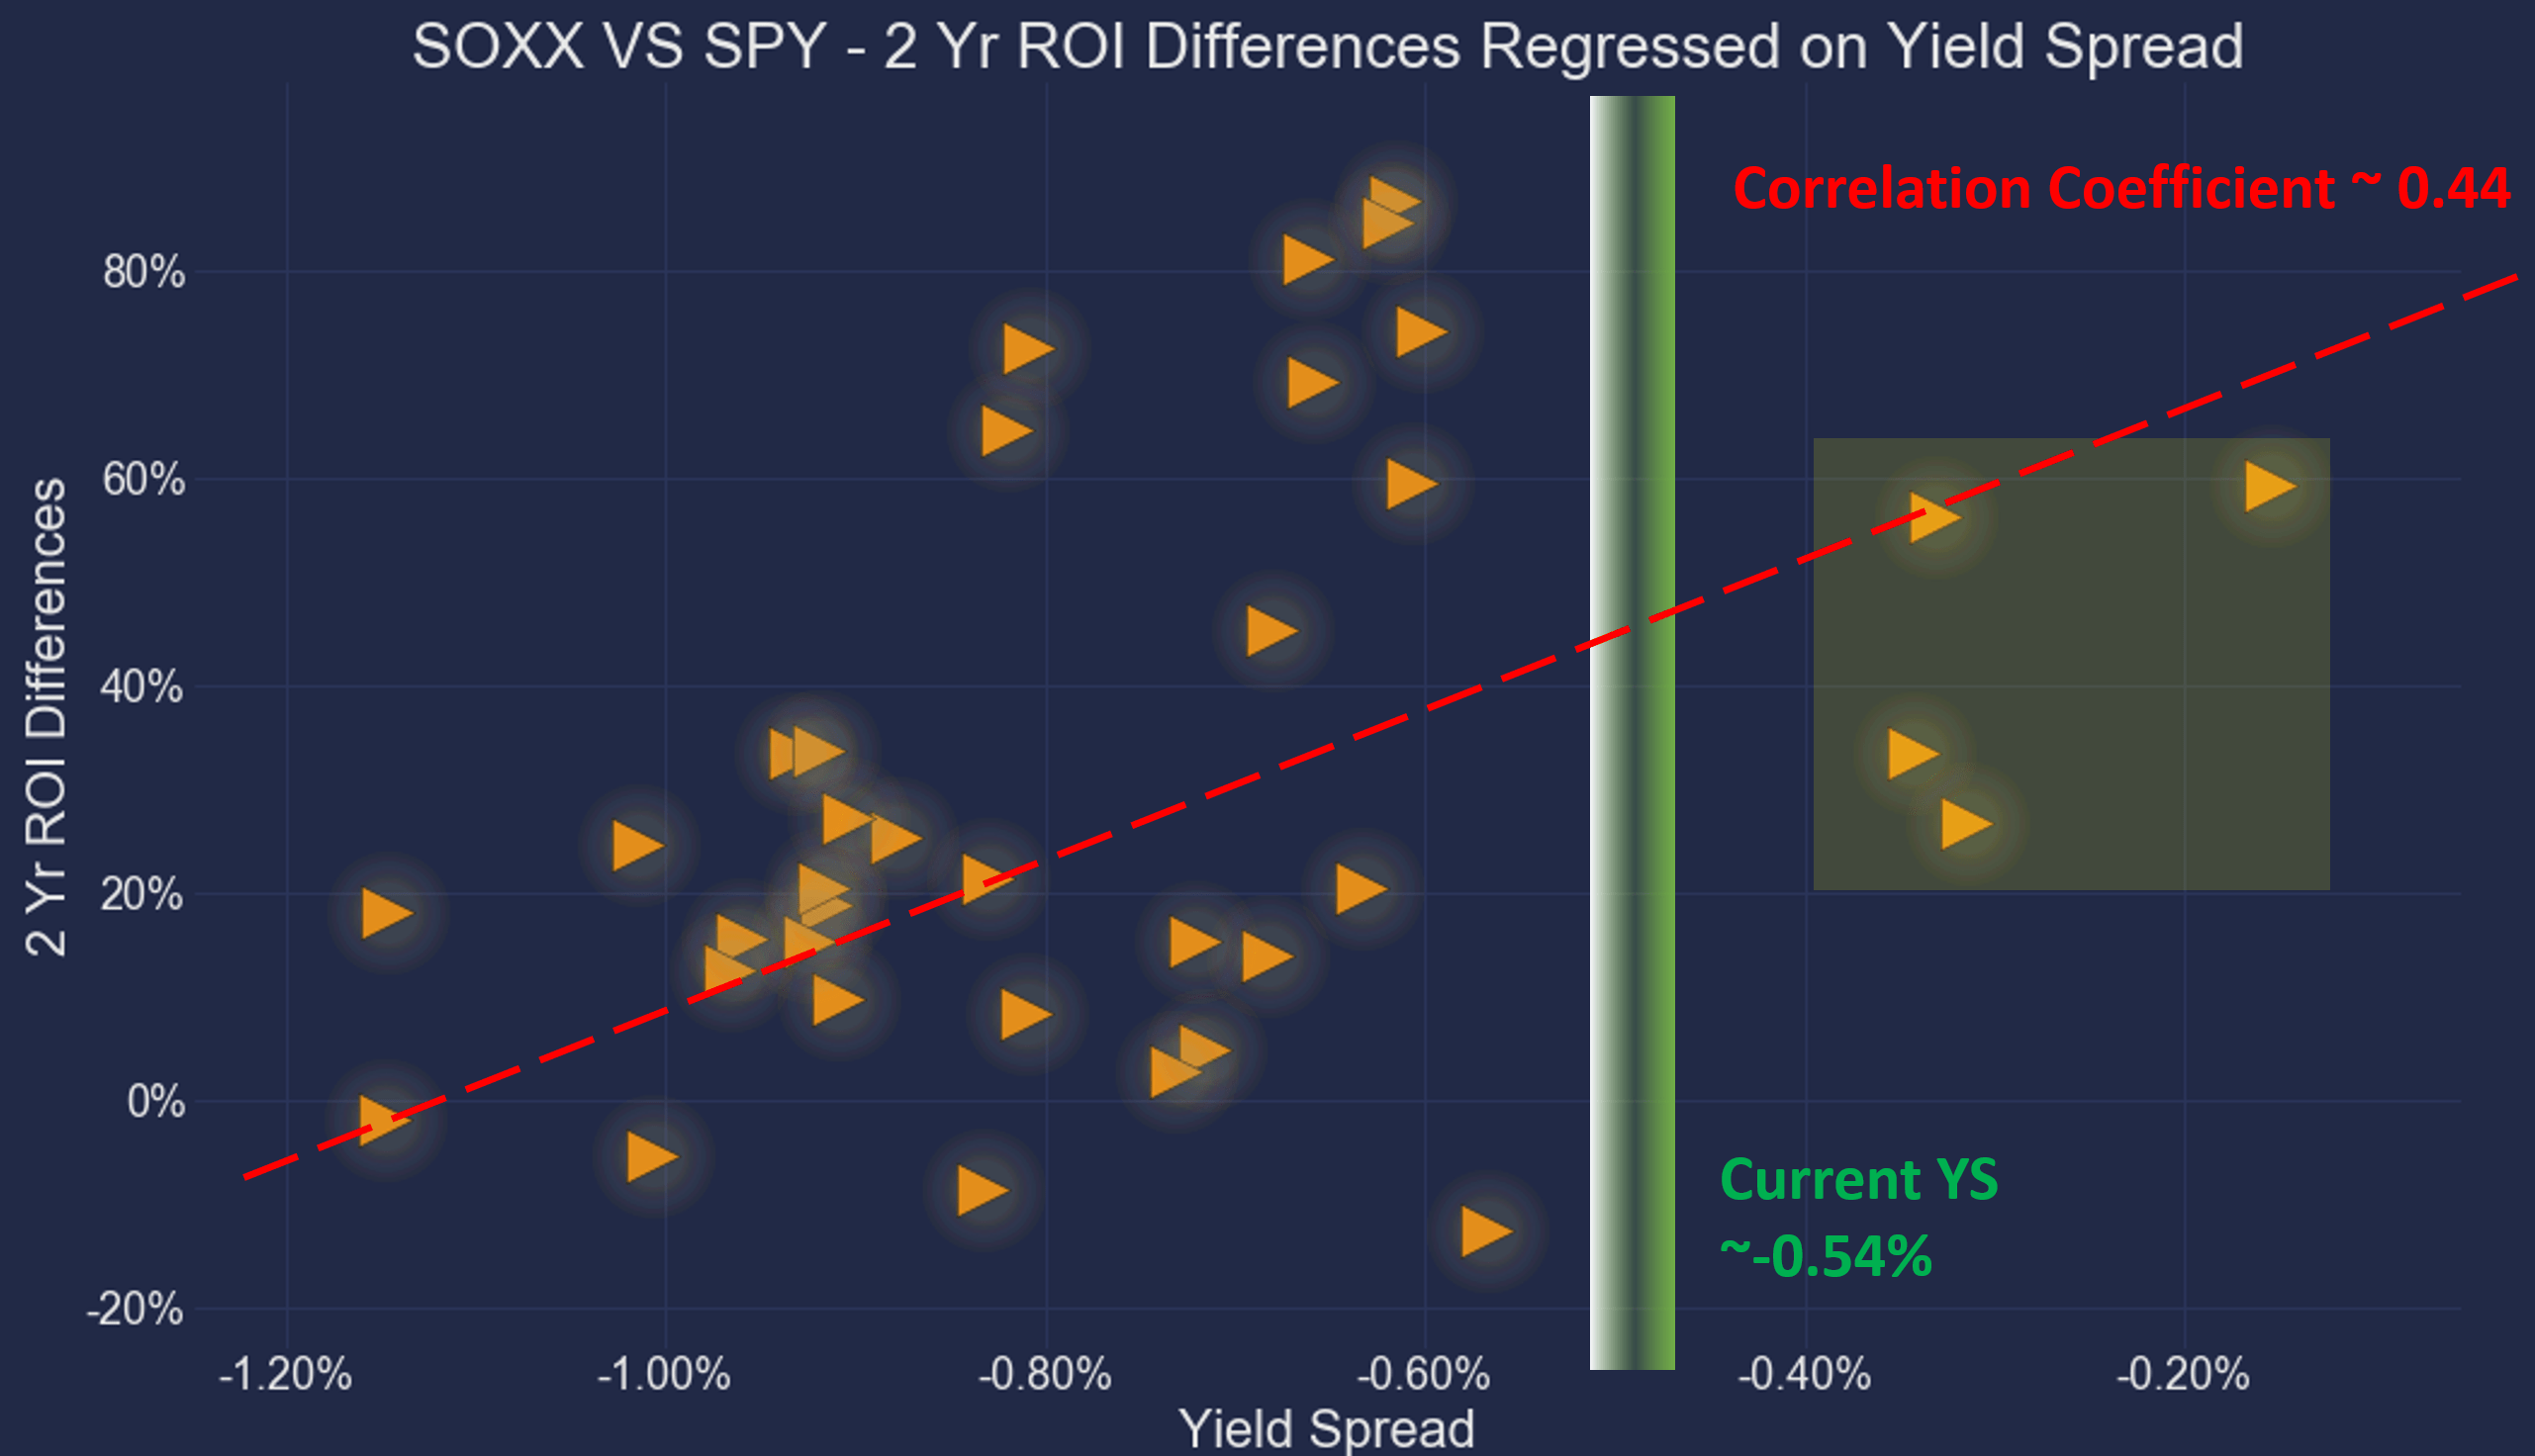
Summary and Risks
This article uses dividend payments to approximate the owners’ earnings from SOXX and SPY (or more precisely, the aggregated owners’ earnings from the stocks held in them). This analysis provides complementary information (or more insightful information in our view) to the commonly quoted PE multiples. In particular,
- PE only provides partial information or even misleading information because of the differences between accounting earnings and true economic earnings.
- Dividend yield spreads provide timeless intuition about valuation. No matter how times change, the yield spread relative to risk-free rates ALWAYS provides a measure of the risk premium investors are paying relative to risk-free rates. And similarly, the yield spread between two securities always measures their risk premium relative to each other.
- As of this writing, the spread of SOXX relative to SPY is close to the average of the historical range, suggesting that SOXX is fairly valued relative to SPY (despite the fact that SOXX trades at about 20% premium above SPY in terms of PE multiples).
Finally, we want to point out the risks of our approach before closing:
- Yield spread measures the RELATIVE risk premium and does not guarantee an ABSOLUTE positive return. It is a reliable method to accumulate more of the given securities (whether an equity or bonds) in terms of SHARES, but not in dollar amounts. The dollar amount worth is determined by both how many shares you hold (which the yield spread can help) and their prices (which the yield spread cannot predict).
- Second, as detailed in our earlier article, dividend yields do not always reflect business fundamentals due to several factors such as tax law, political climate, the composition of the market index, et al. As a result, we do not directly use the yield spread in our investment or asset allocation decisions. In practice, we first adjust for the above corrections and then use the adjusted yield spread in our investment decision. But the data and approach illustrated here is the first place we check.
Be the first to comment