

Galeanu Mihai/iStock via Getty Images
Thesis
Recent price corrections, combined with dramatically lowered volatilities, have created opportunities to consider investment allocation towards funds seeking more aggressive growth. For example, both the Invesco QQQ ETF (NASDAQ:QQQ) and the iShares Semiconductor ETF (NASDAQ:SOXX) have demanded a substantial valuation premium over the general market represented by the S&P 500 index. However, recent price corrections contracted their PE multiples. To be more specific, SOXX lost a total of 29.11% YTD as you can see from the following chart. And QQQ lost 26.11%. In contrast, the overall market (represented by SPY) lost “only” 13.3%. Due to such price divergence, their valuations are either in line (in the case of QQQ) or at a heavy discount (in the case of SOXX) compared to the S&P 500 index. And we further detail their valuation metrics and the implications later.
Source: Seeking Alpha data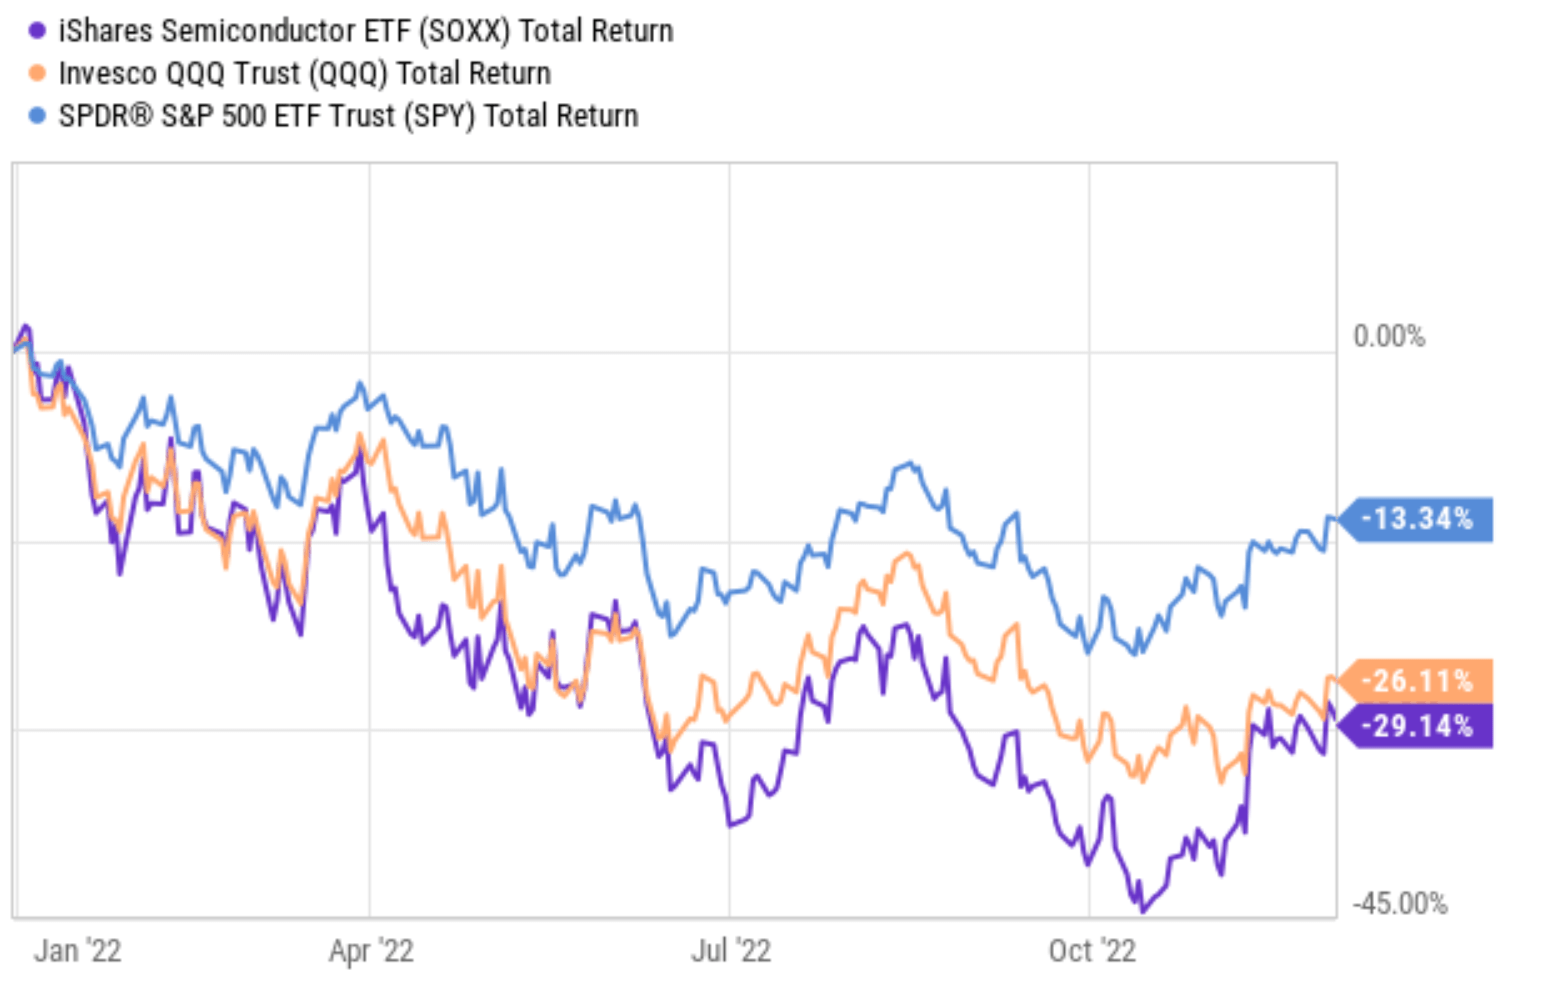
In addition to the above valuation contraction, the market volatility has also quieted down tremendously in the past year with inflation abating and Fed’s tone becoming more moderate. As seen from the next chart, the volatility index (“VIX”) has subdued from a peak level of 35+ to the current level of ~19x only. To provide some reference data points, a VIX of 35 corresponds to the top 96.2% percentile of historical VIX. In contrast, a VIX of 19 corresponds to the 59.9% percentile (i.e., close to the average VIX). As detailed in our earlier article, a low VIX provides a signal to increase exposure toward more aggressive stocks.
Next, we will dive in and examine SOXX and QQQ more closely. And more importantly, you will see why we see now as a good time to step up from QQQ and consider SOXX.
Source: Author based on Yahoo data
SOXX vs QQQ: basic information
QQQ perhaps needs no introduction at all. I will just point out that, even though it is probably the most popular “tech” ETF, the majority of its holdings are actually non-tech and I will revisit this in a later section.
SOXX needs a bit more introductions. It’s a much smaller fund than QQQ ($5.6B AUM vs. QQQ’s $151B). SOXX seeks to track the semiconductor sector as detailed in the fund description:
The iShares Semiconductor ETF seeks to track the investment results of an index composed of U.S.-listed equities in the semiconductor sector. It provides exposure to U.S. companies that design, manufacture, and distribute semiconductors and targeted access to domestic semiconductor stocks. It is used to express a sector view.
Source: Vanguard data Source: Vanguard data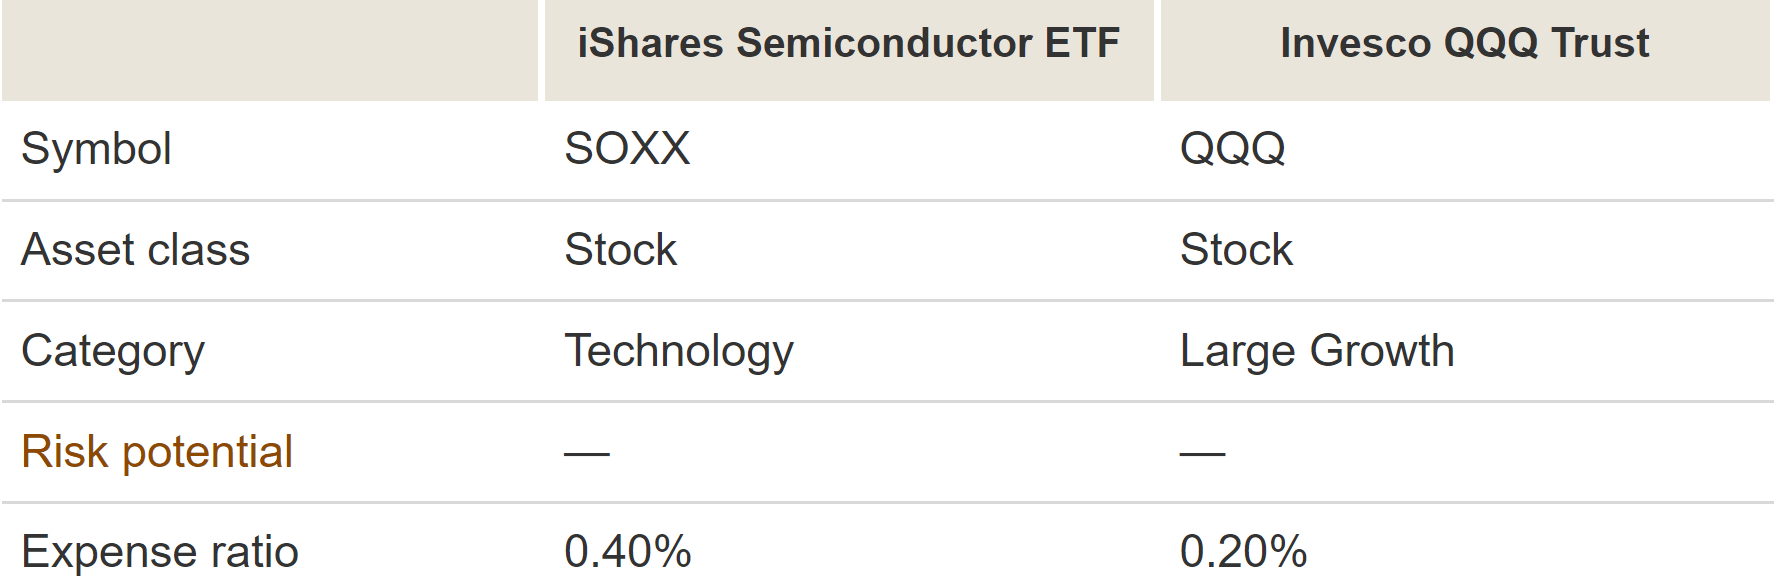

Historical performance
Both funds have outperformed SPY in the past as seen in the next figure. Note that the time period was constrained from Aug 2001 to Nov 2022 by the available data for SOXX. During this period, SOXX has returned a CAGR of 9.72%, and QQQ a CAGR of 10.93%. And both have handily outperformed the overall market’s 8.23% CAGR by a margin of 1.5% and 2.7%, respectively.
Although the outperformance comes at the cost of high volatilities. Their YTD performance also provided a sample of their larger volatilities (about 2x the corrections compare to SPY YTD). In the longer run, the picture is about the same, or probably with even more dramatic contrast. As seen, SOXX’s standard deviation is 27.9%, almost 2x higher than SP 500’s 15.1%. QQQ’s standard deviation is about 20%, almost 1/3 higher than SP500.
Source: Portfolio Visualizer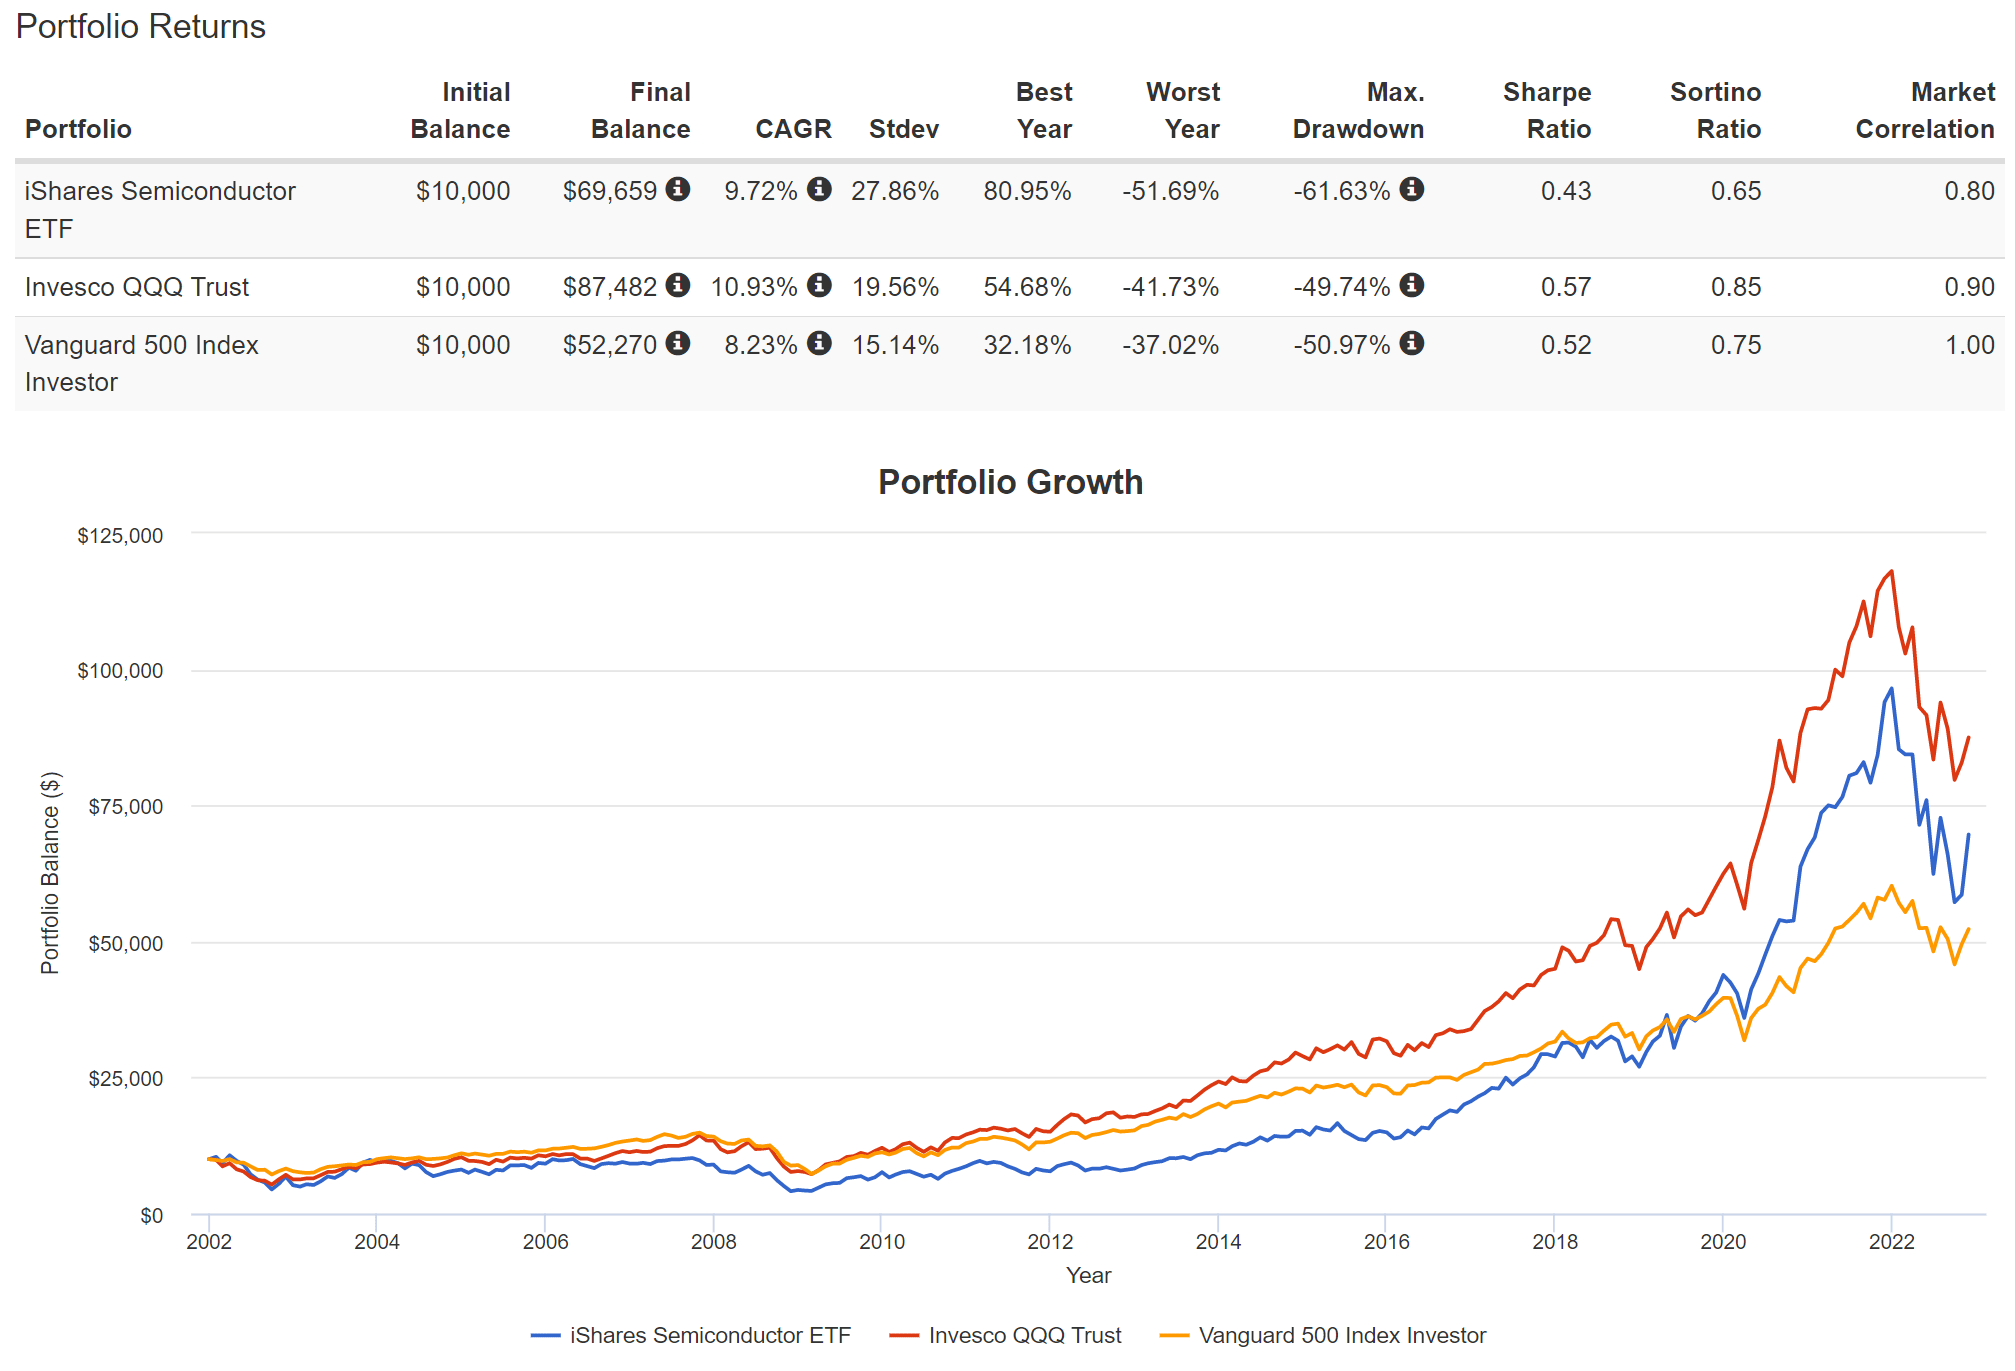
Finally, SOXX investors should not be discouraged by the lag of SOXX compared to QQQ during this period. A large reason for the lag is the choice of the specific timeframe. As you can see from the following chart, over a different number of time frames, SOXX has outperformed QQQ by a large margin. To wit, it outperformed QQQ by about 3% over a 3-year span (~15.9% CAGR vs QQQ’s ~13%), by about 2.5% over a 5-year span (~16.3% CAGR vs QQQ’s ~13.8%), and by more than 6% over a 10-year span (~21.4% CAGR vs QQQ’s ~15.7%).
And next, I will argue that A) both SOXX and QQQ’s past outperformance over SPY, and also B) SOXX’s outperformance over QQQ are very likely to repeat in the years to come under current conditions
Source: Vanguard data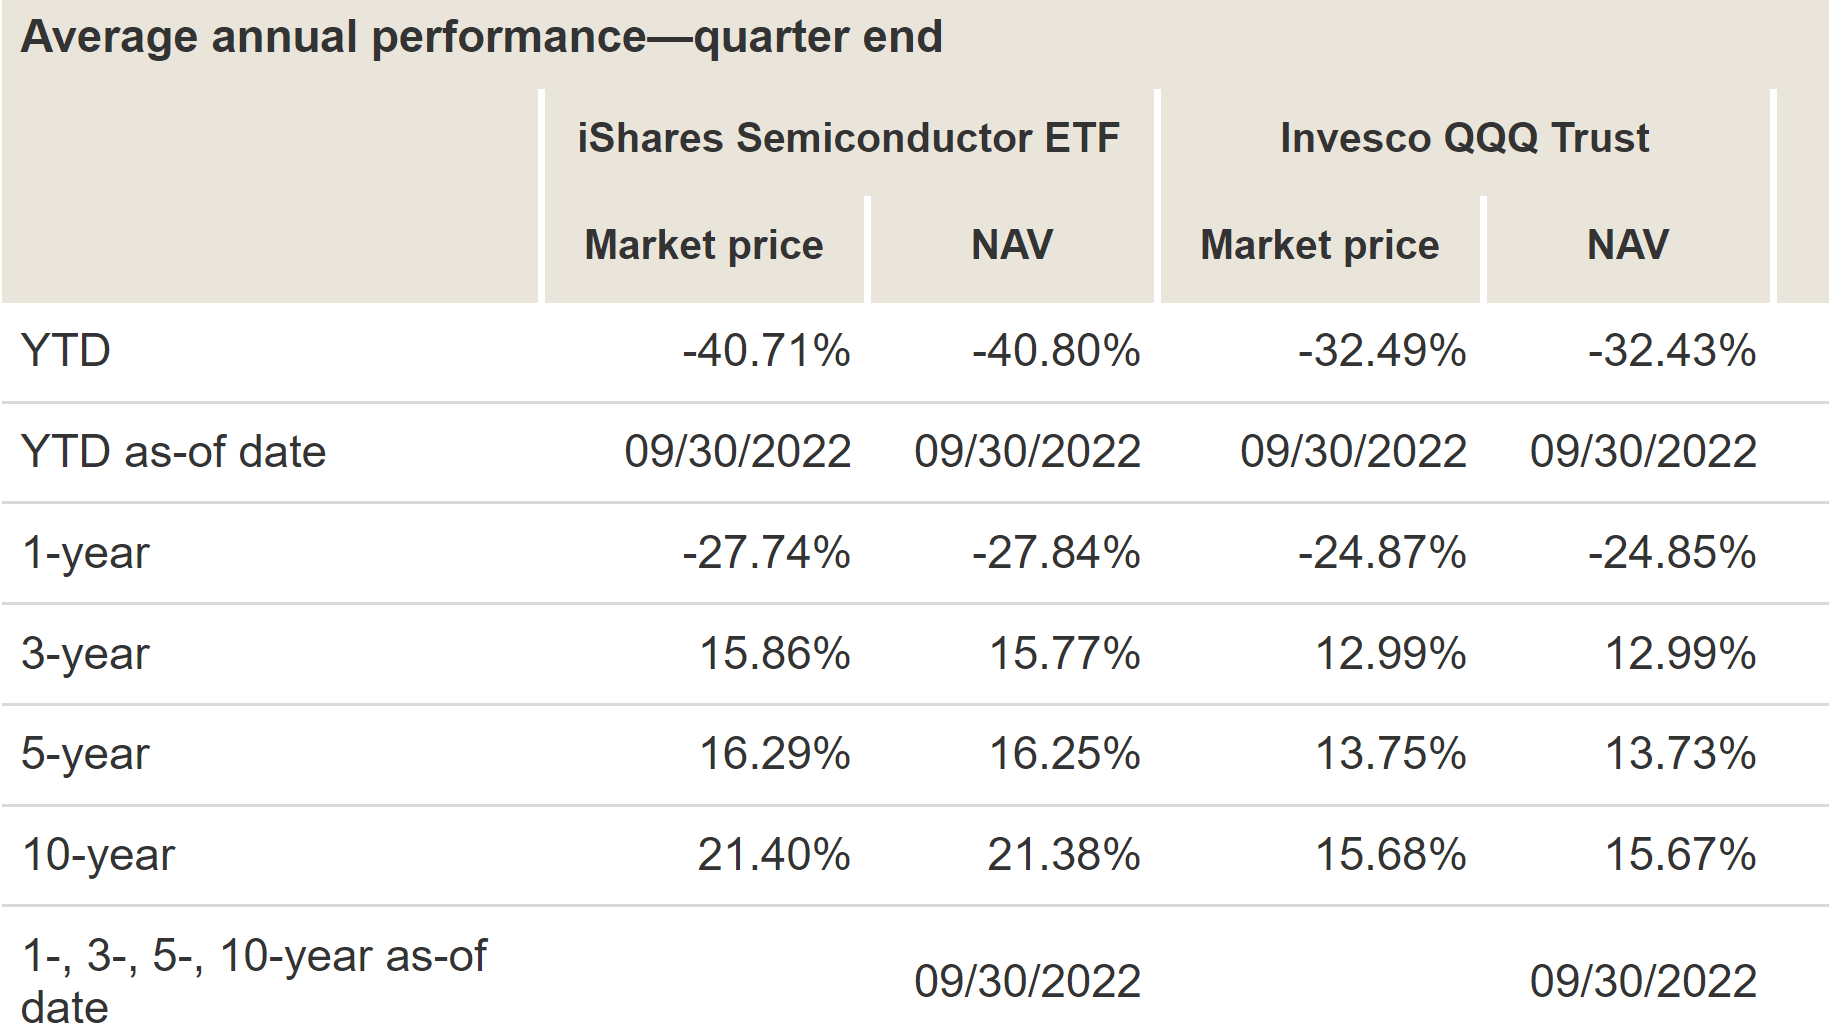
SOXX is more tech oriented than QQQ
QQQ tracks the largest 100 NON-FINANCIAL stocks listed on the Nasdaq. Many of these stocks are non-tech as seen in the following figure. To wit, infotech is slightly less than 50% (49.86% to be exact) of QQQ’s assets. Its other largest exposures include telecommunication services (17.7%), consumer discretionary (14.9%), and consumer staples (6.67%). It even holds some industrial stocks (3.39%) and utility stocks (1.42%). In stark contrast, SOXX’s exposure is exclusively in the semiconductor sector. About 80% of its assets are in semiconductor stocks. And the rest 20% are in related equipment.
Source: SOXX and QQQ fund description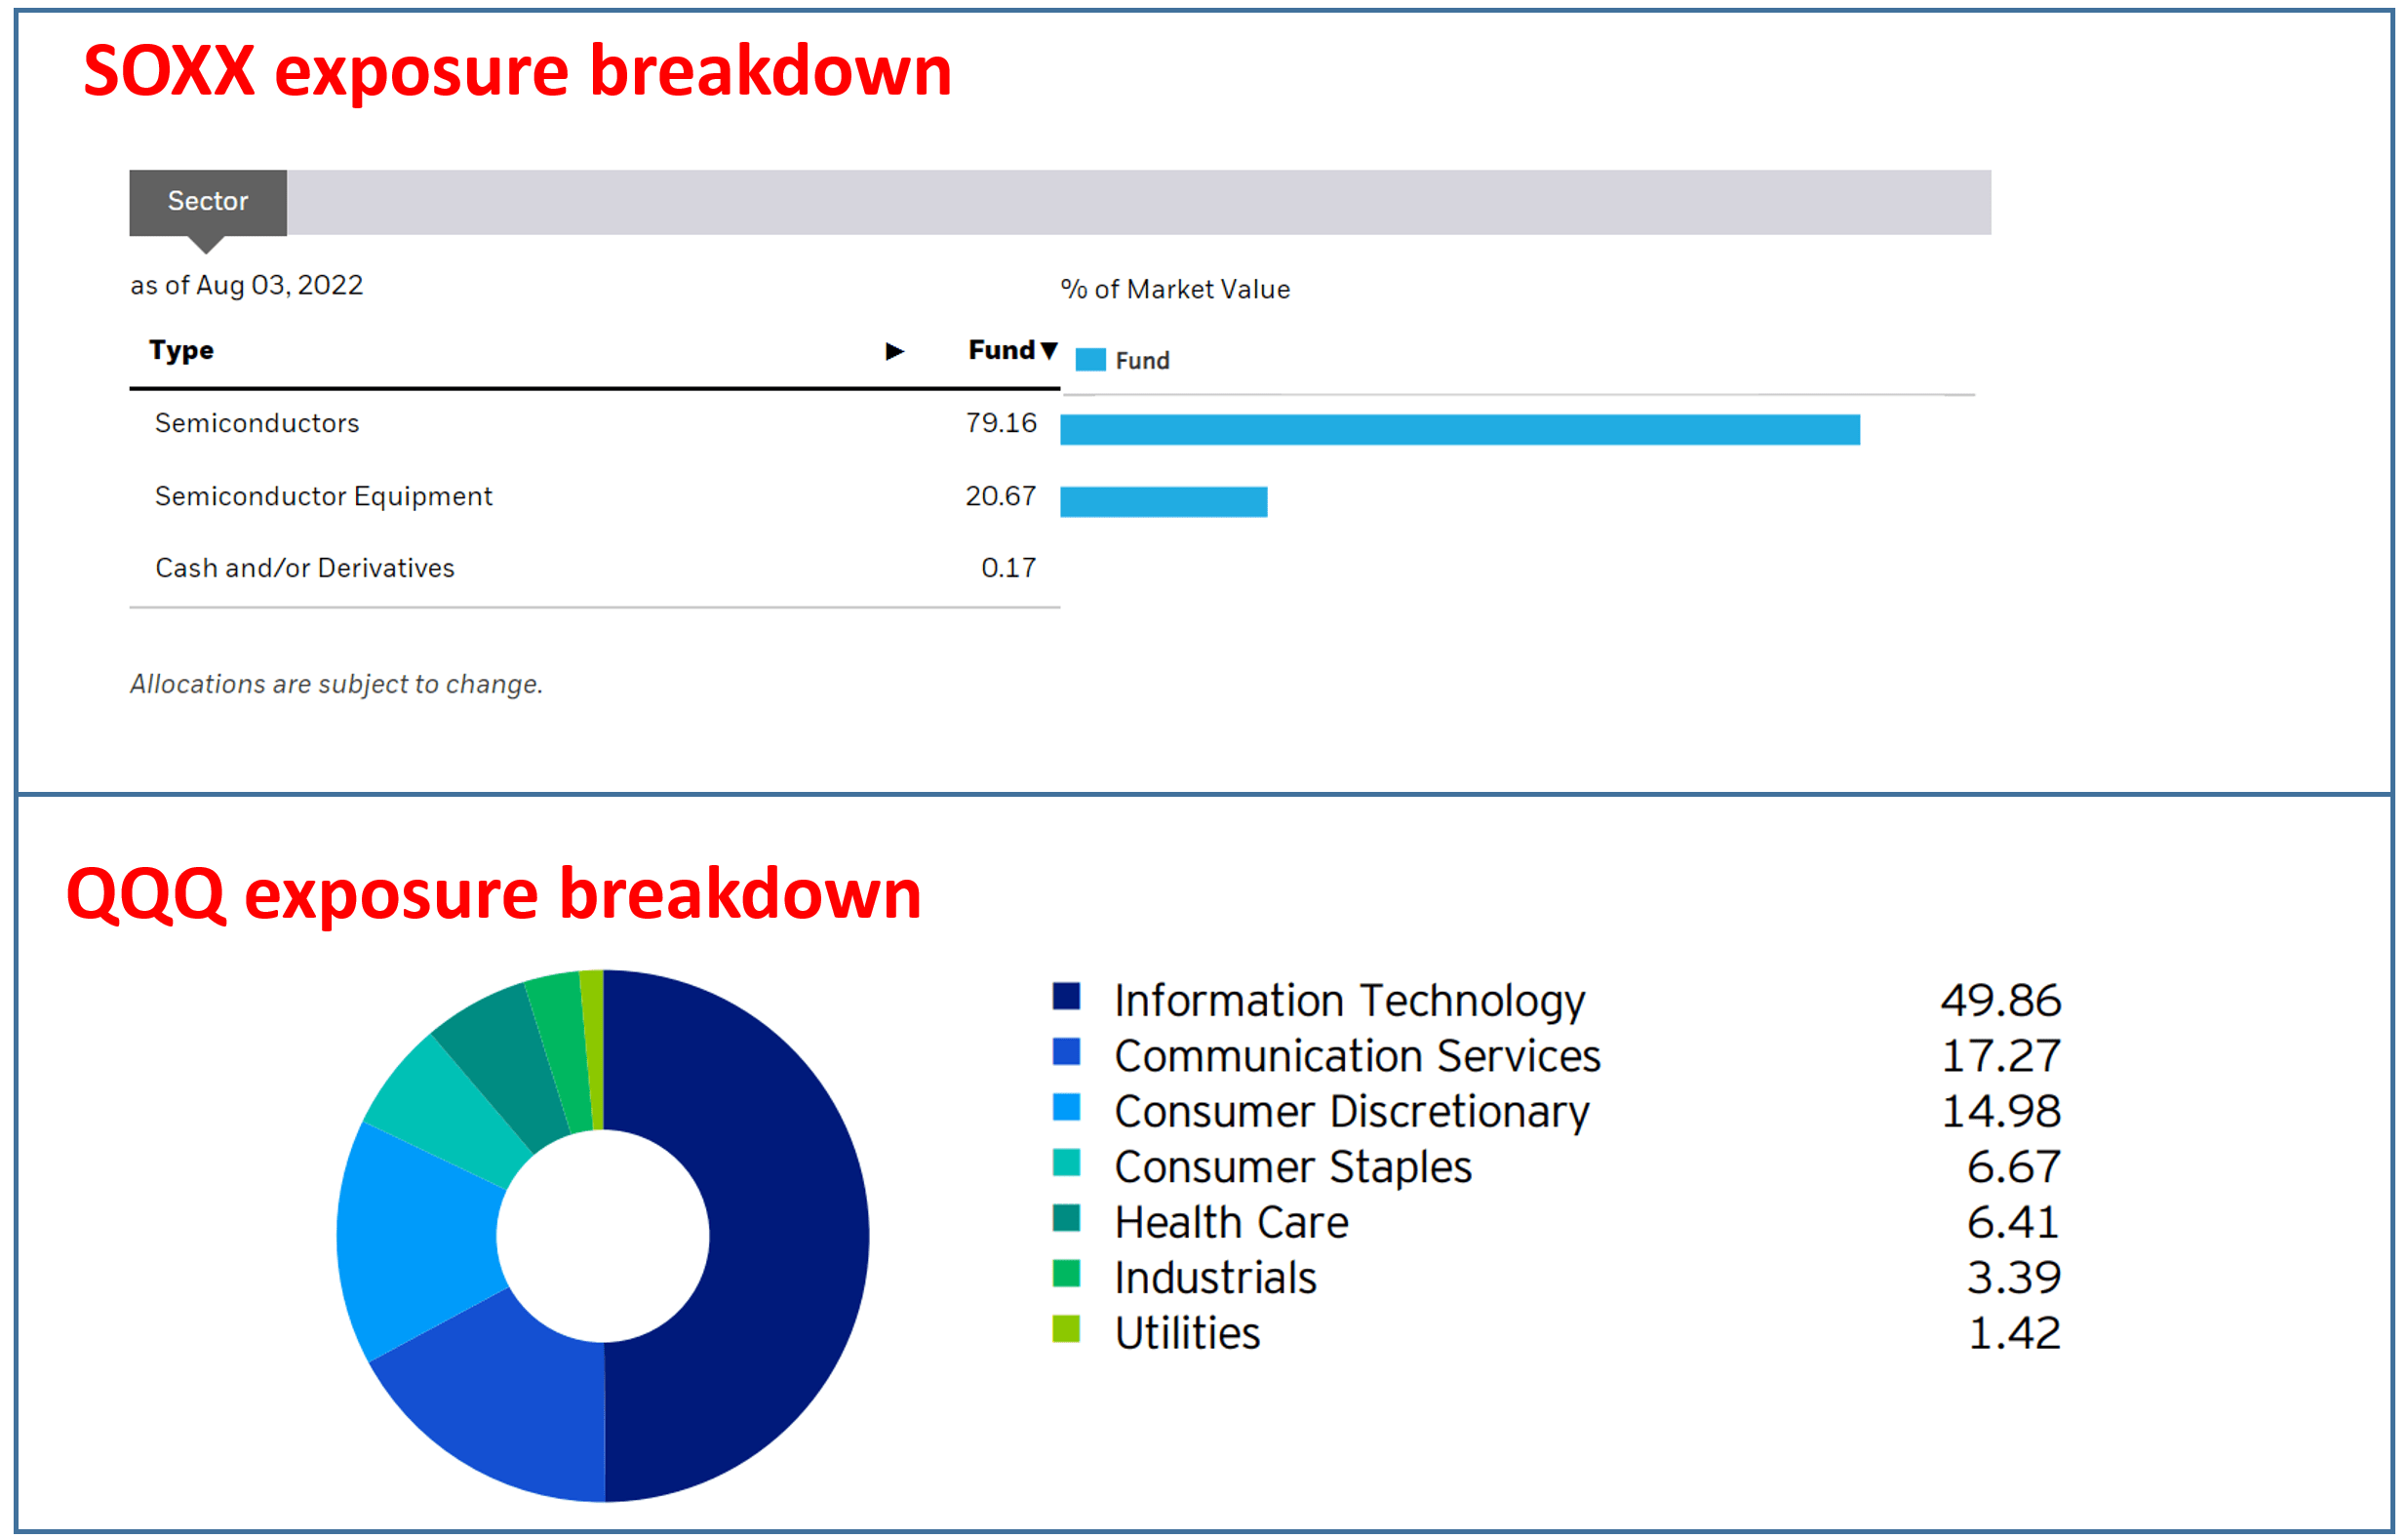
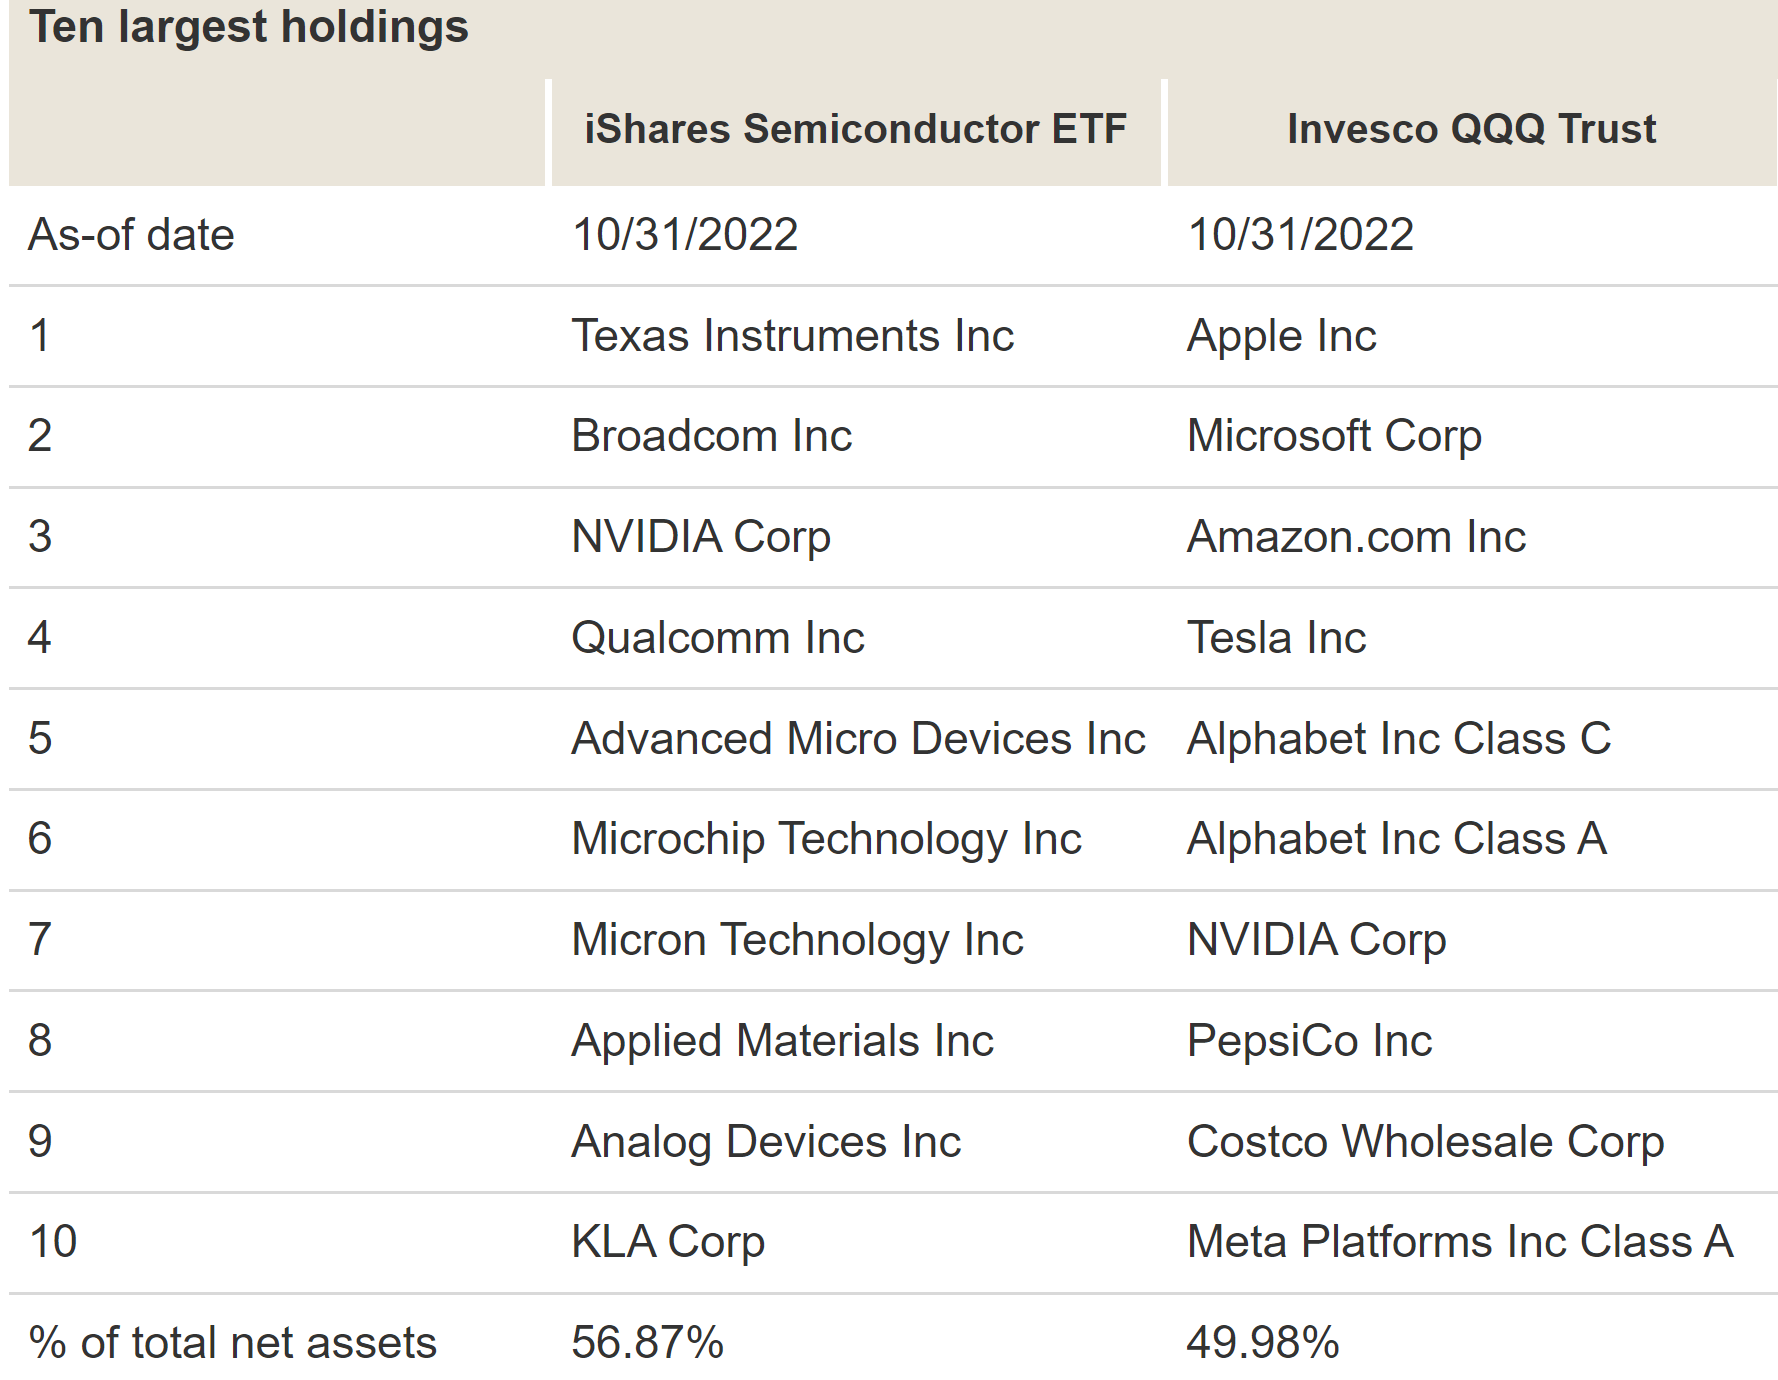
Moreover, SOXX’s exposure is also top-heavier and more concentrated than QQQ. It holds a total of 32 stocks only compared to QQQ’s 102 in the next chart below. The top-heavy and concentrated nature of its holdings is even more vividly displayed in the second chart blow by their 10 largest holdings. Only 1 holding, Nvidia (NVDA), overlaps among their 10 largest holdings. The rest of QQQ’s top 10 holdings are spread over various sectors like general technology (the FAMMG), EV (TSLA), and also stables (COST and PEP). While all SOXX holdings are in the high-tech semiconductor sector. Also, SOXX’s top 10 stocks represent a total of 57% of the total assets, about 7% above QQQ.
Despite SOXX’s exclusive exposure to high-tech stocks, its valuation is currently at a significant discount from QQQ, as we will see next.
Source: Vanguard data Source: Vanguard data
SOXX vs QQQ: profitability and valuation
As mentioned above, SOXX has historically traded at higher valuations above both S&P 500 and QQQ, and such valuation premiums come at good reasons as you can see from the following chart (data in this chart are compiled from Yahoo! and also Vanguard). As seen, SOXX features a net profit margin that is about 10% higher than QQQ (20.8% vs 19.6%) and a similar ROE (about 24.7%). And SOXX’s earnings are also projected to grow at a higher rate of 22.4% than QQQ’s 20.2% (i.e., about 10% more rapid growth in relative terms).
Despite SOXX’s superior growth and profitability metrics, its current valuations are at a fraction of QQQ and also the S&P 500. To wit, its PE sits at 15.40x only, below QQQ’s 23.60x more than 1/3 (35% to be exact). Its price/cash flow multiple is even lower (11.96x) and more discounted from QQQ by almost ½. Its P/BV and P/S ratios are both lower than QQQ by a large margin also (33% and 31% discount, respectively).
With a combination of such a large valuation divergence and higher growth potential, I won’t be surprised if SOXX outperforms QQQ by 10% CAGR in the next 5 years. The faster growth would contribute about 2% outperformance and a valuation reversion from its current PE of 15.4x to QQQ’s current PE of 23.6x would contribute another 8%.
Source: Author based on Yahoo and Vanguard data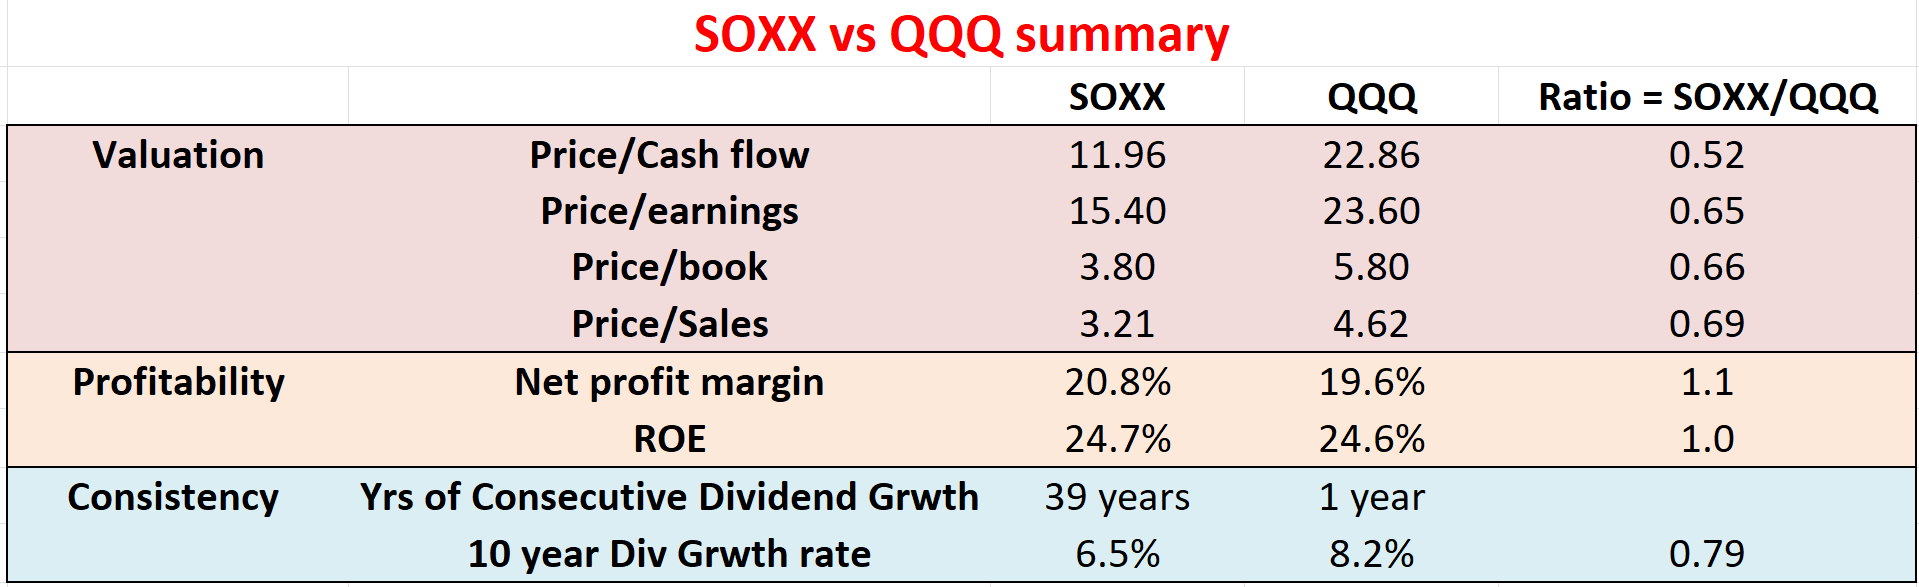
Final thoughts and risks
There are risks to both funds. As mentioned earlier, both QQQ and SOXX have suffered much higher volatility risks in the past than the overall market. In the longer term, SOXX’s standard deviation is almost 2x higher than SP 500, and QQQ is about 1/3 higher than SP 500. Between SOXX and QQQ, SOXX charges an expense ratio (0.4%) that is 2x higher than QQQ (0.2%). Finally, if you recall from an earlier chart, SOXX’s turnover ratio is almost 4x higher than QQQ’s (32% vs. 8.9%) and SOXX also has a higher exposure to foreign holding (about 13.6%) than QQQ (about 2.2%). These factors can generate tax implications for some accounts, and such tax implications can cancel off some of SOXX’s pretax outperformance.
To wit, if you recall the discussion in an earlier section, on a pretax basis, SOXX outperformed QQQ by about 2.5% over a 5-year span (~16.3% CAGR vs QQQ’s ~13.8%), and by more than 6% over a 10-year span (~21.4% CAGR vs QQQ’s ~15.7%). After taxes on distributions and the sale of fund shares are accounted for, as shown in the chart below, its lead shrank to 2.3% over a 5-year span and 5.3% over a 10-year span.
All told, recent valuation contraction and lowered volatilities give signals to long-term investors to increase exposure toward funds seeking more aggressive growth. And QQQ has never been a bad choice as a step up from SPY with its low fee, excellent liquidity, and broad exposure. however, under current conditions, my view is that SOXX offers an even more enticing choice for more risk-tolerated investors. I won’t be surprised if SOXX outperforms QQQ by 10% CAGR in the next 5 years due to its better profitability and growth curve (contributing about 2% to the outperformance) and its valuation reversion (contributing another 8% to the outperform).
Source: Vanguard data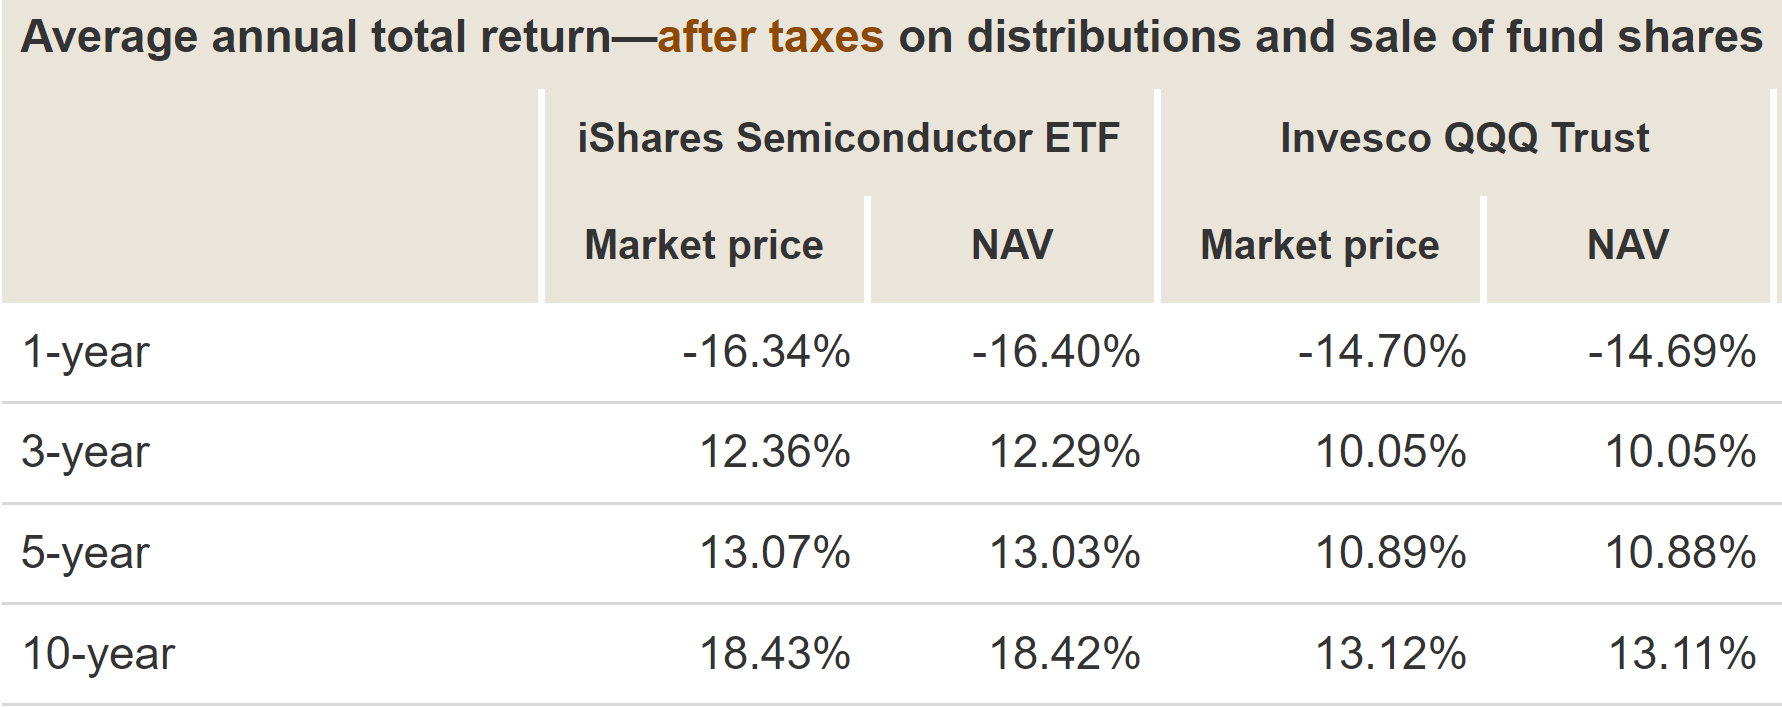
Be the first to comment