


Boyloso/iStock via Getty Images
(This article is a partial extract out of a piece that was published to subscribers on Nov. 14, 2022)
Back to Life, Back to Reality
Back to life, back to the present time
Back from a fantasy, yes
Tell me now, take the initiative
I’ll leave it in your hands, until you’re ready
Soul to Soul (here)
A bit of a background.
The original piece that this article is based on was published (to subscribers) on Nov. 14 and it was titled “Don’t Let The Recent (Stock Market) Altitude Distracts You From The (Economic) Icy/Slippery Path.”
Both the original title as well as the title of this article were picked in light of my recent trip to Nepal, during which I completed the “three passes” trek.
The image featuring this article is taken from the top of Gokyo Ri, a magnificent place from which you have a fantastic views on the mighty mountains surrounding you as well as on Gokyo (village and lake) below you.
I’m sharing this with you not only for you to better understand the context of the title/s, but mainly because this is a perfect metaphor for the theme of this article:
1) No matter how high we (or the markets) are – we mustn’t lose focus and we should always be aware of what’s lying/waiting below/underneath.
2) The higher we climb – the better the view/position we have/hold, allowing us to assess everything around us from a more favorable (view)point than the one we have at a low/er altitude.
3) The higher we climb – the more room we have to fall/lose. That calls for us to be even more vigilant of risks and unpleasant surprises that might be waiting for us ahead (and may not be visible from a low/er altitude).
——————————————————————————
I left you exactly three weeks ago and here’s how things (major gauges) have changed since:
| 3 weeks ago | Nov. 14 (4am ET) | |
| S&P 500 | 3752 | 3993 |
| Nasdaq-100 | 11310 | 11817 |
| UST2Y | 4.48% | 4.38% |
| UST10Y | 4.22% | 3.87% |
| Inflation/CPI | 8.2% Y/Y | 7.7% Y/Y |
| Core CPI | 6.6% Y/Y | 6.3% Y/Y |
| USD/DXY | 112 | 107 |
| Gold | 1657 | 1760 |
| Silver | 19.4 | 21.6 |
| Bitcoin | 19300 | 16700 |
| SBF wealth/FTX valuation | $16B/$32B | -/- |
There were some (significant) changes over these past three weeks. However (as a matter of fact) almost all these changes have occurred over the past two trading days that were ones for the history books.
Unique 48 Hours
Best-ever daily price return for the S&P 500 on a CPI release date since the US government began publishing consumer price index data in 1949.
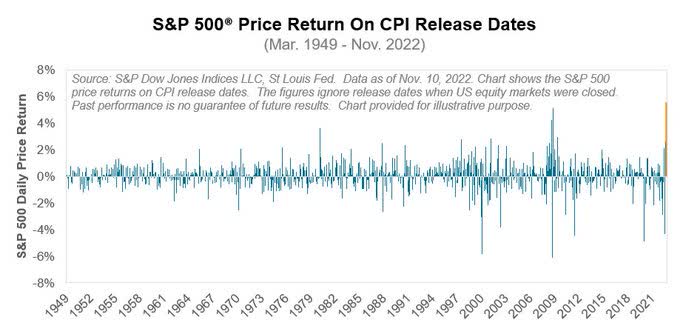
S&P Dow Jones Indices LLC
The US Dollar experienced its largest two day drop (4%) since 2008.
Only two other times were worse for the greenback back then (during GFC).
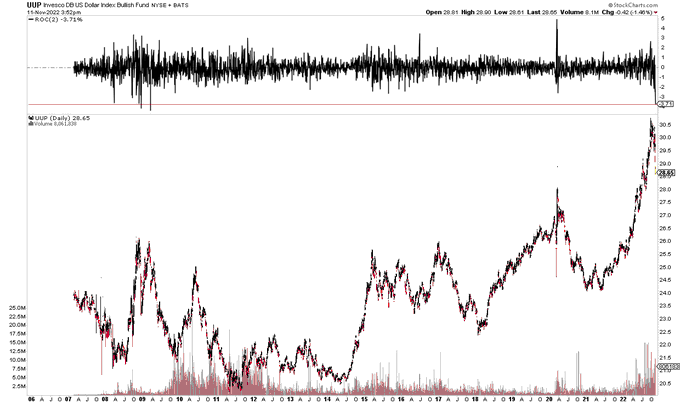
StockCharts
The Greenback broke the uptrend line that has been in place for the majority of 2022.
The strength in the US dollar has been putting pressure on stocks and risk assets all year, so this is exactly what the bulls have been waiting for.
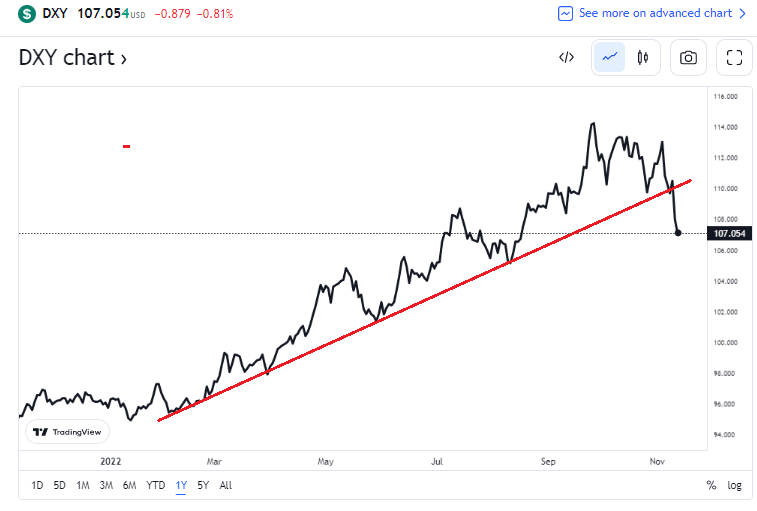
TradingView
Technically Speaking
Market breadth is (getting) strong/er in recent weeks. Nevertheless, investors still fear of a “breadth head fake” similar to the one we saw three months ago.
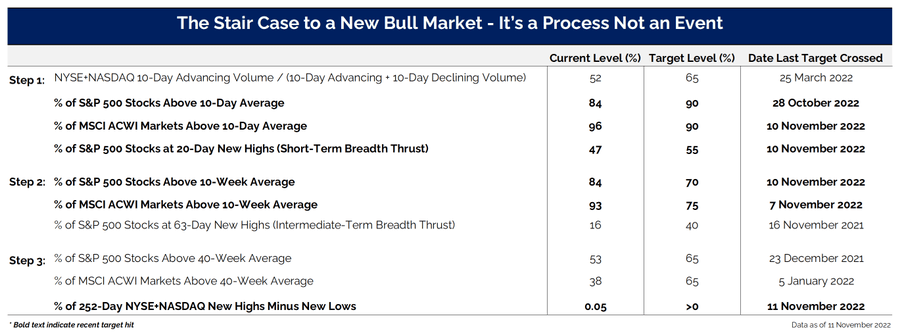
Grant Hawkridge
This can also be seen on various indices/levels:
- Percentage of S&P 500 (SP500) stocks that are trading above their 40-WMA
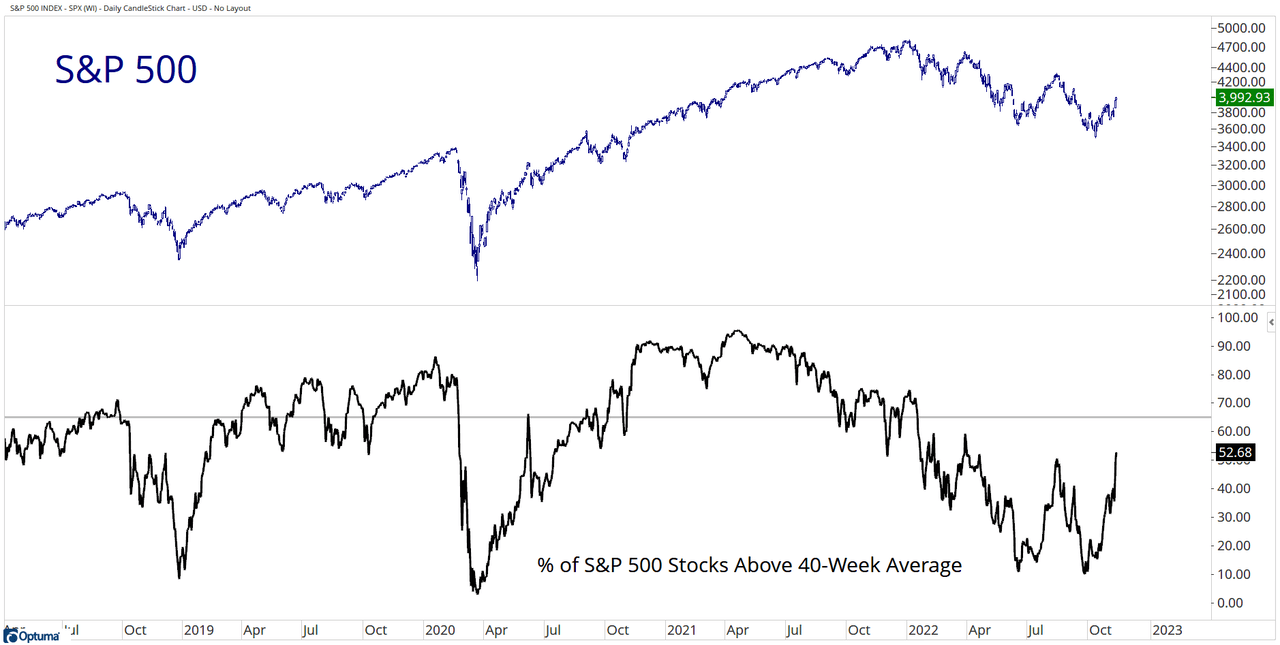
Optuma
- Percentage of NYSE+Nasdaq stocks making new highs vs those making new lows (over the past year, this gauge rarely and briefly made it above the flatline).
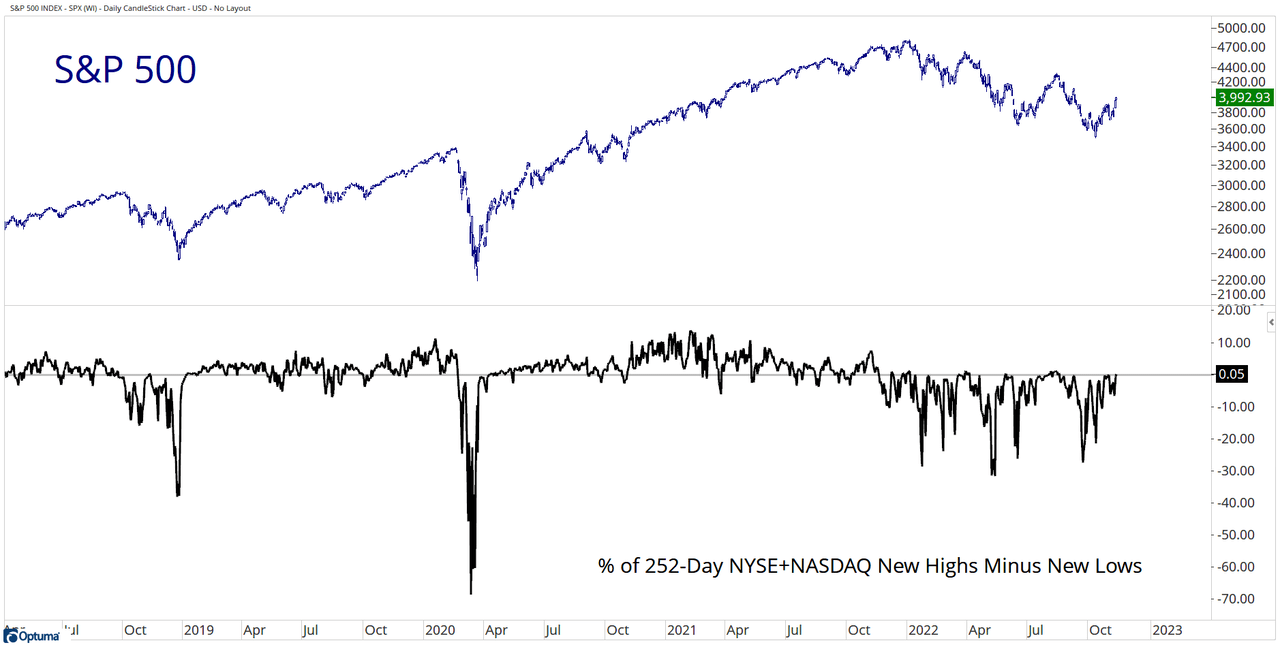
Optuma
- Percentage of MSCI ACWI (ACWI) stocks that are trading above their 40-WMA
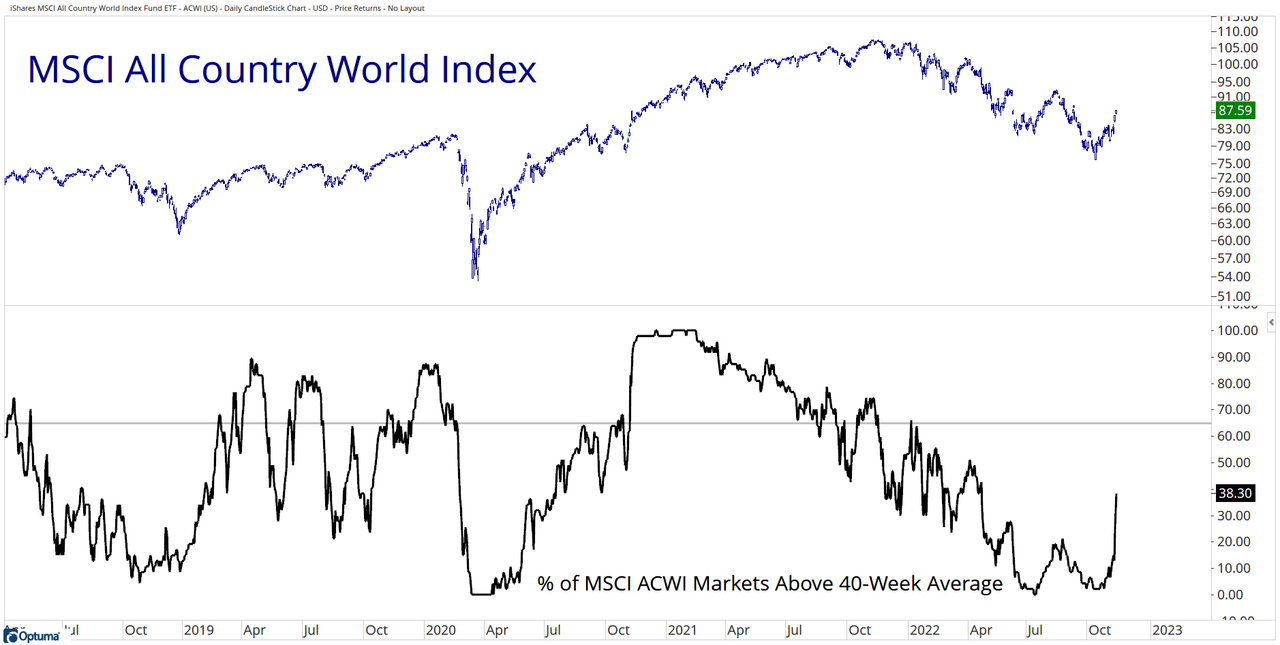
Optuma
On one hand, fewer stocks made new lows last week than the prior week (bullish signal).
On the other hand, and despite the unprecedented 48-hour surge in the indices, fewer stocks made new highs (bearish signal).
Overall, we continue (49 out of 51 of the past weeks) to see new lows that are greater than the new highs (a bearish signal on a net basis).
That’s not the type of behavior you (wish to) see in a bull market!
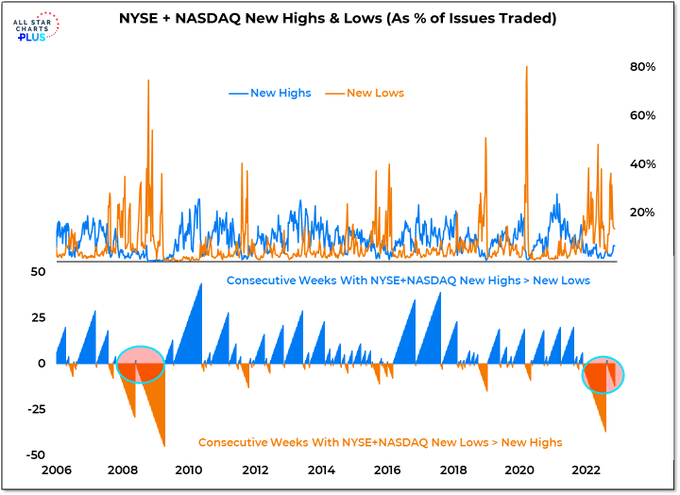
All Star Charts
S&P 500 managed to move up above the (short-term) 3900 (resistance) level.
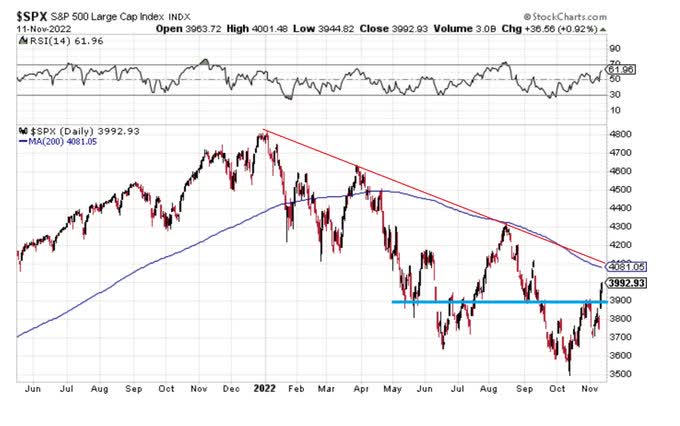
StockCharts
Now its next major test is looming: the 200-DMA (at 4081) and the clear down-trending line tracing the previous sequence of highs (around 4120).
YCharts. Author
We know the narrative that helped it break out (lower inflation), and we now have to wonder what story we will tell once it reaches (let alone fails to break) resistance.
Morgan Stanley’s Wilson: “While the lower end of our prior target for this rally (4000-4150) was achieved on Friday, we think the upper end of that range will be reached, and we would not rule out even higher prices should 10-year UST yields fall more precipitously – i.e., 3.25%.”
Morgan Stanley
“.. But the Bear Market Is Not Over. .. After what’s left of this current tactical rally, we see the S&P 500 discounting the ’23 earnings risk sometime in Q123 via a ~3,000-3,300 price trough. We think this occurs in advance of the eventual trough in EPS.”
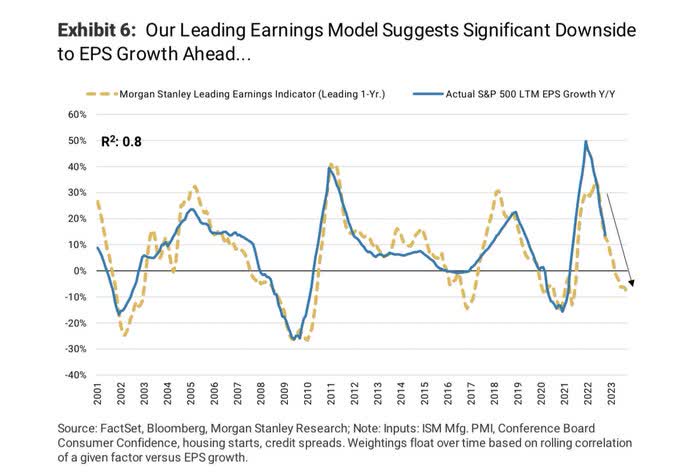
Morgan Stanley
Fed/Powell Doesn’t Like This Rally
Does the Fed want to see stocks keep rallying? Most likely not.
Powell’s most loyal lieutenant, Fed Governor Christopher Waller, was immediately sent to cool off the euphoric mood.
Here are some of the things Waller said:
Regarding the October CPI report:
- “The market seemed to get waaaa-aaaay out in front… I just cannot stress this is one data point.”
- “We’ve still got a ways to go.”
On the loosening of financial conditions that followed Thursday’s market reaction:
- “This is exactly the situation we had gotten into in July.”
- Back then, there was “a loosening of financial conditions that we were trying not to do.”
- 7.7% CPI inflation “is enormous.”
- “We knew the markets were going to jump for joy.”
On inflation expectations:
- If expectations were to become unanchored, you wouldn’t see it happening with a lot of advanced notice in the data. It wouldn’t happen gradually.
- “You don’t pop a balloon slowly. Once it goes, it goes.”
On rates:
- If you use a Taylor-type policy rule, short-term interest rates aren’t that high.
- “We’re not that tight. Real rates are barely positive a year out.”
- The FOMC statement in November was designed to signal a potential step down to 50 basis points.
- The Fed used Powell’s press conference to “drive the point home” that it’s the ultimate level for rates that matters.
Major takeaway: Fed may use smaller hikes (50bps instead of 75bps; 25bps instead of 50bps; etc.) but the ultimate goal (terminal rate) is still ~5%.
In more simple words, the pink line may have tanked (compared to the black line) but that is only relevant for mid-late 2023 (onwards). When it comes to early mid 2023, Fed Funds are still heading to 5%, +/- 0.25%, even if the path (leading to it) will consist of more 25-50bps hikes vs. (less/only) a few 50-75bps hikes.
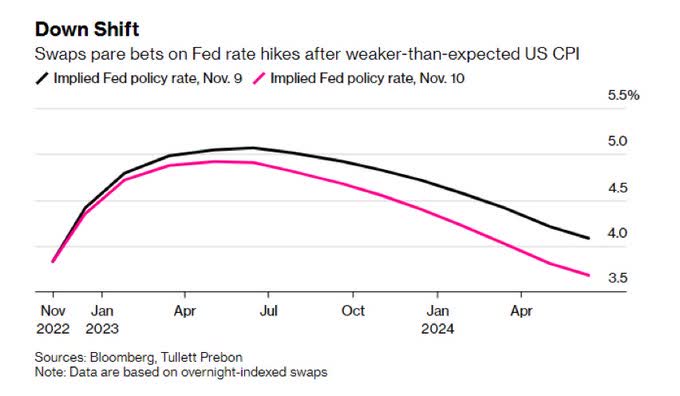
Bloomberg
Here’s the current rate forecast per GS. The main message: 4.75%-5% is still the ultimate target for Fed Funds.
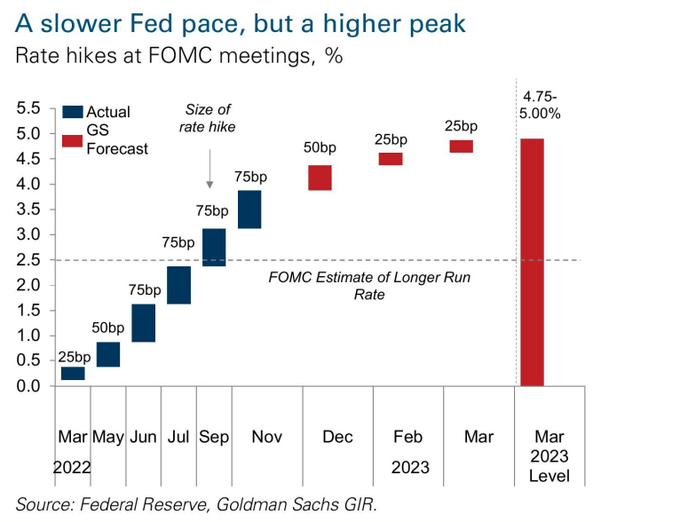
Goldman Sachs
The good news: Just as ~5% remains the winning number, the end of Q1/start of Q2 remains the winning pause/Pivot point.
Powell’s favored yield-curve measure (forward T-Bill vs current T-Bill) is calling for an end of the Fed’s tightening cycle, not-too-far-ahead.
The so-called “near-term forward spread” is seen (by Powell) as a recession indicator. That, combined with slower inflation rise, suggests that rate cuts are still likely later on in 2023.
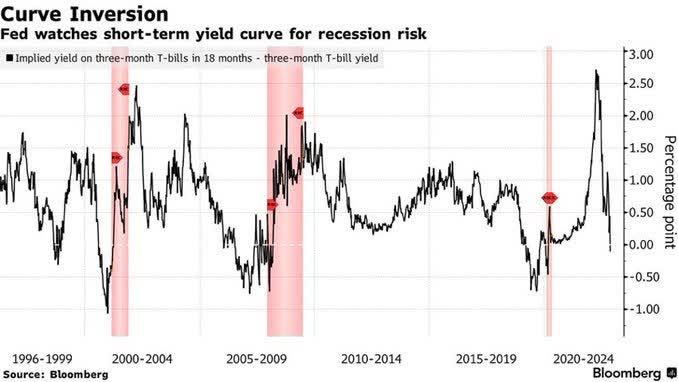
Bloomberg
Major Takeaways
We’ve promised to give you the “bottom line” early this week so here goes:
SPX at 4000? We might get another few percentage points up, but we still think this is an(other) interesting point/juncture to consider employing hedging again.
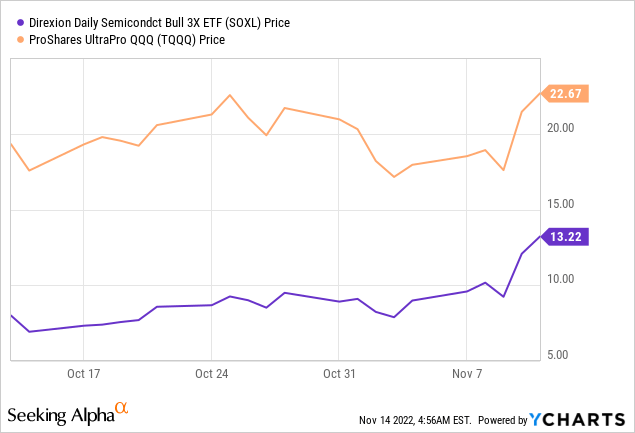
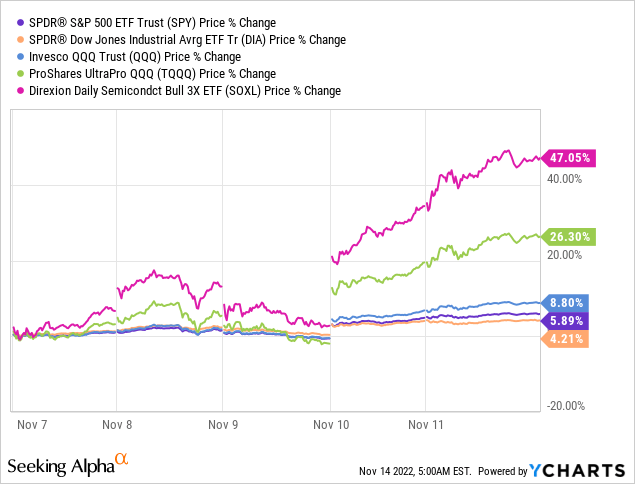
Two weeks ago (on Oct. 31) we posted “CONDITIONAL TRADING ALERTS – FMP* only” ahead of FOMC meeting: 1) SELL SHORT 3% of portfolio NYSEARCA:SOXL @ $11.50; 2) SELL SHORT 3% of portfolio NASDAQ:TQQQ @ $24.50.
*Funds Macro Portfolio (“FMP”) = an actively-managed portfolio, consists of up to 50 funds only (ETFs and CEFs), aiming to outperform SPY on a risk-adjusted basis; FMP is featured on both services – Macro Trading Factory and Wheel of Fortune.
These orders had a short life and they expired without being executed. Nonetheless, the SOXL is now trading significantly above the limit and TQQQ is only 8% below the limit.
YCharts
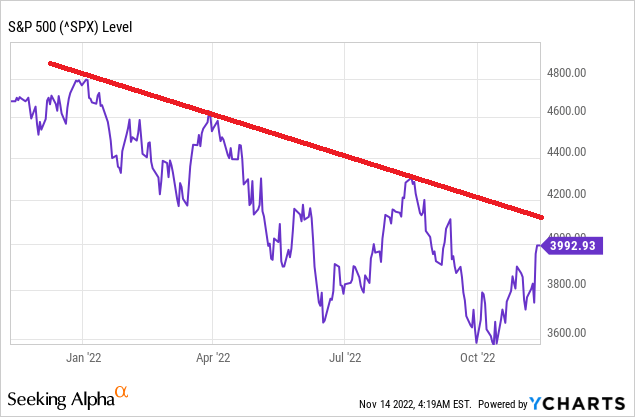
Nonetheless, following the major jump this past week, and as we approached significant psychological (SPX 4000), technical (SPX 4081) and resistance (SPX 4120) levels, it’s becoming more likely that we will employ hedging again.
YCharts
Are we convinced that SPX’s next 10% move is down? No, but at ~4000 we’re certainly seeing a -10% move as having better odds than a +10% move.
Are we convinced that UST10Y’s next move is to 4.50% than 3.00%? No, but at ~3.80% we do see a higher yield as a more likely near-term scenario than a lower yield.
Point is (unlike three weeks ago!), stocks and bonds have made a quite significant move while we were away, and that is now calling for us to be (even more) cautious than we were (three weeks ago).
We don’t think that much (if anything) has changed fundamentally – neither on the monetary side (Fed/tightening) nor on the fiscal side (no “red wave” out of Midterms). Yes, inflation has somewhat eased, but 1) that was/is totally expected (CPI can’t come out above expectations 100% of time), and 2) it’s still very high, preventing the Fed from start thinking (about thinking) about taking the leg off the (tightening) pedal.
Recall that five weeks ago we removed the hedges (bought back the SOXL and TQQQ shorts) and so while the FMP is still under-invested, it doesn’t have hedging embedded in it right now.
Funds Macro Portfolio (“FMP”)
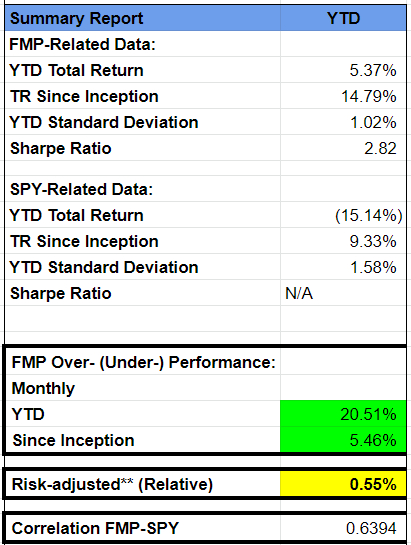
FMP is currently outperforming SPY by ~20.5% while taking less than 2/3 of the risk (based on standard deviation).
These are phenomenal results, and unless something really drastic, out of the ordinary, happens over the remaining 1.5-month (to year-end), 2022 will go down in history as our best-ever year in terms of outperformance, on both absolute (total return) and relative (to risk) fronts.
Funds Macro Portfolio (“FMP”)
Having said that, almost every day (this year) is a “war” (literally and figuratively) and we must keep fighting till the very last day, without allowing ourselves to be deceived, destructed, or less focused.
The bad news is that the “war” doesn’t seem like it’s coming to an end soon, and so 2023 is likely to be more of 2022 than 2021 or 2020 (post Q1/pandemic eruption).
The good news is that we know how to fight no matter what is being “thrown” at us, and we know how to navigate no matter what type of market we need to deal with.
Is it an easy task to fight/navigate through this? Hell no, but that’s exactly why you’re here (or at least that’s a very good reason to stick around here).
Be the first to comment