

Minakryn Ruslan
Introduction
The Phoenix-based Southern Copper Corporation (NYSE:SCCO) is a majority-owned, indirect subsidiary of Grupo Mexico S.A.B. de C.V. (OTCPK:GMBXF).
SCCO Profile Presentation (Southern Copper)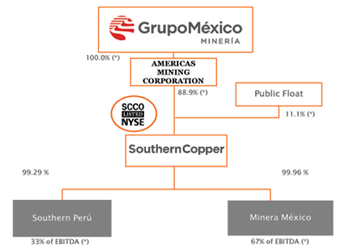
The company is an integrated producer of copper, representing about 80% of the revenue, and other metals (mainly molybdenum, silver, and zinc).
As of March 31, 2022, Grupo Mexico, through its wholly-owned subsidiary Americas Mining Corp (“AMC”), owns 88.91% of its capital stock.
Note: This article is an update of my article published on March 18, 2022. I have followed SCCO on Seeking Alpha since January 2021.
The company operates mining, smelting, and refining facilities in Peru and Mexico (See picture below). Southern Copper also conducts exploration activities in Argentina, Chile, and Ecuador. From the most recent company’s presentation.
SCCO Presentation assets (Southern Copper)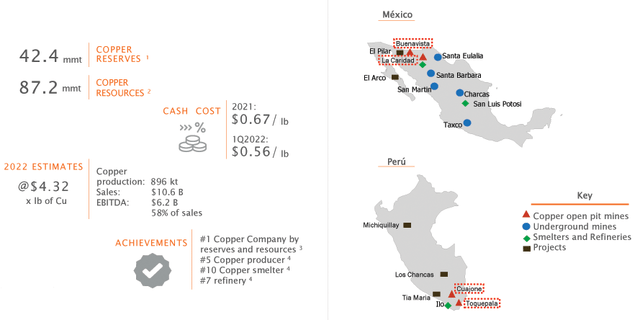
1 – Summary
On May 2, 2022, SCCO reported first-quarter 2022 earnings of $1.02 per share on a net sale of $2,763.8 million, missing analysts’ expectations.
However, revenues were up 9.1% from the prior-year quarter and were driven mainly by higher metal prices for copper, molybdenum, and zinc.
Molybdenum production fell 1.5% compared to 1Q21; silver dropped 13.4% and Copper 10%. Lower production was primarily driven by the stoppage of operations at the Cuajone mine in Peru, which led production to drop by 15,278 tons compared to 1Q21. Also, the company experienced a decrease in ore grades and recoveries at its other operations.
Cash flow from operating activities in 1Q22 was $820.7 million, representing an increase of 4.9% over the $782.6 million posted in 1Q21.
An essential element to consider: Southern Copper owns the world’s largest copper reserves, at 42.4 MMT.
SCCO Reserves (Southern Copper Presentation)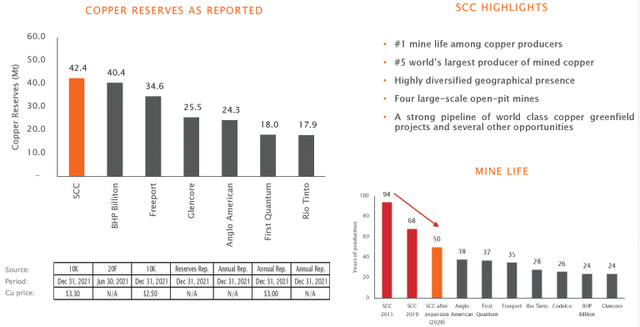
2 – Stock performance
Southern Copper is the second copper company I am covering at Seeking Alpha after Freeport-McMoRan (NYSE:FCX). Both companies have dropped significantly since April due to a significant drop in the copper price and fear of recession.
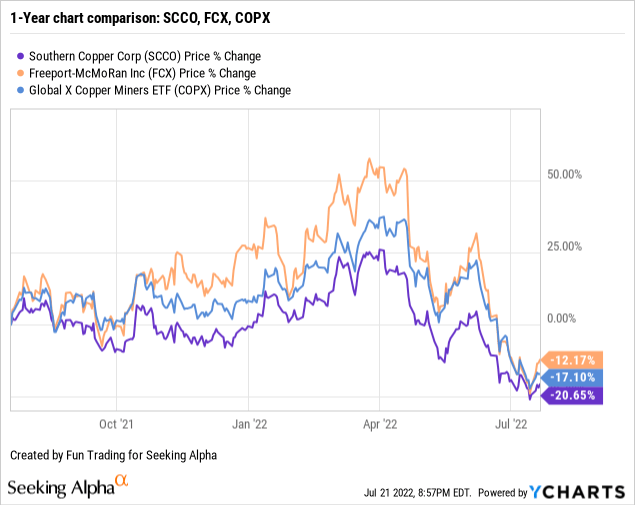
SCCO has underperformed Freeport-McMoRan and the Global X Copper Miners ETF (NYSEARCA:COPX), with a loss of 21% in one year.
3 – Investment Thesis
I consider SCCO a reliable long-term investment despite the copper price weakness, which should be seen as an opportunity. The company is paying a great dividend now at a yield of 10.40%.
However, the primary problem is that copper price is directly correlated to the world economy, and we have experienced high volatility in price over one year. With a possible recession on the horizon, copper prices crashed in June.
SCCO 1-Year chart Copper price Kitco (Kitco.com)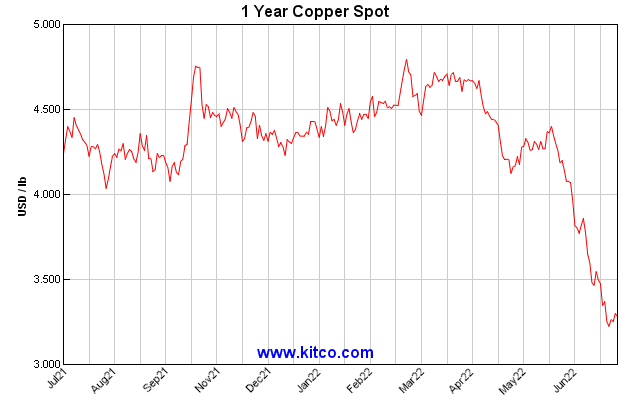
Copper prices reached an all-time high of $10,512 per metric ton on May 9, 2022.
However, aggressive interest rate hikes by the FED to fight 40-year high inflation have raised grave concerns that the global economy will fall into a recession by the end of 2022. This situation put more pressure on copper, which is now free-falling (see chart above).
Furthermore, Chile, the world’s largest copper producer, recently introduced a tax reform legislation that will increase the country’s royalties on copper miners if they produce more than 50K tonnes per year. Peru’s Pedro Castillo is following Chile’s example.
Finally, Southern Copper suspended operations at its Cuajone mine in Peru starting February 28, 2022, after local communities protested against the mine and blocked a critical railroad, causing operations at the mine to be impossible. However, the company announced on May 3 that:
[The mine was] back to full capacity at its Cuajone operation in Peru as the company prepares for formal talks with community members whose protests shut the mine for almost two months.
Thus, I recommend keeping a medium long-term position but using a minimum of 50% to trade SCCO short-term LIFO. It is perhaps the best way to take advantage of the volatility of the copper industry and enjoy a significant dividend waiting for a higher target.
Southern Copper – 1Q22 – Balance Sheet and Trend – The Raw Numbers
| Southern Copper | 1Q21 | 2Q21 | 3Q21 | 4Q21 | 1Q22 |
| Total Revenues in $ Million | 2,532.5 | 2,897.0 | 2,680.9 | 2,823.7 | 2,7863.8 |
| Net Income in $ Million | 763.8 | 932.7 | 867.6 | 832.9 | 784.7 |
| EBITDA $ Million | 1,556.9 | 1,863.7 | 1,710.8 | 1,728.5 | 1,683.0 |
| EPS diluted in $/share | 0.99 | 1.21 | 1.12 | 1.08 | 1.02 |
| Cash from Operations in $ Million | 782.6 | 1,061.5 | 1,220.6 | 1,227.7 | 820.7 |
| Capital Expenditure in $ Million | 232.6 | 219.8 | 243.1 | 196.8 | 205.2 |
| Free Cash Flow in $ Million | 550.0 | 841.7 | 977.5 | 1,030.9 | 615.5 |
| Total Cash $ Million | 2,683.2 | 2,940.1 | 3,210.5 | 3,488.9 | 3,253.7 |
| Total Long term Debt in $ Million | 6,545.0 | 6.545.9 | 6,546.7 | 6,547.6 | 6,548.5 |
| Dividend $/sh | 0.70 | 0.90 | 1.00 | 1.00 | 1.25 |
| Shares outstanding (diluted) in Million | 773.1 | 773.1 | 773.1 | 773.1 | 773.1 |
Source: Southern Copper release
Note: More data (production) is available for subscribers.
Analysis: Revenues, Free Cash Flow, and Copper/Silver/Molybdenum Production
1 – Revenues were $2,763.8 million for the first quarter of 2022
SCCO Quarterly Revenue history (Fun Trading)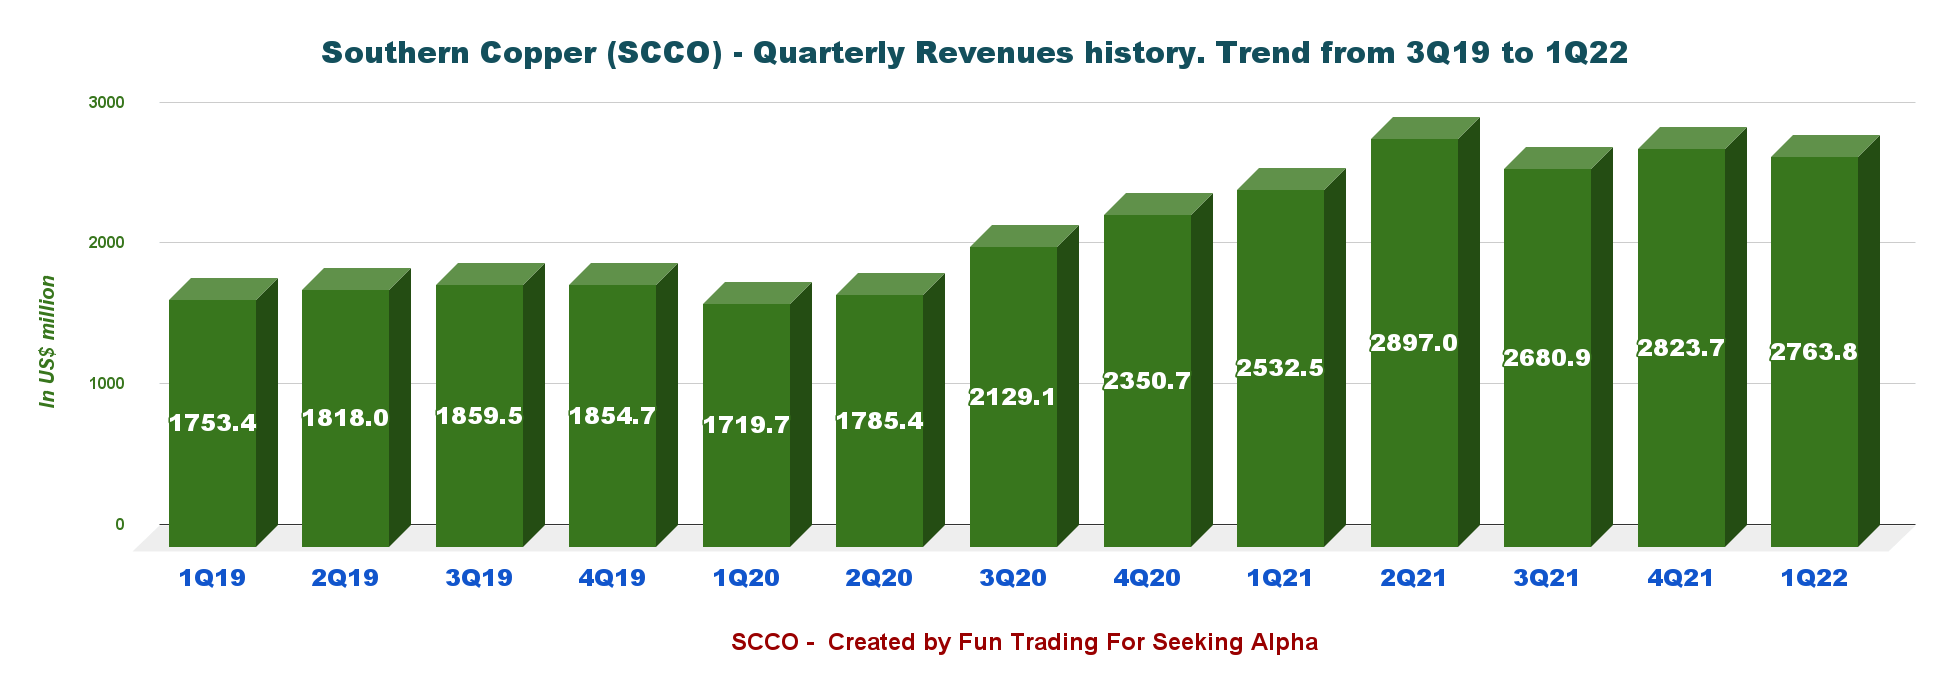
Southern Copper’s earnings per diluted share were $1.02 per share, and revenues were $2.764 billion.
1Q22 Net income was $784.7 million, representing a 2.7% increase compared to the $763.8 million in 1Q21. The net income margin in 1Q22 was 28.4%, versus 30.2% in 1Q21.
The adjusted EBITDA improved 8% year over year to $1,678.4 million in first-quarter 2022, and the adjusted EBITDA margin was 60.7% compared with 61.4% realized last year.
2 – Free cash flow was $615.5 million in the first quarter of 2022
SCCO Quarterly Free cash flow (Fun Trading)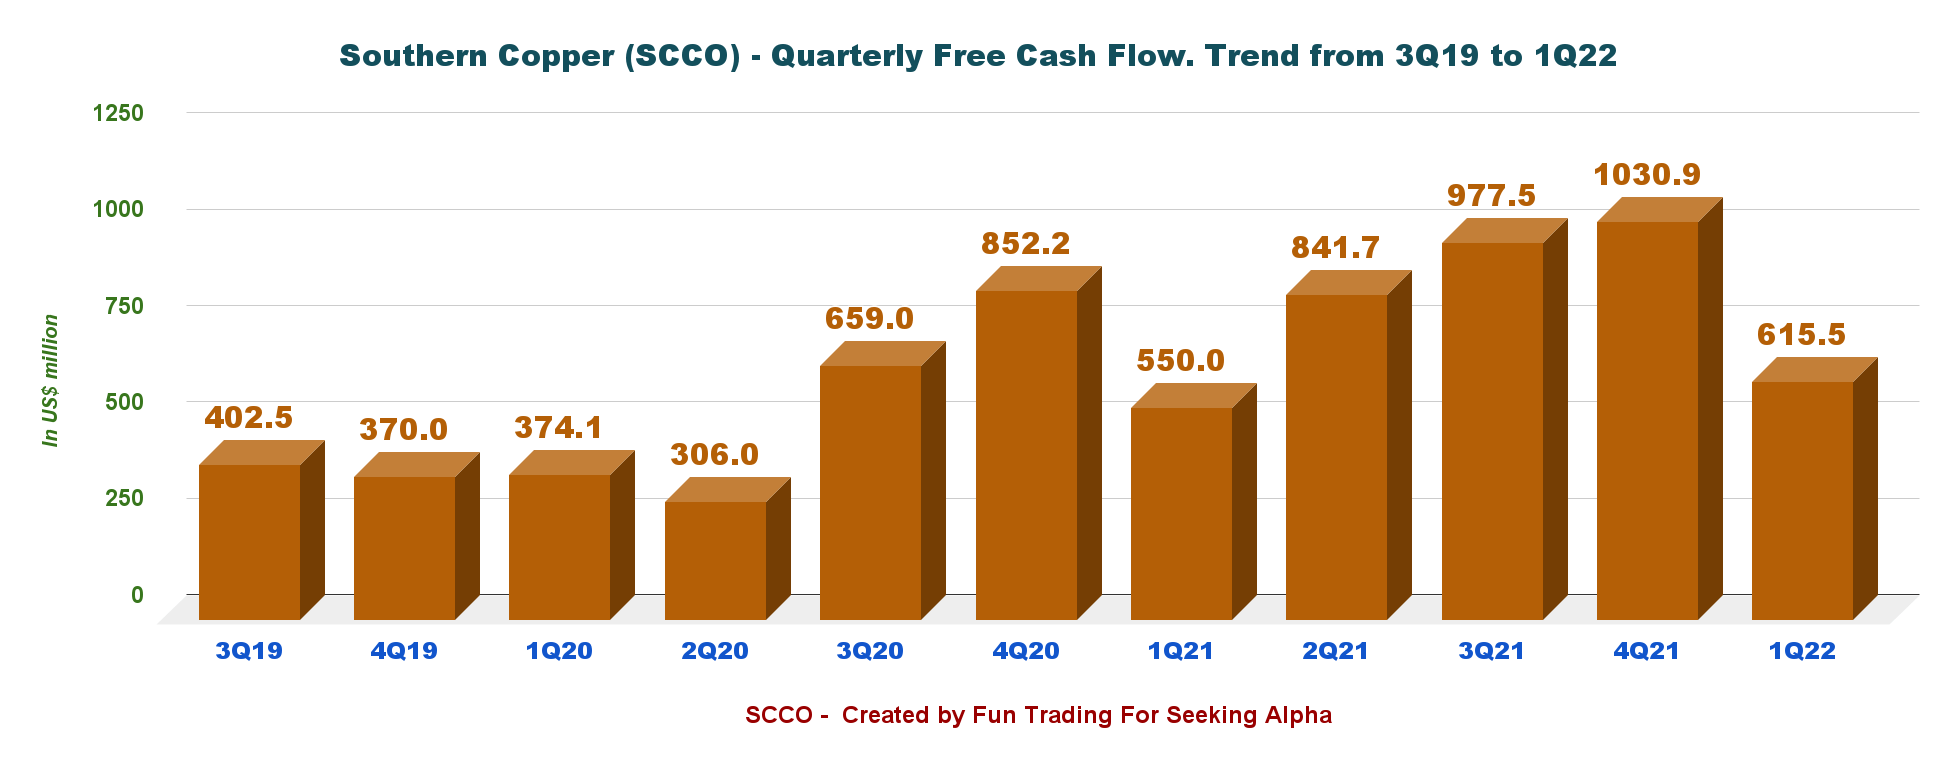
Note: I calculate the generic free cash flow using the cash from operating activities minus CapEx.
Trailing 12-month free cash flow was $3,465.6 million, with $615.5 million in 1Q22.
The company increased the quarterly dividend to $1.25 per share in 1Q22, or a yield of 10.15%, supported by the free cash flow generation.
I am unsure if the company can repeat such a generous dividend in 2Q22. The price of copper has significantly dropped, and it will put pressure on the free cash flow.
3 – Net debt was $3.29 billion on March 31, 2022
SCCO Quarterly cash versus Debt history (Fun Trading) On March 31, 2022, SCCO had $3.25 billion in consolidated cash and long-term debt of $6.55 billion (total debt of $6.24 billion). Based on the table above, the net debt to EBITDA is now 0.2x, which is good.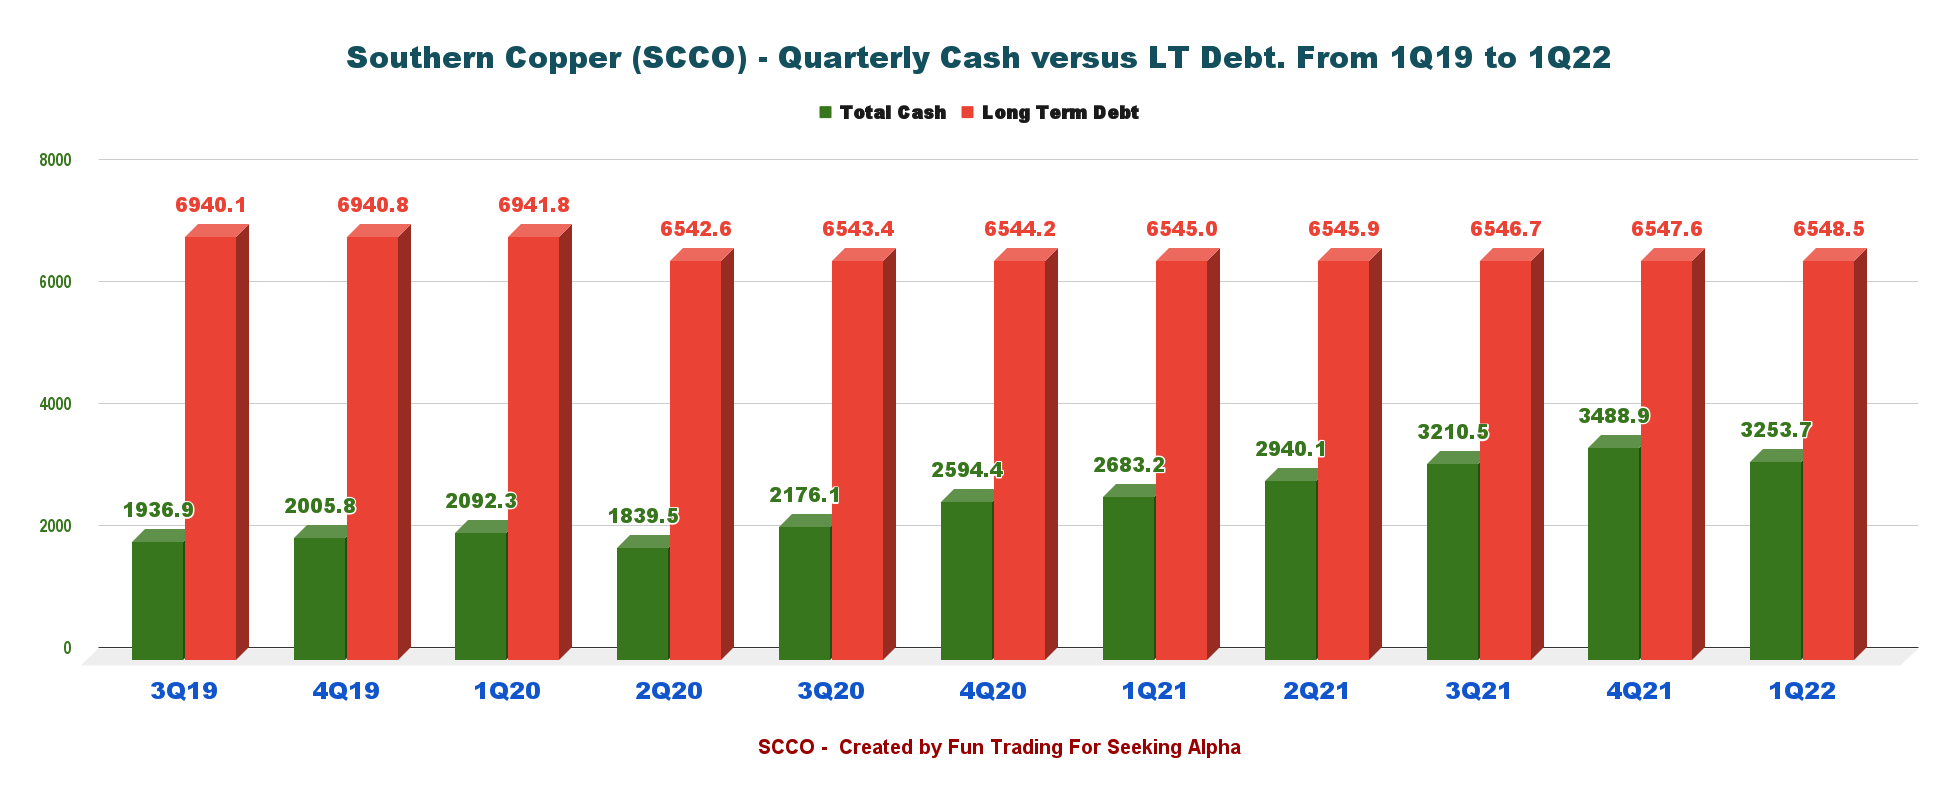
4 – Production analysis – Copper-Cu, Silver-Ag, and Molybdenum-Mo.
Note: The weight in metric tons is equal to 2,205 pounds
| Price | 1Q21 | 2Q21 | 3Q21 | 4Q21 | 1Q22 |
| Copper price realized – Cu (Comex) $/Lbs | 3.85 | 4.40 | 4.25 | 4.40 | 4.53 |
| Silver price Realized – Ag $/oz | 26.29 | 26.78 | 24.28 | 23.36 | 24.05 |
| Molybdenum price realized – Mo $/Lbs | 11.19 | 13.89 | 18.43 | 18.53 | 18.99 |
| Zinc price $/Lbs | 1.25 | 1.32 | 1.36 | 1.53 | 1.70 |
| Gold $/oz | 1,798 | 1,816 | 1,789 | 1,795 | 1,874 |
Copper Production for 1Q22 was 472.8 Cu M lbs and 476.4 Cu M lbs, including third party (sold 458.45 M lbs), down 13.4% from the same quarter a year ago. The copper price was $4.53 per Lbs in 1Q22 (see table above).
SCCO Quarterly production per metal history (Fun Trading)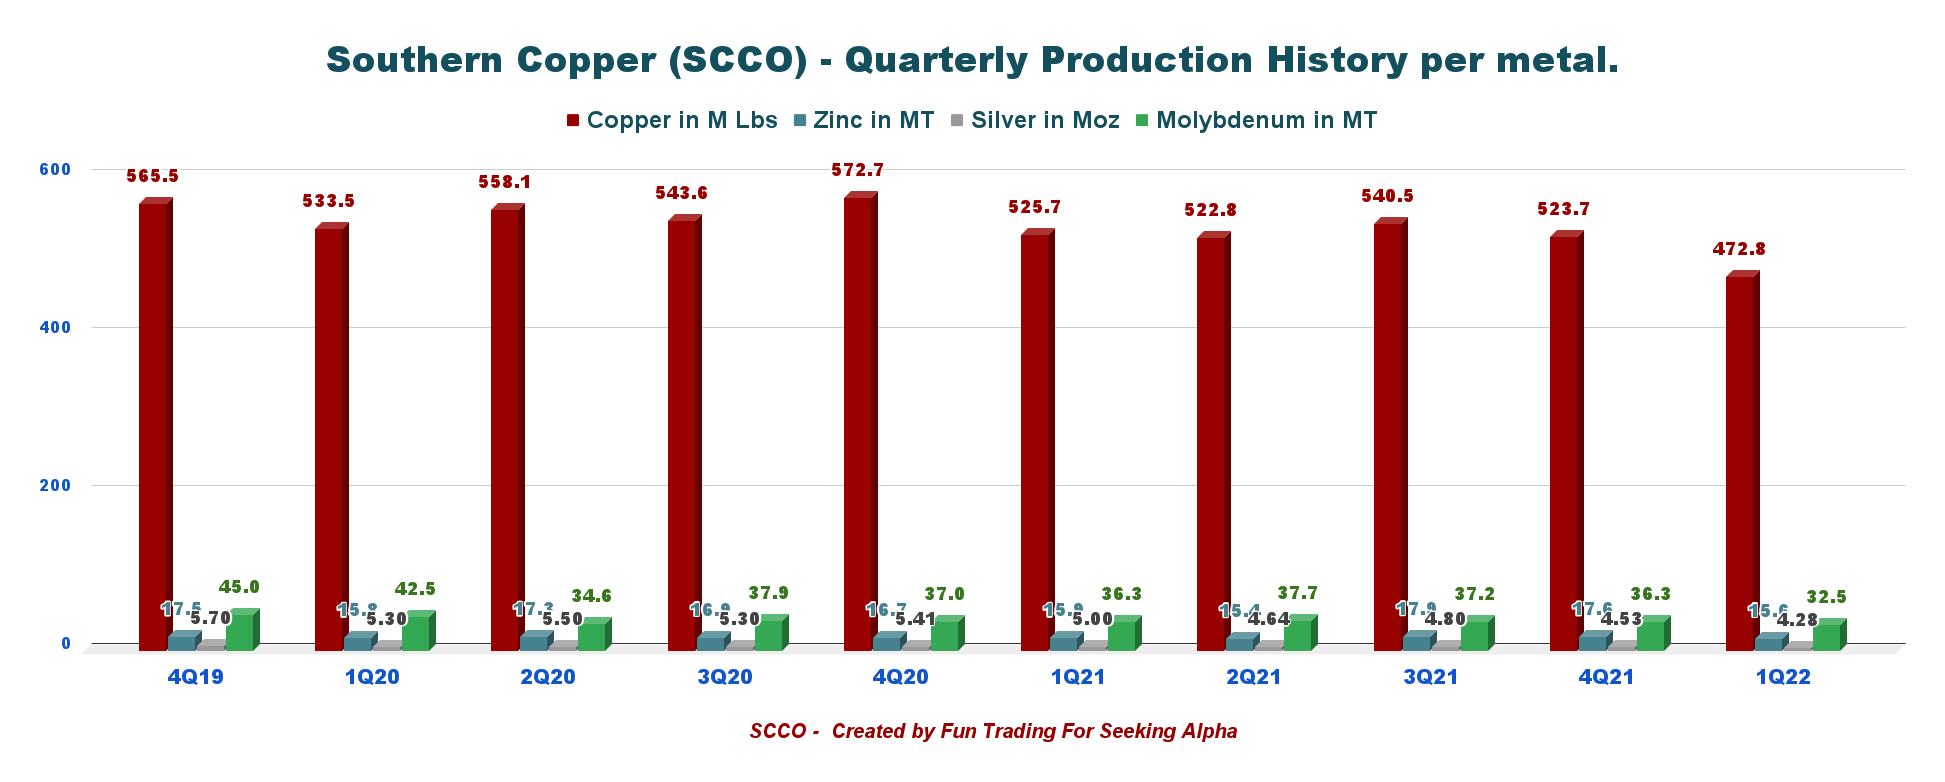
Note: The copper production in 1Q22 was affected by what happened in Peru’s Cuajone mine.
Technical analysis
SCCO TA Chart short-term (Fun Trading)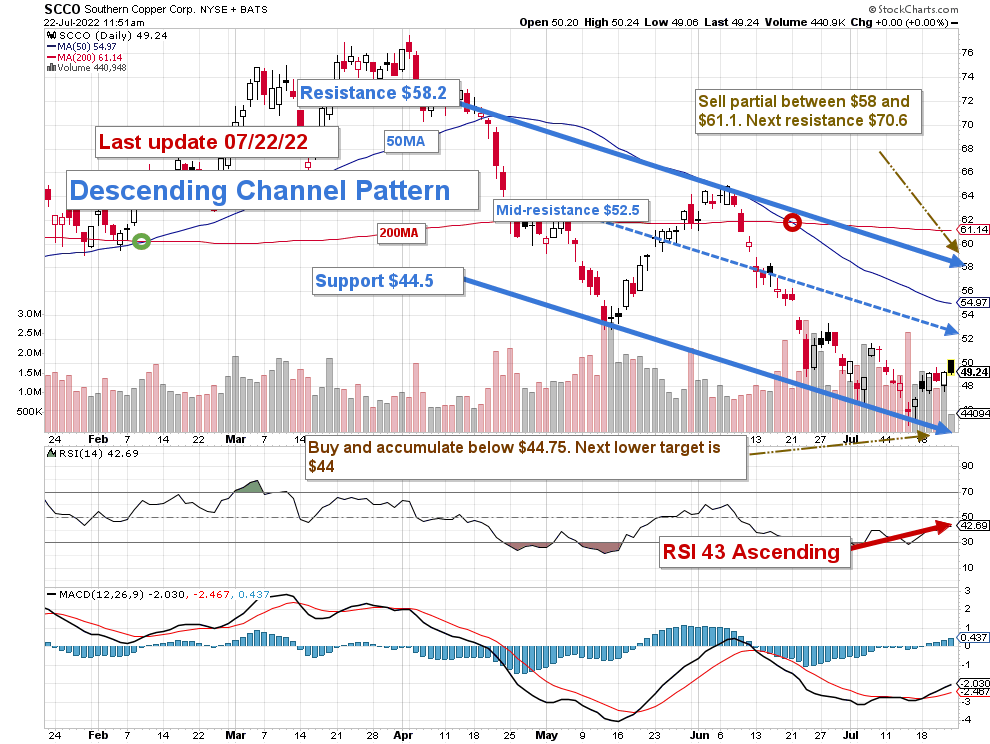
Note: The chart is adjusted for the dividend.
SCCO forms a descending channel pattern with resistance at $58.2 and support at $44.5. The pattern is a great continuation pattern but needs a specific trading strategy. The channel formation can be of two types: bullish and bearish.
The overall strategy that I usually promote in my marketplace, “The Gold and Oil Corner,” is to keep a small core long-term position and use about 35%-50% to trade LIFO while waiting for a higher final price target to sell your core position. The task is made more accessible by the generous dividend payout.
It is important to understand perfectly the correlation between SCCO and copper. Copper is an essential metal for the economy, and prices fluctuate widely. It is reasonable to buy back and accumulate at or below $44.5, depending on the copper price outlook. However, you will have to be patient here.
SCCO may drop to below $44, depending on the economy’s health. The FED has decided to fight rampant inflation and will probably hike interest by 75-point next week.
It will be a direct bearish effect on the price of copper and other industrial metals. Thus, apply a reasonable accumulation strategy and keep a good cash position.
Note: The LIFO method is prohibited under International Financial Reporting Standards (IFRS), though it is permitted in the United States by Generally Accepted Accounting Principles (GAAP). Therefore, only US traders can apply this method. Those who cannot trade LIFO can use an alternative by setting two different accounts for the same stock, one for the long-term and one for short-term trading.
Warning: The TA chart must be updated frequently to be relevant. It is what I am doing in my stock tracker. The chart above has a possible validity of about a week. Remember, the TA chart is a tool only to help you adopt the right strategy. It is not a way to foresee the future. No one and nothing can.
Author’s note: If you find value in this article and would like to encourage such continued efforts, please click the “Like” button below to vote for support. Thanks.
Be the first to comment