

SAND555
Introduction
The Phoenix-based Southern Copper Corporation (NYSE:NYSE:SCCO) is a majority-owned, indirect subsidiary of Grupo Mexico SAB de CV (OTCPK:GMBXF).
As of June 30, 2022, Grupo Mexico, through its wholly-owned subsidiary Americas Mining Corp (“AMC”), owns 88.91% of its capital stock.
SCCO Diagram Presentation (SCCO Presentation)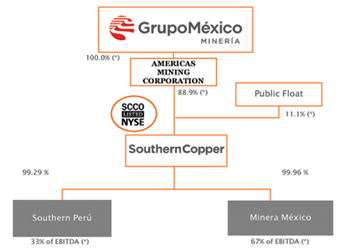
The company is an integrated producer of copper, representing about 80% of the revenue, and other metals (mainly molybdenum, silver, and zinc).
Note: This article is an update of my article published on July 24, 2022. I have followed SCCO on Seeking Alpha since January 2021.
The company operates mining, smelting, and refining facilities in Peru and Mexico (See picture below). Southern Copper also conducts exploration activities in Argentina, Chile, and Ecuador. From the most recent company’s presentation.
SCCO Presentation (Southern Copper)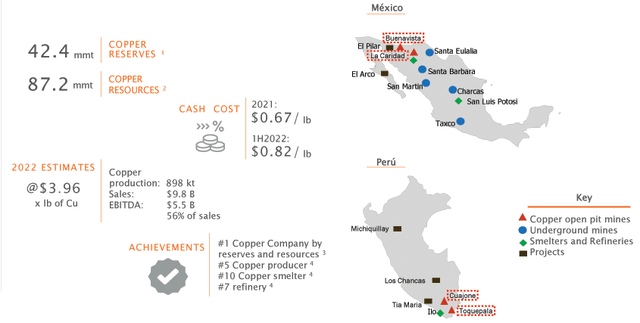
1 – Summary
On July 26, 2022, SCCO reported second-quarter 2022 earnings of $0.56 per share on a net sale of $2,306.9 million, missing analysts’ expectations.
Revenues were down 20.4% from the prior-year quarter.
The quarterly results were affected by a 25,624-tonne decrease in copper production at the company’s Peruvian operations (stoppage at Cuajone and lower ore grades) and a decline in ore grades at both Toquepala and La Caridad operations.
The copper production losses were temporarily offset with purchases from third parties, albeit at a higher cost, to avoid a force majeure event.
Molybdenum production fell 9.7% compared to 2Q21; silver dropped 4.4%, and Copper 12.1%.
Cash flow from operating activities in 2Q22 was $309.9 million, representing a decrease of 70.8% over the $1,061.5 million posted in 2Q21.
An essential element to consider: Southern Copper owns the world’s largest copper reserves at 42.4 MMT.
SCCO Copper reserves (Southern Copper)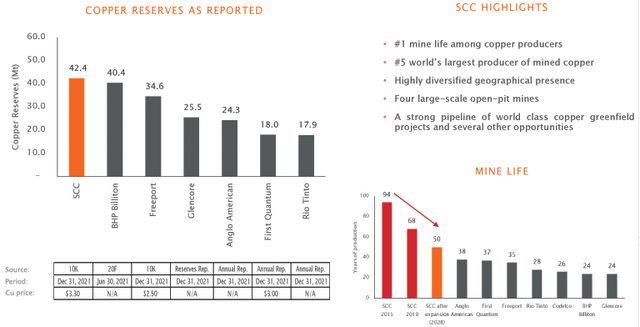
2 – Stock performance
Southern Copper is the second copper company I am covering at Seeking Alpha after Freeport-McMoRan (FCX). Both companies have dropped significantly since April due to a significant drop in the copper price and lingering fear of recession due to the Fed’s action.
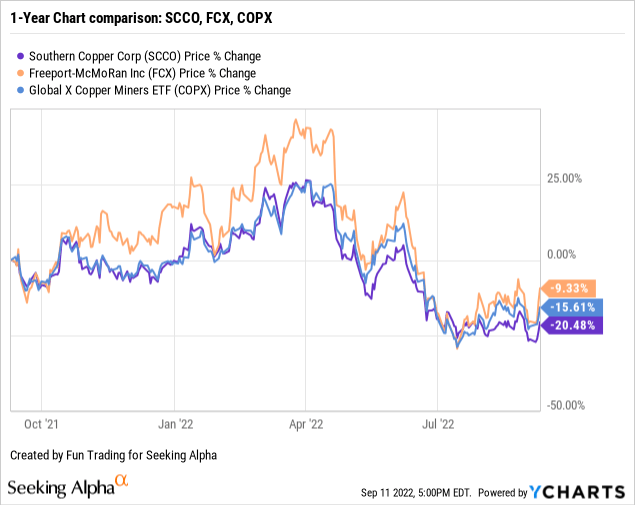
SCCO has underperformed Freeport-McMoRan and the Global X Copper Miners ETF (COPX), with a loss of 20% in one year.
3 – Investment Thesis
My two reliable stocks in the copper sector are Freeport-McMoRan and Southern Copper. I consider these two companies very solid in terms of balance sheets which pay generous dividends despite a weakening copper price.
The outlook for copper is uncertain at the moment, and the copper price has dropped significantly in the past few months with no real catalyst in the near term.
1-Year copper price chart (Kitco.com)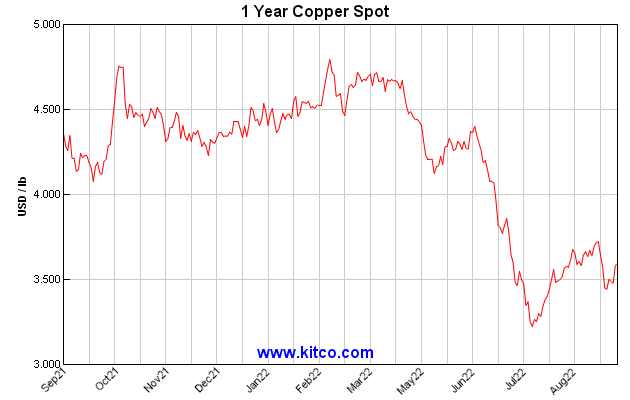
Decades-high inflation has pushed the Fed to turn very hawkish, ultimately pushing the world economy into recession. The Fed is expected to hike interest by 75-point for the third time on September 22.
The Chairman of the Board, German Larrea, said in the press release:
We believe the economic slowdowns in the U.S., China and Europe have temporarily weakened the demand for copper and are driving reductions in current prices. It is important to emphasize that copper plays a leading role in the global shift to clean energy, which correlates positively with our assertion that the underlying demand for copper will be strong in the long-term.
One major issue for Southern Copper is its presence in Peru and principally the 54-day disruption it experienced with the Cuajone mines, which were partially resolved on May 3, 2022. Also, the ore grades decreased sharply at both Toquepala and La Caridad mines.
The company expects the disruption at Cuajone to drag down annual copper production to 922,000 tons. Output is set to recover to 971,000 tons next year, Southern Copper Chief Financial Officer Raul Jacob said Tuesday on a call with analysts.
Finally, I noticed increasing inflationary pressures that could reduce the future free cash flow.
Thus, I believe long-term investors should continue accumulating this highly cyclical stock on any significant weakness. But, due to extreme volatility in the copper demand, I recommend short-term trading LIFO. About 30% to 40% should be allocated for this task to minimize the risks of a sudden severe retracement.
Southern Copper – 2Q22 – Balance Sheet and Trend – The Raw Numbers
| Southern Copper | 2Q21 | 3Q21 | 4Q21 | 1Q22 | 2Q22 |
| Total Revenues in $ Million | 2,897.0 | 2,680.9 | 2,823.7 | 2,763.8 | 2,306.9 |
| Net income in $ Million | 932.7 | 867.6 | 832.9 | 784.7 | 432.3 |
| EBITDA $ Million | 1,863.7 | 1,710.8 | 1,728.5 | 1,683.0 | 1,025.7 |
| EPS diluted in $/share | 1.21 | 1.12 | 1.08 | 1.02 | 0.56 |
| Cash from Operations in $ Million | 1,061.5 | 1,220.6 | 1,227.7 | 820.7 | 309.9 |
| Capital Expenditure in $ Million | 219.8 | 243.1 | 196.8 | 205.2 | 224.6 |
| Free Cash Flow in $ Million | 841.7 | 977.5 | 1,030.9 | 615.5 | 85.3 |
| Total cash $ Million | 2,940.1 | 3,210.5 | 3,488.9 | 3,253.7 | 2,355.7 |
| Total Long term Debt in $ Million | 6.545.9 | 6,546.7 | 6,547.6 | 6,548.5 | 6.549.4 |
| Dividend $/sh | 0.90 | 1.00 | 1.00 | 1.25 | 0.75 |
| Shares outstanding (diluted) in Million | 773.1 | 773.1 | 773.1 | 773.1 | 773.1 |
Source: Southern Copper release
Note: More data (production) is available for subscribers.
Analysis: Revenues, Free Cash Flow, and Copper/Silver/Molybdenum Production
1 – Revenues were $2,306.9 million for the second quarter of 2022
SCCO Quarterly Revenues history (Fun Trading)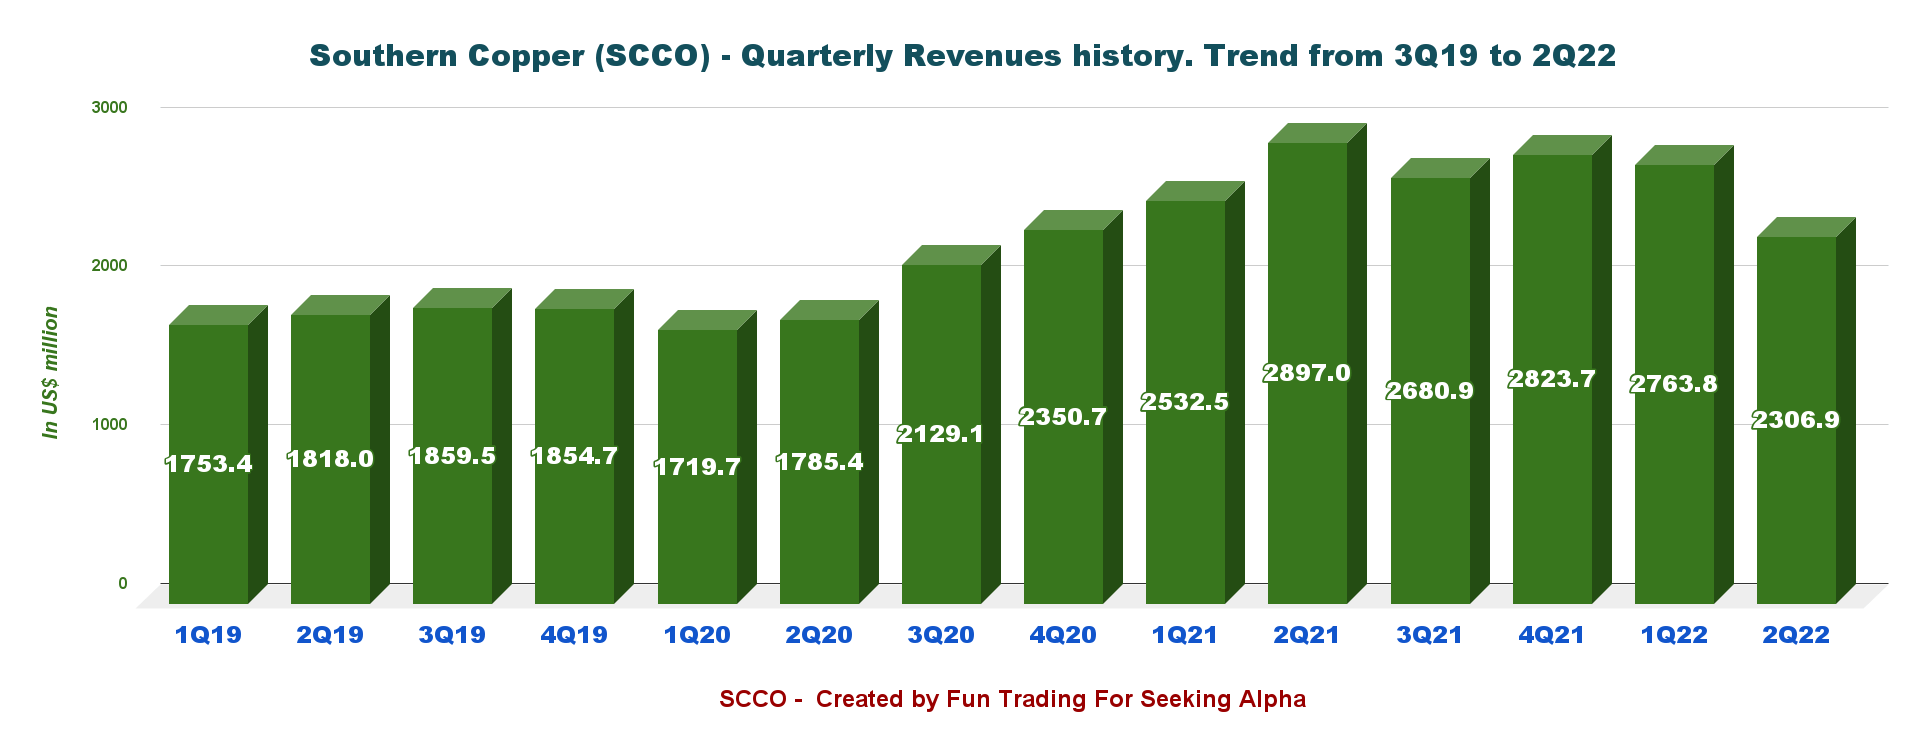
Southern Copper’s earnings per diluted share were $0.56 per share, and revenues were $2.307 billion.
2Q22 net income was $432.3 million, representing a 53.7% decrease compared to the $932.7 million in 2Q21.
The adjusted EBITDA dropped 45.2% year over year to $1,021.4 million in the second quarter of 2022. The adjusted EBITDA margin in 2Q22 stood at 44.3% versus 64.3% in 2Q21
2 – Free cash flow was $85.3 million in the second quarter of 2022
SCCO Quarterly Free cash flow history (Fun Trading)
Note: I calculate the generic free cash flow using the cash from operating activities minus CapEx.
Trailing 12-month free cash flow was $2,709.2 million, with $85.3 million in 2Q22.
The company declared a quarterly dividend of $0.75 per share in 2Q22, or a yield of 6.10%, supported by the free cash flow generation.
3 – Net debt was $4.19 billion on June 30, 2022
SCCO Quarterly Cash versus Debt history (Fun Trading) On June 30, 2022, SCCO had $2.36 billion in consolidated cash and long-term debt of $6.55 billion. The net debt to EBITDA is now 0.7x, which is good.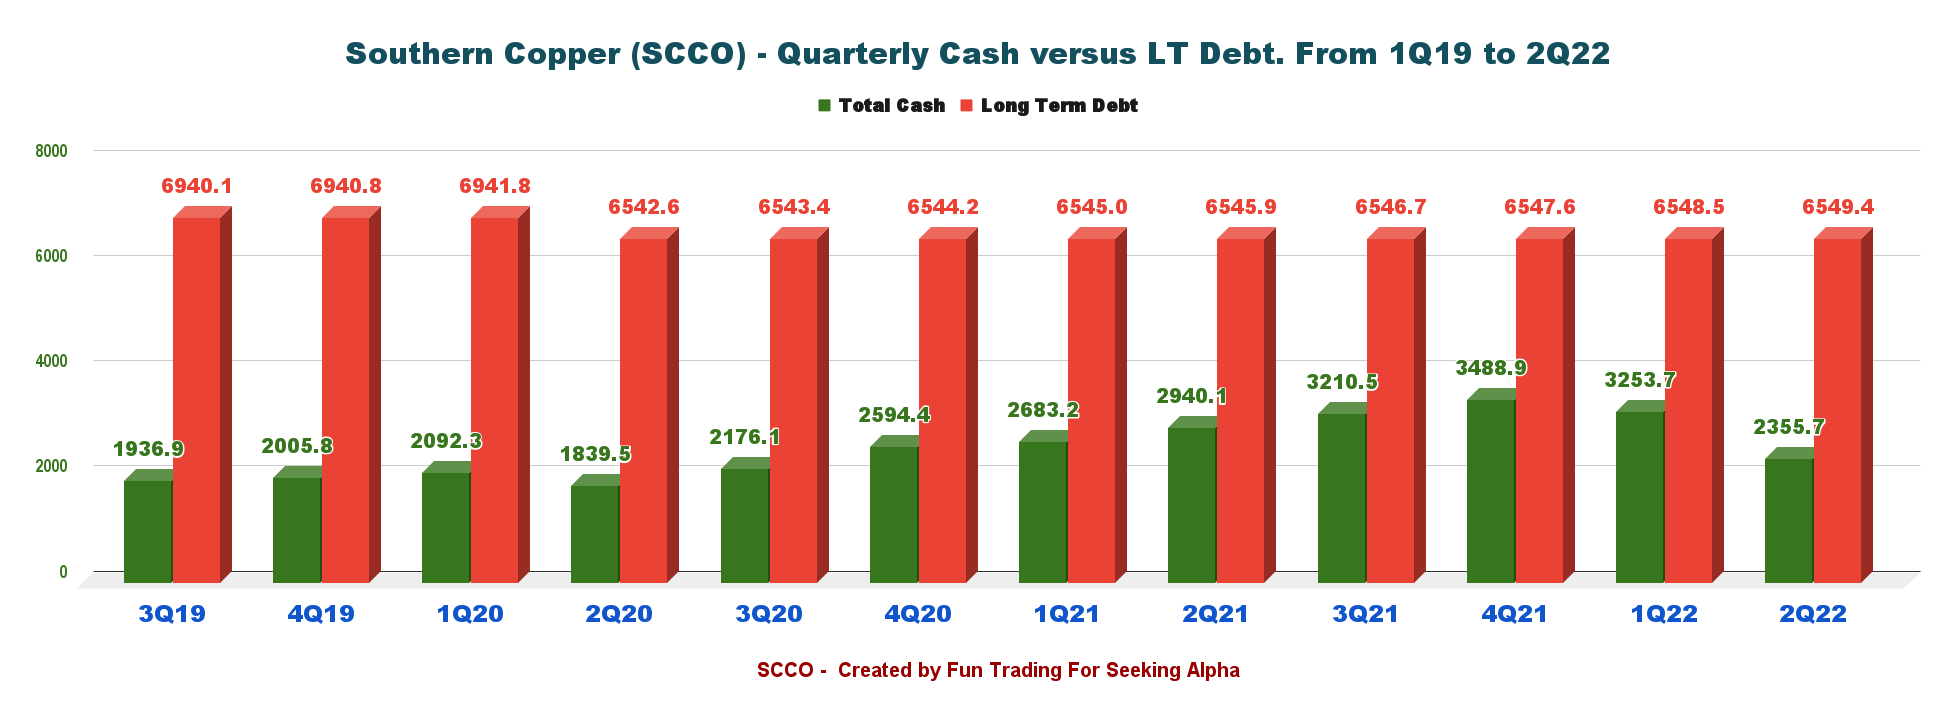
4 – Production analysis – Copper-Cu, Silver-Ag, and Molybdenum-Mo.
Note: The weight in metric tons is equal to 2,205 pounds
| Price | 2Q21 | 3Q21 | 4Q21 | 1Q22 | 2Q22 |
| Copper price realized – Cu (Comex) $/Lbs | 4.40 | 4.25 | 4.40 | 4.53 | 4.32 |
| Silver price Realized – Ag $/oz | 26.78 | 24.28 | 23.36 | 24.05 | 22.65 |
| Molybdenum price realized – Mo $/Lbs | 13.89 | 18.43 | 18.53 | 18.99 | 18.30 |
| Zinc price $/Lbs | 1.32 | 1.36 | 1.53 | 1.70 | 1.78 |
| Gold $/oz | 1,816 | 1,789 | 1,795 | 1,874 | 1,872 |
Copper Production for 2Q22 was 459.5 Cu M lbs and 520.5 Cu M lbs, including third party (sold 430.8 M lbs), down 12.1% from the same quarter a year ago. The copper price was $4.32 per Lb in 2Q22 (see table above).
SCCO Quarterly production per metal history (Fun Trading)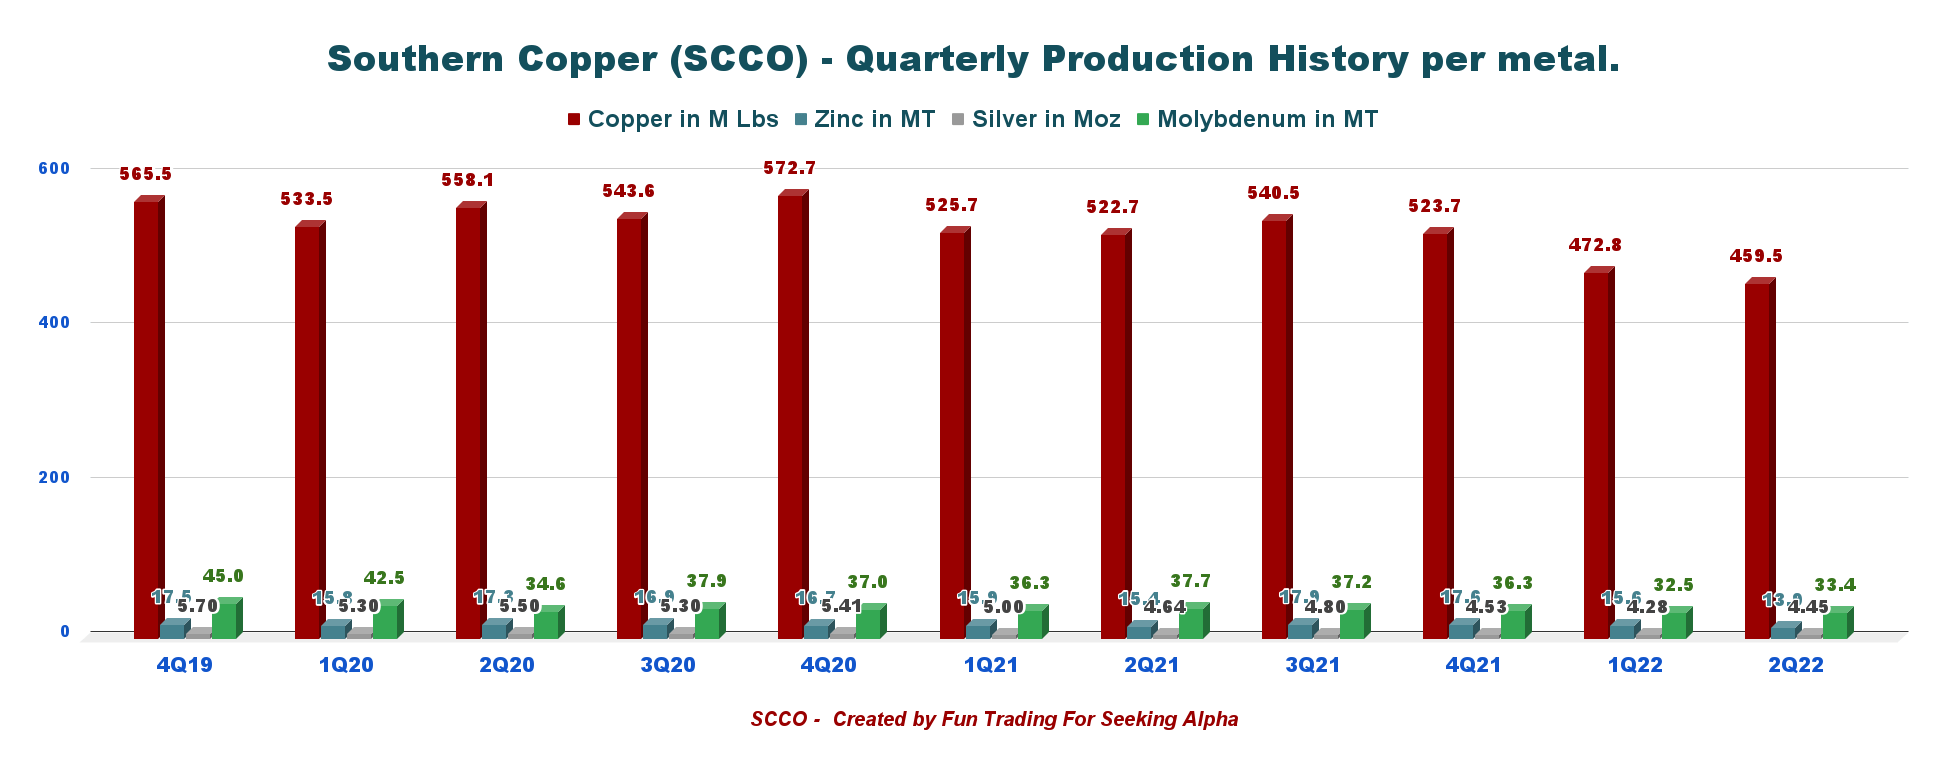
The company said the quarterly result reflected a 25.3% drop in production in Peru, triggered by a production loss of 9,339 tons at the Cuajone Mine. This loss was primarily attributable to the 54-day mine stoppage and secondarily to a decrease in ore grades at both Toquepala (-19.1%) and La Caridad (-14.8%).
CFO Raul Jacob said the Cuajone disruption would reduce FY 2022 copper production to 922K tons, but the output should recover to 971K tons next year.
Technical analysis and commentary
SCCO TA Chart short-term (Fun Trading StockCharts)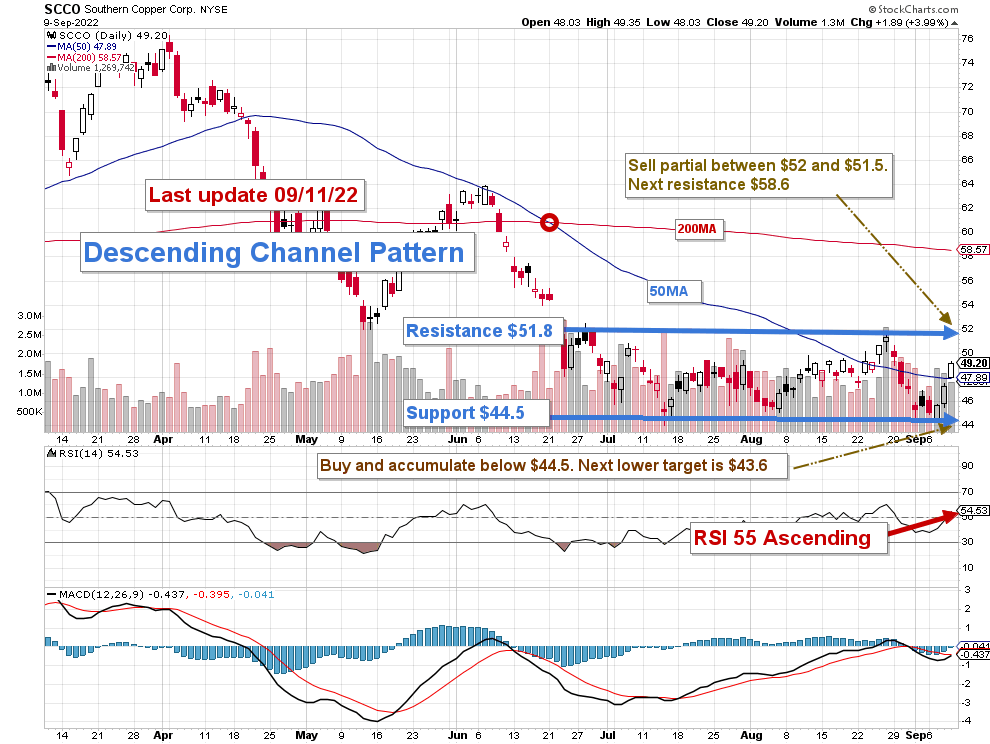
Note: The chart is adjusted for the dividend.
SCCO forms a descending channel pattern with resistance at $51.8 and support at $44.5. The pattern is a great continuation pattern but needs a specific trading strategy. The channel formation can be of two types: bullish and bearish.
The overall strategy that I usually promote in my marketplace, “The Gold and Oil Corner,” is to keep a small core long-term position and use about 35%-50% to trade LIFO while waiting for a higher final price target to sell your core position. The task is made more available by the generous dividend payout.
It is important to understand perfectly the correlation between SCCO and copper. Copper is essential for the economy, and the price fluctuates widely.
I recommend buying back and accumulating at or below $44.5 with potential lower support at $43.6.
The Fed has decided to fight rampant inflation and will probably hike interest for the third time on September 20-22 by 75-point. I think this move will be detrimental to the copper price. Thus, apply a reasonable accumulation strategy and keep a good cash position expecting further weaknesses in this sector.
Note: The LIFO method is prohibited under International Financial Reporting Standards (IFRS), though it is permitted in the United States by Generally Accepted Accounting Principles (GAAP). Therefore, only US traders can apply this method. Those who cannot trade LIFO can use an alternative by setting two different accounts for the same stock, one for the long-term and one for short-term trading.
Warning: The TA chart must be updated frequently to be relevant. It is what I am doing in my stock tracker. The chart above has a possible validity of about a week. Remember, the TA chart is a tool only to help you adopt the right strategy. It is not a way to foresee the future. No one and nothing can.
Author’s note: If you find value in this article and would like to encourage such continued efforts, please click the “Like” button below to vote for support. Thanks.
Be the first to comment