

Oselote
As I discussed in my previous article, scary headlines are usually not a good time to buy silver/gold (the ETF NYSEARCA:SLV is a good way to get exposure to silver to avoid managing physical silver). Indeed, every sharp spike in silver prices has been a false start in the past few years (maybe past few decades), as per the chart below of silver prices from 1976-2022.
Silver historical prices (Public info)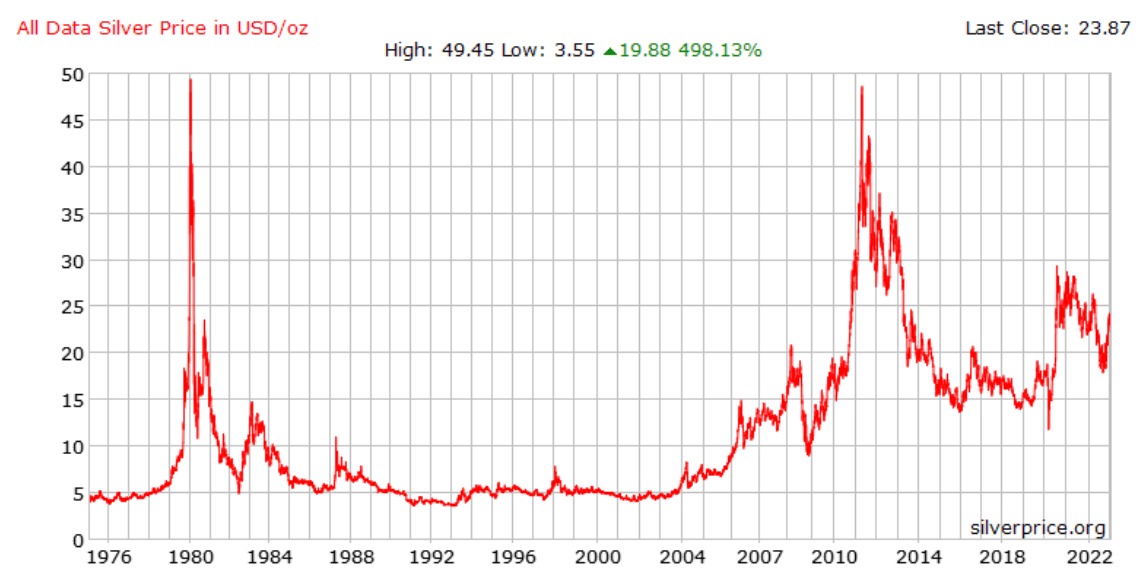
Had you bought after silver prices rose sharply anytime in the past few decades, more likely than not, they would fall right back down. This makes sense given:
- Around half of silver demand is industrial and industrial demand is cyclical.
- Silver has been in oversupply for most of the past decade per below chart. This is likely the main reason prices have been struggling over the past decade.
Silver supply demand (the Silver Institute)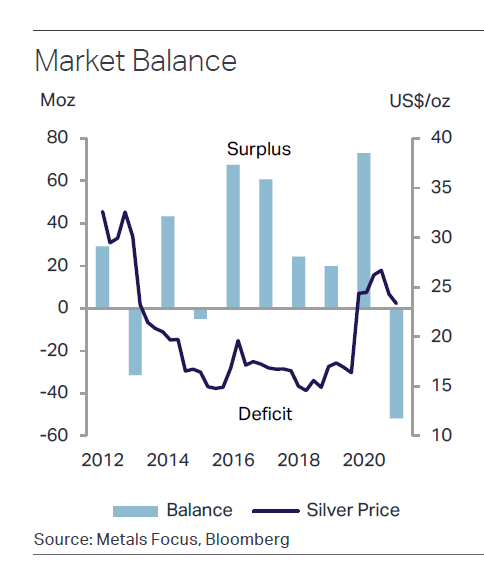
However, circumstances have improved in the past few months and there is more certainty for the bull case. This article will mainly focus on bullish points that have not already been covered by other authors, especially with regards to a closer look at solar demand growth.
Reason #1: Silver demand is likely to dramatically increase in 2023 from solar
Silver’s potential demand from green/alternative/renewable energy growth is often mentioned, but in this article I attempt to do a bit more quantification.
There are two drivers in the silver demand from solar:
- Solar installation capacity growth
Long term: There is the underlying growth trend as solar becomes a cost competitive source of electricity (and the technology is rapidly developing to further increase efficiency).
Solar growth forecast (Bloomberg)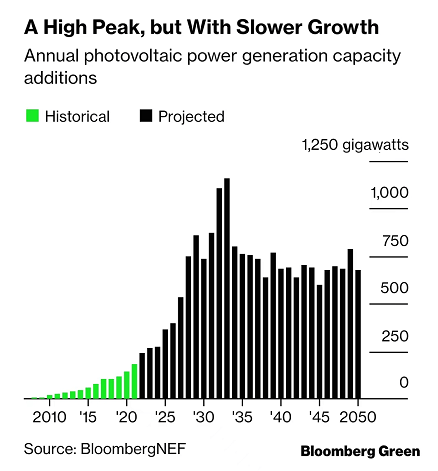
2023: There is also the strong catalyst for growth in 2023. In 2023, solar module demand and supply will both likely increase as solar module prices sharply decline to the capacity increase of key raw material inputs such as polysilicon.
Polysilicon capacity estimates (Chinese industry association)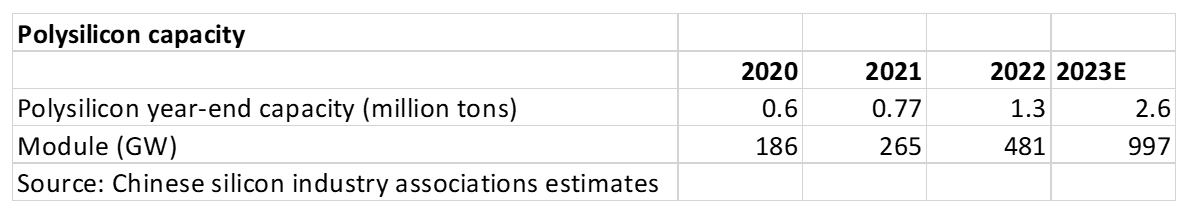
Polysilicon capacity bottleneck caused solar module prices to surge in 2021 and remain high in 2022. However, polysilicon capacity surged in Q4-2022, and is forecast to double at 2023 based on current factory expansion plans. By year-end 2023, China will have enough polysilicon production capacity for nearly 1000 GW of modules (which is roughly 4 times that of global 2022 installed capacity).
This has led to a collapse in prices across the value chain, especially in modules. Below are the local quote prices in China (as it is the major module producer), and it is quite visible that prices fell significant at year-end 2022.
Prices of solar modules (PV infolink)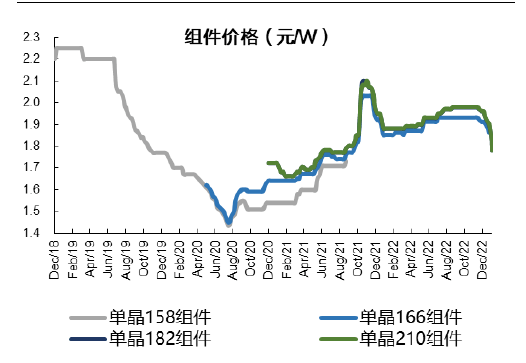
In the below section I will try to quantify the impact in terms of silver demand.
2. Decline in silver use per module: This is an often overlooked driver that has a negative impact on silver demand.
Due to technological improvements, the intensity of silver (I.e. the usage of silver in for each GW of solar module) has decreased. According to the World Silver Survey 2022 (from the Silver Institute), intensity of silver per solar cell has decreased 80% in the last decade, as shown below.
Silver loadings per pv cell (the Silver Institute)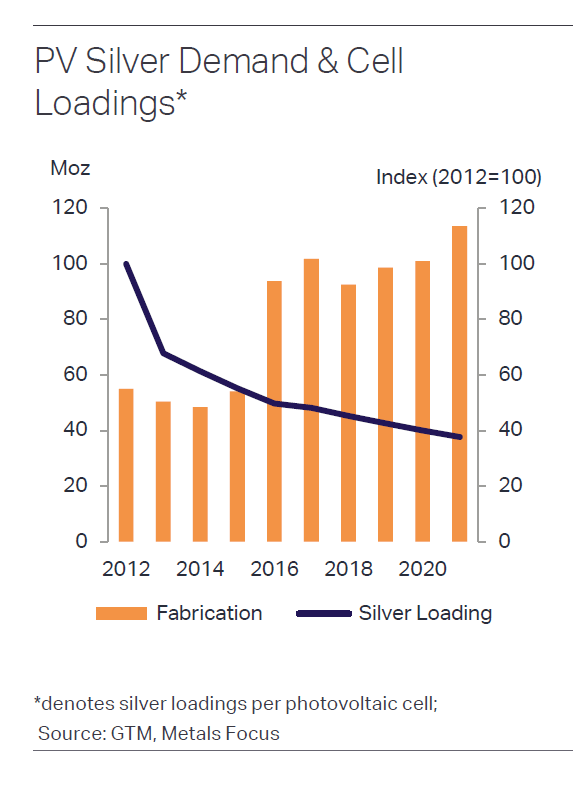
This has resulted in silver demand growing much slower than solar installations in the past decade – silver in solar use has only doubled while solar installations have grown at least 6 times. Per Bloomberg, global solar installed capacity in 2022 was probably around 268 GW).
silver for solar use (silver institute, bloomberg)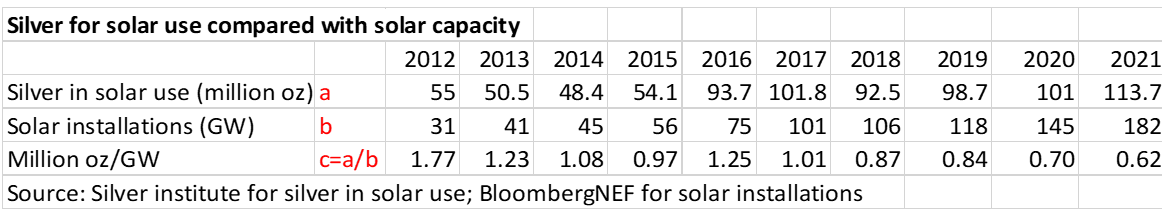
However, the Silver Institute explains this is due to:
- the decrease in the finger-width (the width of the lines of silver paste that are printed onto the front and rear of panels to collect and then deliver the generated DC current) from 100 μm to 30 μm over the past decade.
- It appears the low hanging fruit has been picked here: future decreases in the finger width are forecast to be down to 25-30 μm by 2025 (another 30%-ish decrease over 3-4 years).
- Also, the pressure to thrift on silver cell usage may be mitigated by increased silver use on the transition to newer technology solar cells such as TOPCon and HJT “which may require 30-80% more silver than current panels”, so this may result in far less decline in silver intensity in the next few years, right when solar installation growth is going to be significant.
The bottom line: PV demand (which is already 11% of total silver demand) is likely to grow rapidly in 2023 (with a rosy forecast for at least the next few years) even considering negative impacts from lower silver intensity due to technological improvements under a backdrop of slugging silver supply (limited new mine production with production peaked since 2016).
silver supply demand (the silver institute)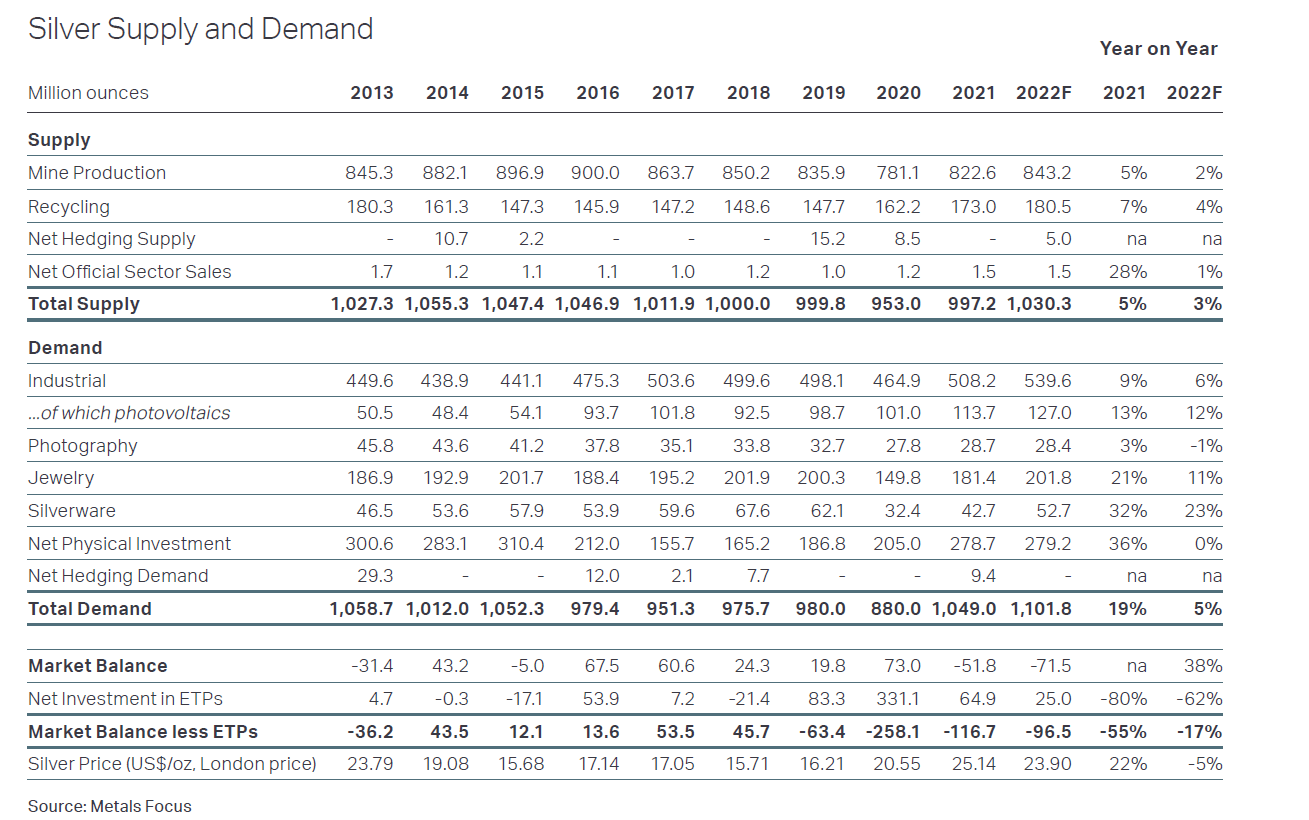
Demand could outstrip supply by mindboggling amounts:
- Given Chinese polysilicon expansion, the consensus estimate is 350 GW of new global solar installation capacity in 2023 (compared to c.270 GW in 2022, a 30% growth, compared to 182 GW in 2022, almost a double).
- Even if silver intensity massively declines 15-20% a year compared to 2021 (the trend decline rate is about 10% a year in the past decade), this will still result in at least 50% higher silver usage compared to 2021 (roughly 55m ounces) assuming aggressive silver intensity decrease, adding to the current imbalance where demand exceeds supply.
- Better yet, with solar installation forecast to grow rapidly in next few years, the imbalance in the market will increase and persist.
Market imbalance
| million ounces of silver | 2023 base case | 2023 optimistic case |
| Assumptions | 2023 350GW newly installation capacity; intensity per GW 30% lower than 2021 | 2023 350GW newly installation capacity; intensity per GW same as 2021 |
| 2022 baseline demand exceeding supply | 100 | 100 |
| 2023 incremental demand from silver | 55 | 110 |
| 2023 demand exceeding supply | 155 | 210 |
Source: Author’s calculations
Reason #2
Silver’s proportion of total module cost is still quite small, so solar module producers and consumers are well able to absorb a large increase in silver prices (even if they complain about it or try to substitute for it).
Assuming roughly 0.6 million ounces of silver are used for each GW per above calculation, this translates to about $15 million per GW. Each GW costs about $200 million (assuming module prices fall back to their historical low), which mean silver would be about 7.5% of module costs. If silver prices double or triple, it would be inconvenient but not the end of the world for solar modules.
Reason #3: Silver inventories rapidly decreasing despite the general economic slowdown
Silver inventories (red line below, right axis) have fallen from 390 million ounces in early 2021 to roughly 295 million ounces latest. This is encouraging for silver bulls, especially since 2022 saw a persistent decline in inventories despite economic turmoil worldwide.
silver inventories COMEX (COMEX)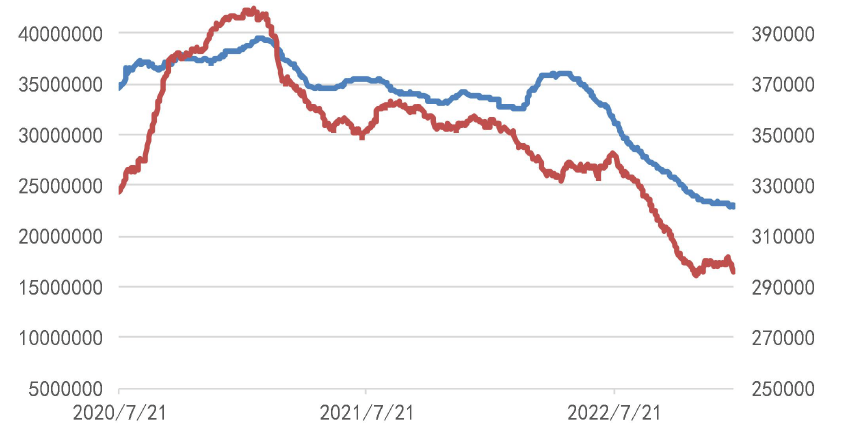
Source: COMEX
At current drawdown speed of 100m ounces a year, COMEX silver inventories will fall to nil in about 3 years, at 150m ounces a year (100 in 2022 plus 50 from the 2023 growth calculated above), it would be taking 2 years, whereas if silver demand exceeds forecast (either due to higher solar growth or smaller decline in silver intensity per GW) then this could drastically speed up to within 1-2 years.
Silver holdings at the LBMA have also fallen by the most in years in 2022: from almost 1.2 billion ounces in mid 2021 to 840 million ounces in December 2022. There hasn’t been much buzz regarding why over 300 million ounces of silver was withdrawn from the LBMA and does not re-appear in any other exchange with public data (e.g. COMEX), so either it’s gone into the physical world or it’s ended up in some private hoard, but it is encouraging that either there is that much physical demand or someone is so bullish to hoard that much silver.
LBMA silver holdings (LBMA)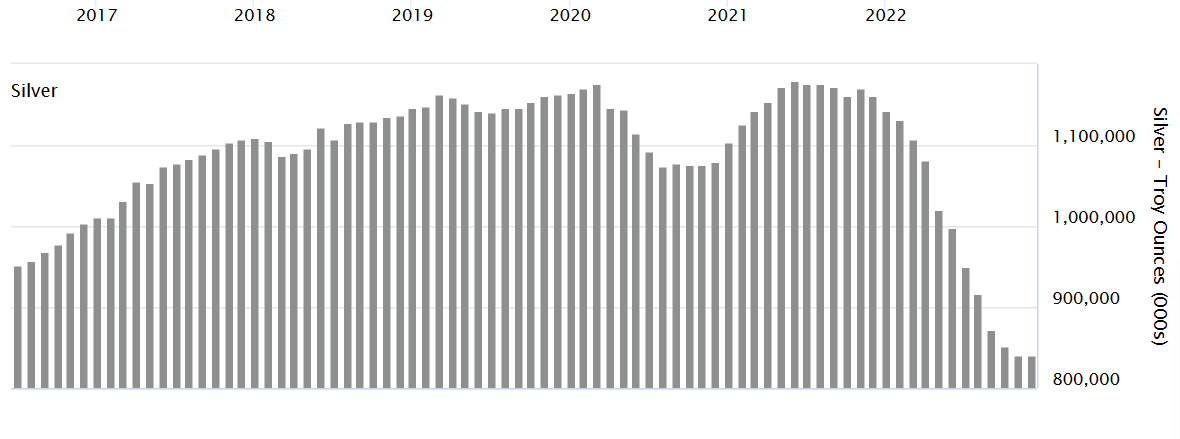
Risks:
The main risks to the silver outlook are twofold: macroeconomics and solar demand.
- Macroeconomics: the Fed has repeatedly asserted it will stick to tightening and the fight to return inflation back to 2% will take longer. The tightening monetary policy appears it will continue for a while, though if silver demand is as strong as expected, this might be less of a headwind than feared.
Copper is an excellent case in point: copper prices began a bull market as demand from China started outstripping supply in 2003, however the biggest gain was after the Fed was well into its tightening cycle (shown below compares copper prices and Fed funds rate).
That said, the 2003-2007 bull market in copper occurred in a housing boom globally, while the economy is currently feared to be near recession.
Copper vs Fed funds rate (FRED)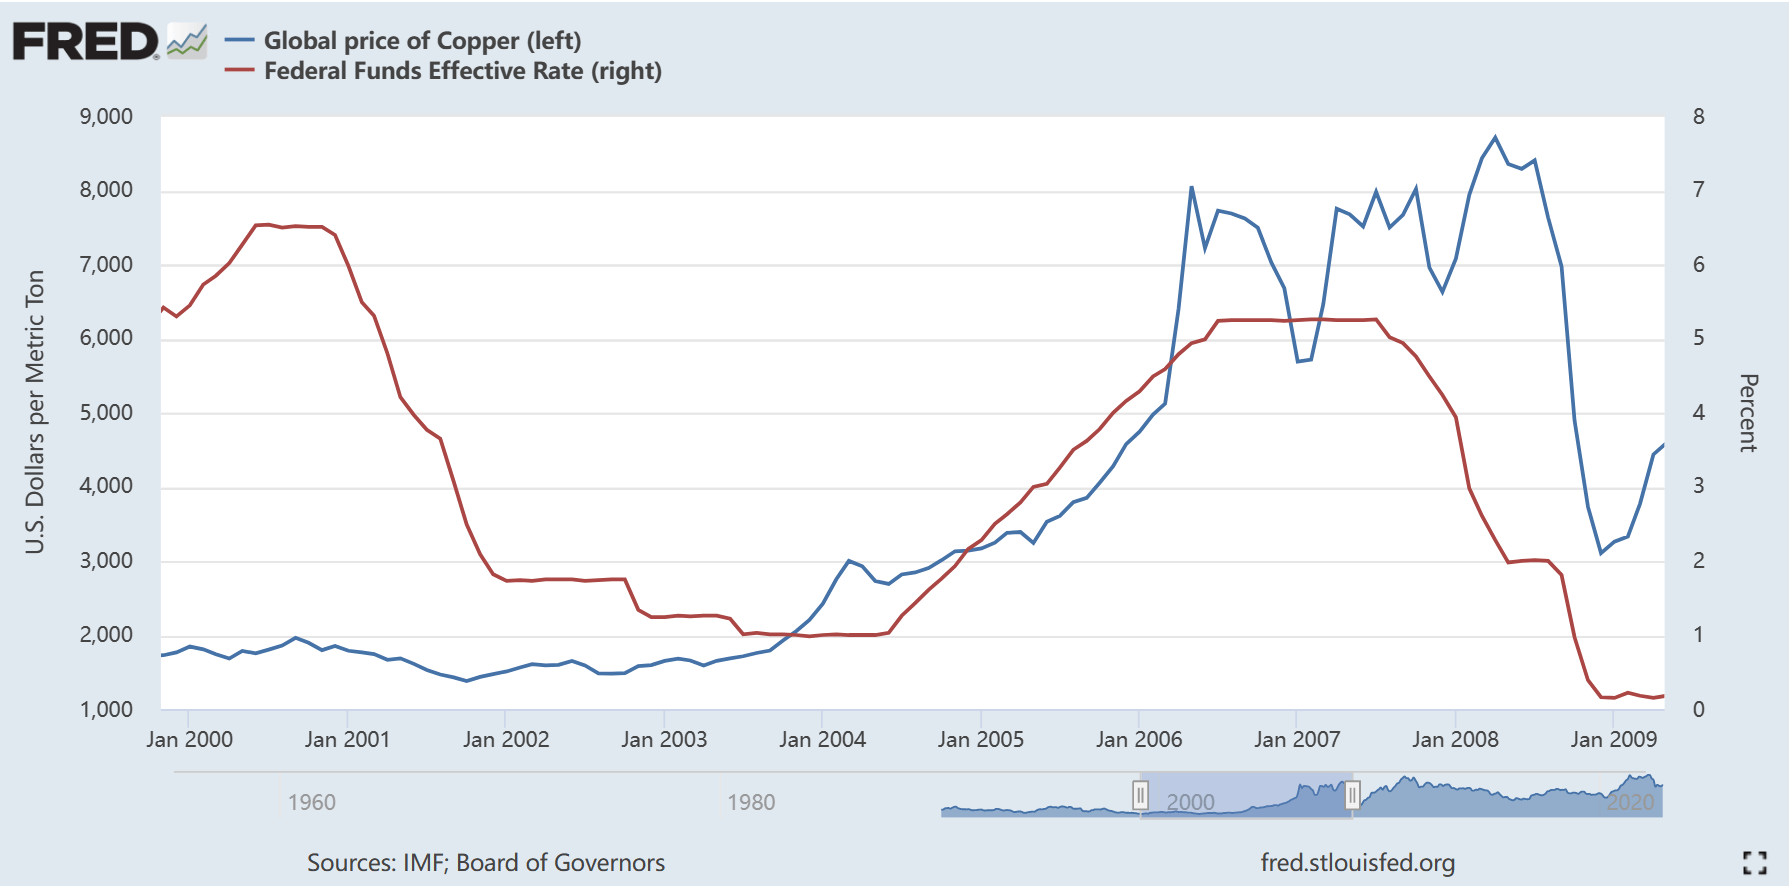
- Silver demand from solar could grow less than forecast: (i) negatively impacted by technology that vastly reduces silver intensity or eliminates the use of silver (by substituting with copper etc, though it does not appear anyone sees this as imminent) or (ii) just solar installations growing solar than anticipated for whatever reason (e.g. US placing tariffs on imports from China produced solar modules).
Editor’s Note: This article covers one or more microcap stocks. Please be aware of the risks associated with these stocks.
Be the first to comment