

syahrir maulana
By Robert Hum, CAIA
What is size investing?
Size investing is an investment strategy that targets companies that are relatively smaller than their peers. Size investing has been around for decades.
One of the most seminal pieces on investing in the small-cap premium was from Rolf Banz in where he found smaller-cap companies outperformed their large-cap peers.1
Size investing is based on the belief that smaller companies have the potential to outperform their large-cap peers. This article will delve into what size investing is, how investors can capture the size premium, the characteristics of size portfolios, as well as why we expect the size premium to persist over time.
How do we define size investing?
Size investing is a strategy that targets companies based on their market capitalization (market cap). The market cap of a company is the aggregate value of the shares of a company (shares outstanding times price).
Historically, companies have been broken down into four market cap categories. They are typically mentioned as large, mid, small, and micro.
Why would small-cap companies outperform?
There are multiple theories as to why small-cap companies have, and are expected to outperform. The most intuitive is the cost of capital argument. Imagine you’re looking to start your own business and go to the bank to ask for a loan.
Now imagine a mega-cap corporation – think Apple (AAPL) or Amazon (AMZN) – go to the same bank to ask for a similar size loan for a similar business idea. Who do you think the bank will charge the higher interest rate to?
Obviously, the individual is a riskier loan candidate, and the bank will require a higher rate of return (via the interest rate on the loan) to make the loan. It is possible that equity investors see small-cap companies the same way.
They could be demanding a premium for the risk in investing in a smaller-sized company instead of a well-known mega-cap company.
Other potential explanations involve concepts including how it can be challenging to trade small-cap stocks (liquidity), and that most people work for mid and small companies and just don’t want more of that same risk (correlation with human capital).
Size portfolio construction
There are several ways to create a size portfolio.
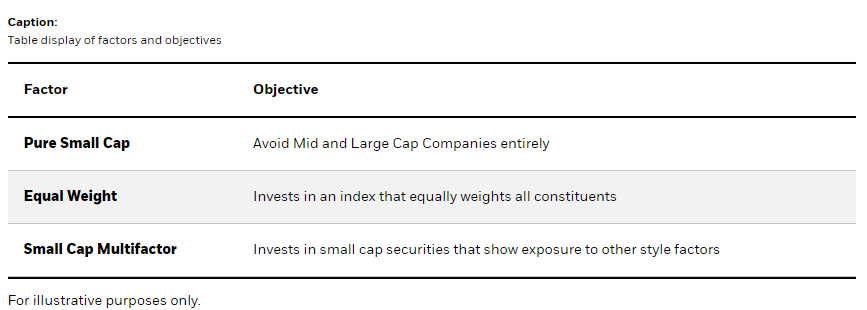
Another way to access the size premium involves equally weighting companies in a broad-based index. Many of the most well-known indexes, such as the S&P 500, weight companies based on the size of their market cap.
Larger companies like Apple, Tesla (TSLA), and Amazon have larger weights than smaller firms in the index.2 One way to create a size portfolio is to weight each company in a broad-based index equally.
An ETF that tracks an equally weighted index such as the iShares MSCI USA Equal Weighted ETF (EUSA) will have more exposure to mid-cap companies than the broad index.
This version of size investing allows the investor to gain exposure to the broad market, it invests in all parent universe securities, with different weights based on market cap. Historically, this has tended to track a bit closer to the broad market compared to a pure size or multifactor approach.
A third option to investing in the size premium is investing in small-cap securities that also have positive characteristics to other known style factors.
One way to implement this strategy is through a small-cap multifactor ETF, such as the iShares US Small Cap Equity Factor ETF (SMLF).
This approach attempts to enhance small-cap returns by emphasizing other characteristics like companies that have higher quality earnings or trade at a relative discount (value).
By starting with a small-cap benchmark, the investor can gain exposure to the size factor while also adding exposure to other historically rewarded factors all while controlling for risk relative to small-cap benchmarks.
Size characteristics
Size investing has several notable characteristics. Typically, these companies have more volatility. This is inherent in the nature of the companies.
Smaller companies may have a smaller, less loyal customer base and shifting trends in the marketplace could disrupt their business models.
Further, smaller companies tend to be more prone to distress during economic downturns.
Why does size exist and why do we expect it to persist?
Most of the academic literature for the size premium supports a risk-based explanation. Smaller firms are inherently riskier than their larger peers.
They may be more sensitive to business cycle contractions and often have less diversified business models.
They also are typically less liquid, causing investors to require a higher expected return for holding more illiquid securities.
% of Rolling Periods where the Size Factor outperformed its counterpart
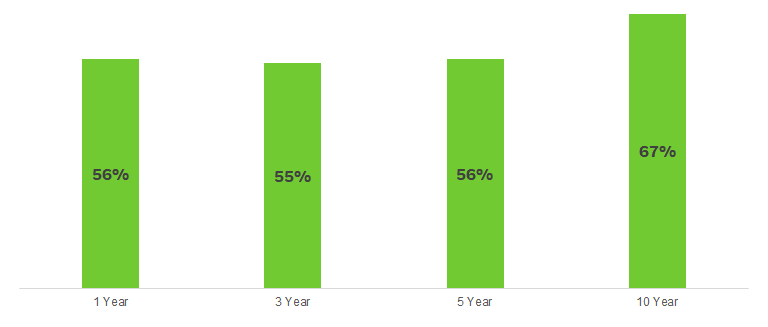
Source: Analysis by BlackRock using Ken French data library and AQR data set as of 6/30/22. Data from July 1963 through June 2022.). SMB (Small Minus Big) is the average return on the three small portfolios minus the average return on the three big portfolios.3
Conclusion
Investors that have invested in smaller-cap companies have been rewarded with higher returns over the long term.4 These higher returns were not a free lunch – they were compensation for bearing higher risk.
For investors that are willing to take additional risk in their portfolios, they may be able to capture higher expected returns by investing in the size factor.
Investors can proxy for the small size premium with an index fund that invests in small-cap securities, through an equal weighted allocation to a broad market cap index, or via a multifactor ETF that invests in small-cap securities.
There can be no assurance that performance will be enhanced or risk will be reduced for funds that seek to provide exposure to certain quantitative investment characteristics (“factors”). Exposure to such investment factors may detract from performance in some market environments, perhaps for extended periods. In such circumstances, a fund may seek to maintain exposure to the targeted investment factors and not adjust to target different factors, which could result in losses.
© 2024 BlackRock, Inc. All rights reserved.
1 Banz, Rolf W., 1981. “The relationship between return and market value of common stocks,” Journal of Financial Economics, Elsevier, vol. 9(1), pages 3-18, March.
2 Specific companies or issuers are mentioned for educational purposes only and should not be deemed as a recommendation to buy or sell any securities. Any companies mentioned do not necessarily represent current or future holdings of any BlackRock products. For actual ETF holdings, please visit a fund’s profile page on iShares.com.
3 (Ken French data library and AQR data set as of 6/30/22. Data from July 1963 through June 2022. Low size represented by SMB (small minus big). Value represented by HML (high book-to-market minus low book-to-market). Quality represented by RMW (robust minus weak). Momentum represented by UMD (up minus down). Low Vol represented by BAB (betting against beta). Counterparts for low size, value, quality, momentum, and low vol are larger firms, higher priced stocks, less profitable stocks, downward trending stocks, and higher beta securities.
4 Banz, Rolf W., 1981. “The relationship between return and market value of common stocks,” Journal of Financial Economics, Elsevier, vol. 9(1), pages 3-18, March.
Carefully consider the Funds’ investment objectives, risk factors, and charges and expenses before investing. This and other information can be found in the Funds’ prospectuses or, if available, the summary prospectuses, which may be obtained by visiting the iShares Fund and BlackRock Fund prospectus pages. Read the prospectus carefully before investing.
Investing involves risk, including possible loss of principal.
International investing involves risks, including risks related to foreign currency, limited liquidity, less government regulation and the possibility of substantial volatility due to adverse political, economic or other developments. These risks often are heightened for investments in emerging/ developing markets or in concentrations of single countries.
Fixed income risks include interest-rate and credit risk. Typically, when interest rates rise, there is a corresponding decline in the value of debt securities. Credit risk refers to the possibility that the debt issuer will not be able to make principal and interest payments.
This material represents an assessment of the market environment as of the date indicated; is subject to change; and is not intended to be a forecast of future events or a guarantee of future results. This information should not be relied upon by the reader as research or investment advice regarding the funds or any issuer or security in particular.
Buying and selling shares of ETFs may result in brokerage commissions.
The strategies discussed are strictly for illustrative and educational purposes and are not a recommendation, offer or solicitation to buy or sell any securities or to adopt any investment strategy. There is no guarantee that any strategies discussed will be effective.
The information presented does not take into consideration commissions, tax implications, or other transactions costs, which may significantly affect the economic consequences of a given strategy or investment decision.
Diversification and asset allocation may not protect against market risk or loss of principal.
There can be no assurance that performance will be enhanced or risk will be reduced for funds that seek to provide exposure to certain quantitative investment characteristics (“factors”). Exposure to such investment factors may detract from performance in some market environments, perhaps for extended periods. In such circumstances, a fund may seek to maintain exposure to the targeted investment factors and not adjust to target different factors, which could result in losses.
The iShares Minimum Volatility Funds may experience more than minimum volatility as there is no guarantee that the underlying index’s strategy of seeking to lower volatility will be successful.
Commodities’ prices may be highly volatile. Prices may be affected by various economic, financial, social and political factors, which may be unpredictable and may have a significant impact on the prices of commodities.
This material contains general information only and does not take into account an individual’s financial circumstances. This information should not be relied upon as a primary basis for an investment decision. Rather, an assessment should be made as to whether the information is appropriate in individual circumstances and consideration should be given to talking to a financial professional before making an investment decision.
The information provided is not intended to be tax advice. Investors should be urged to consult their tax professionals or financial professionals for more information regarding their specific tax situations.
The Funds are distributed by BlackRock Investments, LLC (together with its affiliates, “BlackRock”).
The iShares Funds are not sponsored, endorsed, issued, sold or promoted by Bloomberg, BlackRock Index Services, LLC, Cboe Global Indices, LLC, Cohen & Steers, European Public Real Estate Association (“EPRA® ”), FTSE International Limited (“FTSE”), ICE Data Indices, LLC, NSE Indices Ltd, JPMorgan, JPX Group, London Stock Exchange Group (“LSEG”), MSCI Inc., Markit Indices Limited, Morningstar, Inc., Nasdaq, Inc., National Association of Real Estate Investment Trusts (“NAREIT”), Nikkei, Inc., Russell, S&P Dow Jones Indices LLC or STOXX Ltd. None of these companies make any representation regarding the advisability of investing in the Funds. With the exception of BlackRock Index Services, LLC, who is an affiliate, BlackRock Investments, LLC is not affiliated with the companies listed above.
Neither FTSE, LSEG, nor NAREIT makes any warranty regarding the FTSE Nareit Equity REITS Index, FTSE Nareit All Residential Capped Index or FTSE Nareit All Mortgage Capped Index. Neither FTSE, EPRA, LSEG, nor NAREIT makes any warranty regarding the FTSE EPRA Nareit Developed ex-U.S. Index, FTSE EPRA Nareit Developed Green Target Index or FTSE EPRA Nareit Global REITs Index. “FTSE®” is a trademark of London Stock Exchange Group companies and is used by FTSE under license.
© 2024 BlackRock, Inc or its affiliates. All Rights Reserved. BLACKROCK, iSHARES, iBONDS, LIFEPATH, ALADDIN and the iShares Core Graphic are trademarks of BlackRock, Inc. or its affiliates. All other trademarks are those of their respective owners.
iCRMH0324U/S-3429720
This post originally appeared on the iShares Market Insights.
Be the first to comment