buzbuzzer
SITE Centers Corp. (NYSE:SITC) owns a quality portfolio of open-air shopping centers located in affluent suburban neighborhoods primarily in the sunbelt region of the U.S.
The company benefits from positive fundamentals that includes a lower leveraged balance sheet with an accommodative debt ladder, in addition to ample available liquidity on their revolving credit facility. They also boast of record occupancy levels and continuing robust demand for their properties, which is resulting in favorable leasing spreads.
Following their third quarter release, shares trended higher on solid results. But shares still trade at the lower boundaries of their 52-week range. For some, this may present a buying opportunity as a sustainable long-term portfolio holding.
But for those seeking market-beating returns, SITC may prove disappointing in the near-medium term due to an expected moderation in activity levels resulting from near-peak occupancy levels and slowing renewals stemming from a suspected pull forward in demand.
Leased Occupancy Rates Continue To Increase
As of September 30, 2022, SITC had an interest in just over 120 properties, 103 of which were wholly owned. Consistent with prior quarters, their top operating markets continue to be those concentrated in suburban neighborhoods within the Sunbelt region of the U.S, particularly in the states of Florida, Georgia, and North Carolina.
Period end leased portfolio occupancy came in at 95%, which is 60 basis points (“bps”) improved from the second quarter and 270bps greater than the same period last year. Broken out amongst their shops, which occupy space less than 10K square feet (“SF”) and anchors, which occupy space greater than 10K SF, total shop occupancy ended the period at a leased rate of 89.1%, a sequential improvement of 180bps and a significant YOY improvement of 520bps, while total anchor occupancy ended the period at 97.2%, up 30bps sequentially and 210bps YOY.
Record Amounts Of Leasing Activity
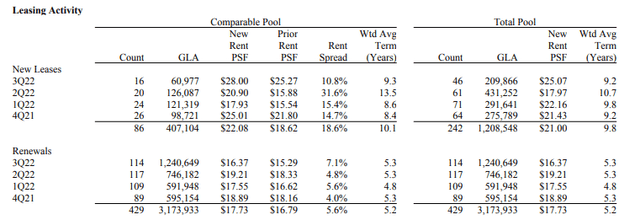
Overall demand remained robust during the quarter, marked by +$1.5M SF of leasing activity, which was noted as the largest amount leased in five years. Of this total, total new leasing amounted to 200K SF at a weighted average lease term (“WALT”) of 9.2 years, which is down from 10.7 years in the prior quarter but consistent with earlier periods. The remaining balance associated with renewals, on the other hand, were signed at a 5.3 year WALT, which is also consistent with prior periods.
Q3FY22 Investor Supplement – Summary Of Leasing Activity By Quarter
Moderating Rent Spreads But Improved Net Effective Rents
In the prior quarter, combined net effective rent (“NER”) was down several cents to $15.43 per square foot (“PSF”) from $15.78 PSF due to a steep drop in NER PSF in new leases. This was due to the greater share of new anchor leasing, which inherently commands greater capital commitments (“capex”). In the current quarter, that dynamic flipped, with shops taking the majority share in new signings. Accordingly, the NER PSF on new leases is well above prior quarters.
Q3FY22 Investor Supplement – Summary Of Net Effective Rents By Quarter
Ultimately, that increase in NER PSF resulted in a combined NER PSF of $16.15 in the current quarter, which is up $0.72 PSF from the prior period.
Blended rent spreads were 7.4%, which is a slowdown from the 8.2% last quarter, a quarter that was anomalous due to an outsized spread of over 30% on new signings. When compared to prior periods, however, spreads were in-line with Q1 and above those reported at the end of 2021.
Pipeline Of Pending Commencements Remains Significant
Looking ahead, the company has another 250K SF in negotiations that are expected to be completed by the end of the first quarter of fiscal 23. This should marginally improve current leased rates, though moderation is expected, given current occupancy levels.
Though leased rates have ticked up, commencement spreads (“SNO”) have remained in the range of 350bps. While there was 250K SF of commencements in the current quarter, the SNO pipeline remained essentially unchanged due to the number of new signings. As such, the SNO pipeline continues to represent approximately 5% of their third quarter base rents.
No Evident Signs Of Slowdown In Transaction Market
SITC also was active in the transaction market, collecting nearly +$500M in overall proceeds from dispositions, which was then recycled into financing activities and into the acquisition of convenience assets in Atlanta and Phoenix.
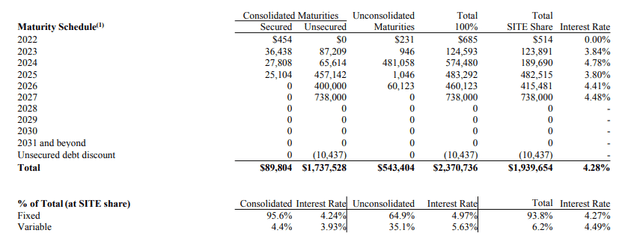
Following their financing activities, the company ended the quarter with comparable leverage metrics to prior periods and +$870M of availability on their revolving credit facility. The debt ladder also remained heavily weighted towards later years.
Q3FY22 Investor Supplement – Debt Maturity Schedule
Guidance Revisions
Moving forward, management raised their full-year guidance for operating funds from operations (“FFO”) but left their same-store net operating income (“SSNOI”) guidance unchanged. This would be following 1.1% SSNOI growth during the quarter that was set back by 160bps YOY due to +$510K of reserves related to unpaid revenue associated with Cineworld’s bankruptcy filing.
Post-Earnings Insights
SITC’s overall results in Q3FY22 were strong. Portfolio occupancy continued to tick higher to 95% and demand remained robust, with a notable increase in renewal activity in the current quarter to 1.2M SF from 0.7M SF in Q2. With rents continuing to rise, it’s possible some tenants are pulling forward their timetables to lock in favorable rates while they can.
The trajectory of rents is reflected in renewal spreads, which was up 7.1% in the current quarter, well above the increases in prior quarters. And on a trailing twelve-month basis, renewal spreads are now up 5.6% from 4.2% in the prior quarter. This is contributing favorably to blended twelve-month spreads that are up 80bps from last quarter.
Whether the growth can continue is one question worth further consideration. If demand was in fact pulled forward, then that could result in subdued activity in subsequent quarters, which could pressure rents. At 95% occupancy levels, however, the supply of space to rent out appears limited. This could serve as an anchor on current rents or a sizeable boost if demand remains elevated.
Supporting those who view moderation ahead are spreads on new leases, which came in lower in the current quarter, despite a larger share of shop signings, a tenant base that is applied a higher rent PSF than their anchor counterparts.
Also, included within their top 50 tenants are Kroger (KR) and Albertsons (ACI), two companies that have recently agreed to a deal where ACI is absorbed into KR. Given concerns surrounding antitrust, it’s possible the two companies will have to close stores in overlapping locations to satisfy regulator requirements.
While SITC’s exposure to KR is greater than ACI, whose stores are more likely to be discontinued, it is still a development that could impact rents in later periods, depending on the relevance of the transaction in their operating locations.
In addition, SITC took a hit in the current quarter due to their exposure to Cineworld, who recently declared bankruptcy. The impact was an unfavorable 160bps offset to SSNOI due to +$510K of reserves for uncollectible revenue. Aside from Cineworld, SITC is also exposed to other weaker retail outlets such as Bed Bath & Beyond (BBBY) and Gap (GPS).
Any emphasis on these weaker tenants, however, could be overblown. Over the past five years, SITC has benefitted from the creative destruction resulting from bankruptcies by being able to backfill vacant locations at higher rents with better tenants. Based on where current occupancy levels are and commentary surrounding spacing supply, additional vacancies from weaker tenants may prove to be a net benefit for the company.
Little To Be Missed By Holding For Another Quarter
SITC’s concentrated portfolio of properties in wealthier suburban communities continues to be a draw for retailers seeking to capitalize on the inbound growth to these neighborhoods over the past few years. The higher average household incomes in their markets also serves as a defensive hedge against any broader market setbacks.
Evidence of the heightened demand levels is exhibited in their robust renewal activity and record occupancy levels. Though moderation is likely, as already seen in spreads on new lease signings, earnings will be favorably impacted in later periods by their large pipeline of pending commencements, which currently represents over 5% of annualized third quarter base rents.
Investors, however, appear unimpressed by the company’s current runway. Shares still trade at the lower boundaries of their 52-week range at a forward multiple of FFO of 10.3x. This is despite a solid earnings release that surpassed expectations.
One possible reason for hesitation is the expectation of moderating activity in later periods due to near-peak occupancy levels and some indications in the current quarter of a potential pull forward in renewal demand. By waiting another quarter for further validation, investors would likely not miss out on any market-beating rebound in the share price.


Be the first to comment