


Evkaz/iStock via Getty Images
Construction projects are often large and almost always complex. In order for them to be a success, they require countless goods and a number of vital services. On the goods side, there are a large number of players ready to step up and offer a selection from their portfolios. One such firm that investors should definitely pay attention to is Simpson Manufacturing (NYSE:SSD). Over the past several years, growth at the company has been quite appealing but recent growth is likely partially temporary. The business has excess cash on hand and shares are priced reasonably. All things considered, I would consider this enterprise a prospect worthy of consideration, but I would say that shares probably are more or less fairly valued.
A niche construction play
Operationally, Simpson Manufacturing focuses on the design, engineering, and manufacturing of wood and concrete construction products that are built for the purpose of making structures safer and more secure. On the wood side of the equation, the company’s products are often used in light-frame construction. These products include connectors, truss plates, fastening systems, fasteners, and pre-fabricated lateral resistive systems. According to management, the company, for this category of products, produces and sells over 14,000 standard and custom wood items. This particular category of products makes up the bulk of what the company provides, representing 87% of the company’s revenue in all. This is up from the 84% seen just two years earlier.
The other category of products the company sells is referred to as concrete construction products. Examples of offerings included under this category would be anchor products like adhesives, mechanical anchors, carbide drill bits, and more. It also sells construction, repair, protection, and strengthening products like concrete construction repair, coatings, sealers, fiberglass, asphalt products, and other related items. By comparison, this segment, which produces and sells just over 1,000 different items in its portfolio, makes up just 13% of the company’s revenue.
All of these products are sold through a large network of suppliers the company has. These include OEM firms, large distributors, and more. The company needs a sizable network because its sales are spread across many other countries. Admittedly, the bulk of its revenue is attributable to the US, with 81.8% of overall sales made here. However, other countries also represent a large portion of revenue. Canada, for instance, made up 4.5% of sales last year. This was followed by the UK at 2.4% and then by Germany at 1.9%. Sales are also made to other nations like France, Poland, Sweden, Denmark, Norway, and other nations spread between Europe, the Asia Pacific region, and South America.
Author – SEC EDGAR Data
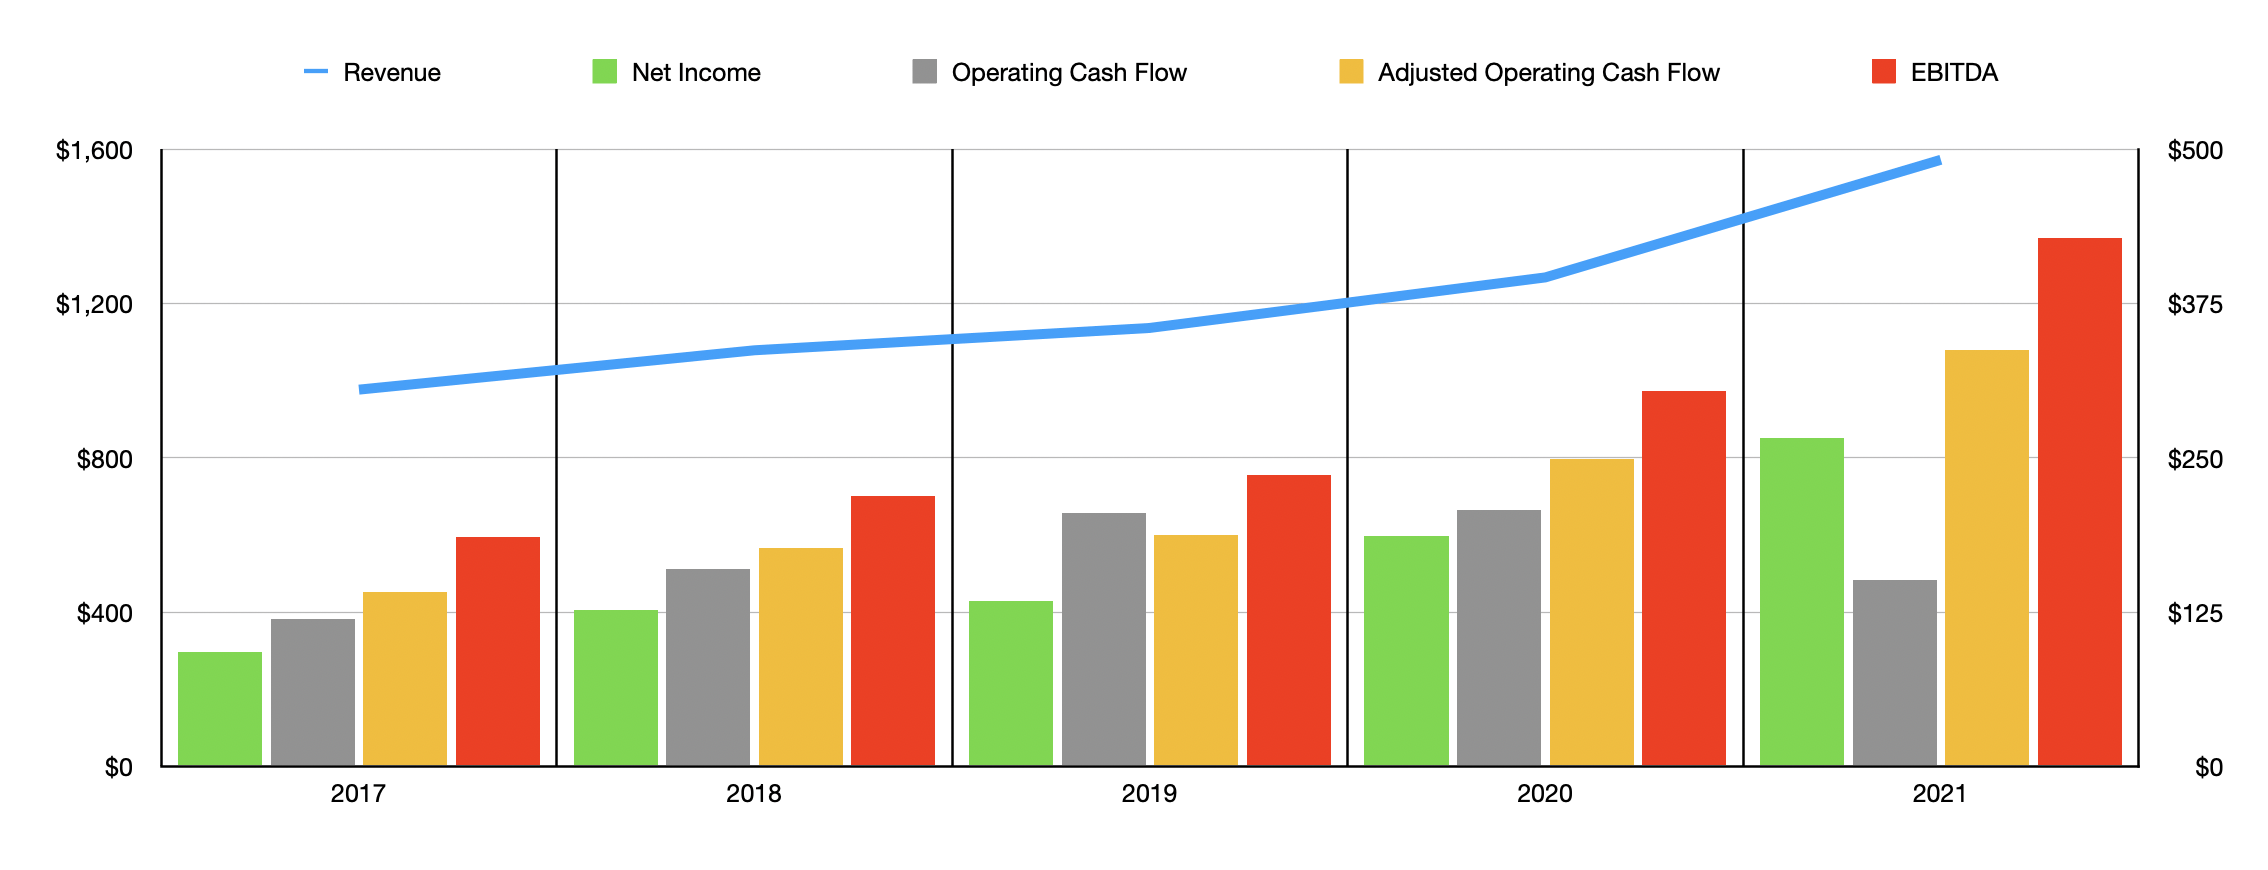
Over the past few years, management has done really well to grow the enterprise. Revenue expanded from $977 million in 2017 to $1.57 billion in 2021. The growth between 2020 and 2021 was particularly strong, coming in at 24.1%. A big portion of this sales increase during that timeframe, however, was attributable to a rise in product prices that took effect throughout 2021. However, the company also experienced higher sales volumes despite the price increases. As for what the future holds, nobody can really say. It is entirely possible that the sales increase experienced in 2021 could be short-lived if prices do come back down. Having said that, the company is certain to see at least one permanent increase in revenue. And that stems from its acquisition, announced in late December of last year, of Etanco, a provider of fixing and fastening solutions for the building construction market in Europe. That deal cost the company $818 million and will bring in sales of $291 million per year. Unfortunately, we don’t know what kind of impact this will have on the company’s bottom line because we don’t know how profitable Etanco is. But we do know that management is forecasting operating synergies from the deal of about $30 million annually within about 36 months of the closing of the acquisition.
As for profitability, the picture here has also been positive over the years. Net income increased each year between 2017 and 2021, climbing from $92.6 million to $266.4 million. Operating cash flow expanded from $119.1 million in 2017 to $207.6 million before dropping to $151.3 million last year. However, if we adjust for changes in working capital, operating cash flow would have risen to $337.8 million in 2021. Another profitability metric to consider is EBITDA. Over each of the past five years, this metric also improved, climbing from $185.7 million to $428 million.
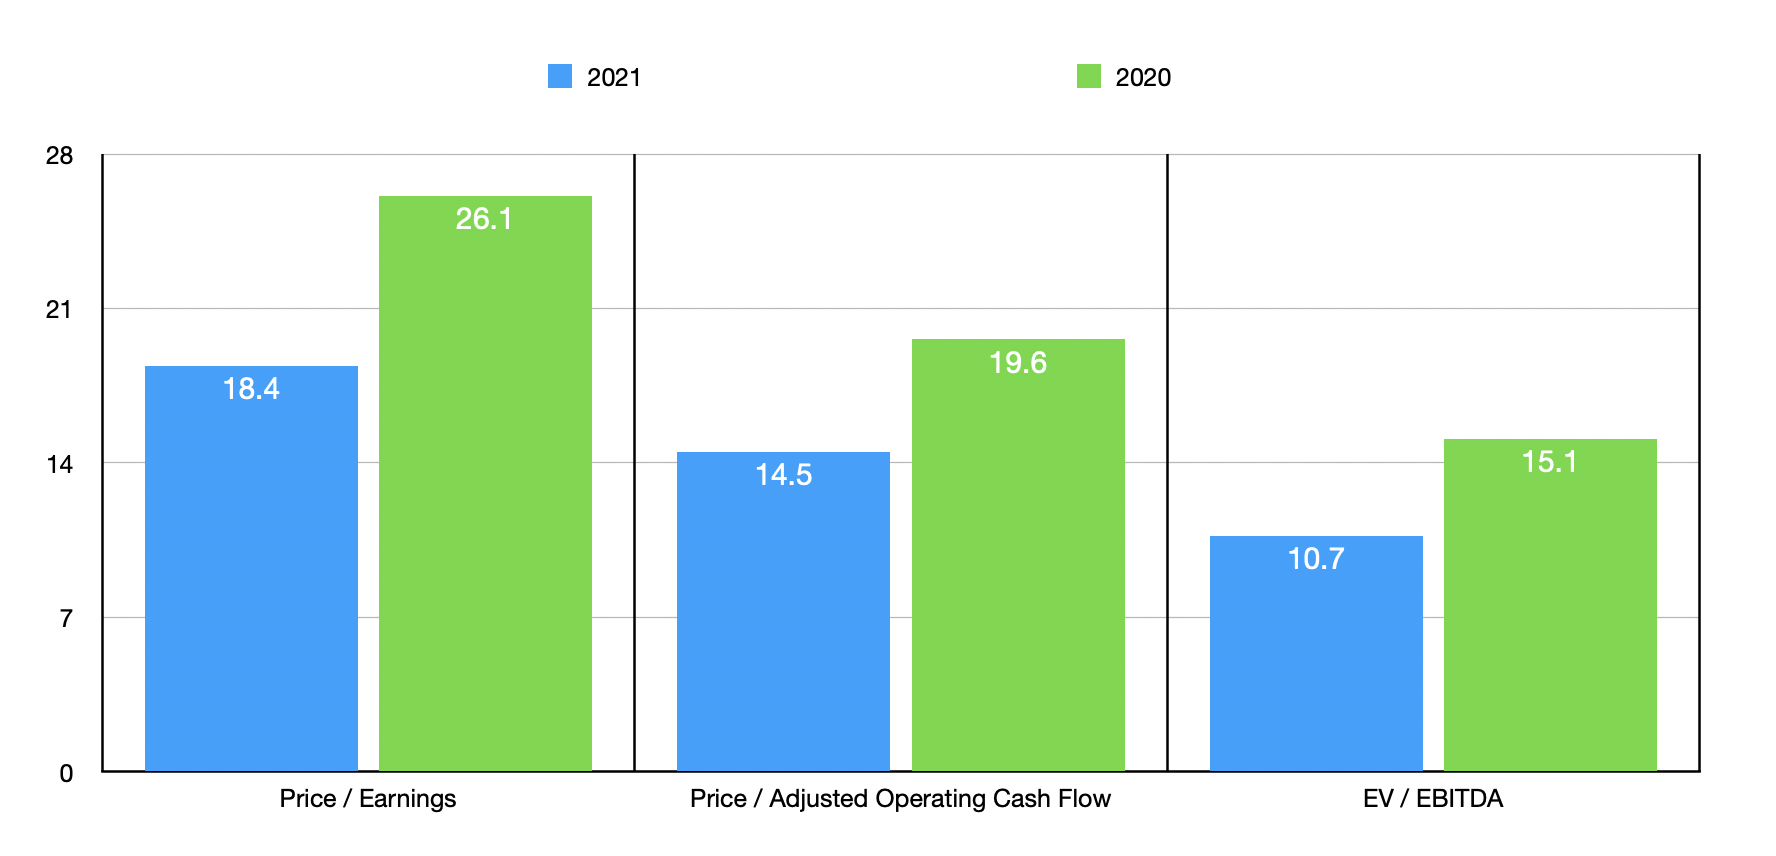
Taking all of this data, we can effectively price the business. Because we don’t know what kind of fundamental condition Etanco we have and because we don’t know the timing of any synergies realized, I am excluding that deal from the equation. I feel like excluding that is a good counterbalance to the possibility of sales prices at the enterprise weakening and pushing profitability down. Using the company’s 2021 results then, we find it trading at a price-to-earnings multiple of 18.4. The price to adjusted operating cash flow multiple would be 14.5. And the EV to EBITDA multiple would come in at 10.7. This latter metric is aided by the fact that, as of the end of 2021, the company had no debt on hand and had cash and cash equivalents of $301.16 million. In the event that financial performance were to eventually revert to levels seen in 2020, then these multiples would be 26.1, 19.6, and 15.1, respectively.
Author – SEC EDGAR Data
To put the pricing of the company into perspective, I decided to compare it to five similar firms. On a price-to-earnings basis, these companies ranged from a low of 4.7 to a high of 18.5. Four of the five firms were cheaper than our prospect. Using the price to operating cash flow approach, the range was from 6.5 to 10.7. In this case, Simpson Manufacturing what’s the most expensive of the group. And finally, using the EV to EBITDA approach, the range was from 4.1 to 10.7. In this scenario, our prospect is tied as being the most expensive player.
| Company | Price / Earnings | Price / Operating Cash Flow | EV / EBITDA |
| Simpson Manufacturing | 18.4 | 14.5 | 10.7 |
| Builders FirstSource (BLDR) | 8.0 | 7.9 | 5.1 |
| Cornerstone Building Brands (CNR) | 4.7 | 8.1 | 4.1 |
| Tecnoglass (TGLS) | 18.5 | 10.7 | 10.7 |
| Owens Corning (OC) | 9.8 | 6.5 | 5.8 |
| UFP Industries (UFPI) | 9.3 | 9.4 | 6.0 |
Takeaway
Based on the data provided, I believe that Simpson Manufacturing is an interesting company with an attractive operating history. Even before the company experienced increased pricing, it had demonstrated a consistent uptrend in revenue and profitability. If financial performance does fall back to what the business experienced in prior years, shares might be fairly valued or slightly on the lofty side. Considering where its growth as of late has come from, I would view the positive impact as transitory and designate the company as being a fairly valued prospect at present as a result.
Be the first to comment