

Andrii Sedykh/iStock via Getty Images
Simon Property Group (SPG) is not my typical investment – it is not the wide-economic moat business I am usually trying to identify and invest in. However, the stock was interesting in the spring of 2020 when COVID-19 hit the world and drove the stock price of Simon Property Group to irrational low levels (in my opinion). Additionally, the stock was (and still is) interesting for its dividend as it is generating a rather high passive income.
With these two aspects being the main reason for my interest in Simon Property Group, we must take a closer look at the stock once again. So far, the stock has not reached its previous all-time highs again (around $225 in 2016), but it is trading at pre-pandemic levels and does not seem like a bargain anymore and despite dividend increases, the dividend yield is also lower. In the following article, I will take a closer look at Simon Property Group again and start with the last quarterly results.
Quarterly Results
When looking at the last quarterly results, Simon Property Group is continuing its recovery from the terrible results in 2020. In the third quarter of fiscal 2021, SPG generated $1,297 million in revenue and compared to $1,061 million in the same quarter last year, this is an increase of 22.2% YoY. Operating income also increased from $404 million in Q3/20 to $612 million in Q3/21 – an increase of 51.5% year-over-year. And net income attributable to common stockholders increased even from $0.48 in the same quarter last year to $2.07 this quarter – an increase of 331% year-over-year.
Simon Property Group: Q3/21 Results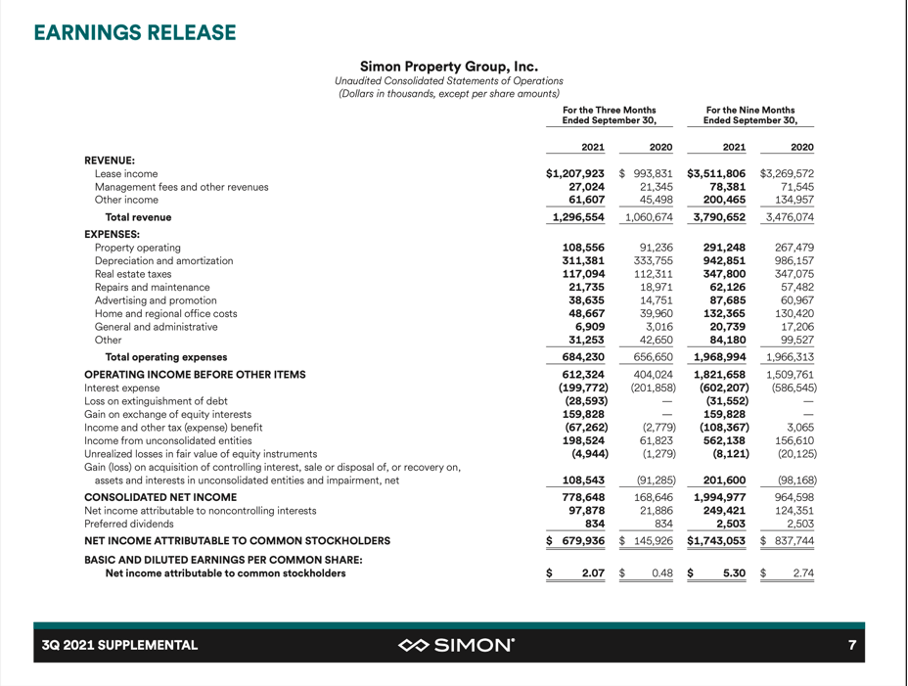
But we always must keep in mind that we are comparing the current quarter to one of the worst quarters in a long time. The months of July, August, and September 2020 were a time with people still staying at home due to COVID-19 (although the first lockdown was over). And at least on a GAAP basis, we also must mention $160 million in “gain on exchange from equity funds” as well as $199 million in “income from unconsolidated equities” that contributed to net income and earnings per share.
In case of Simon Property Group, one of the most important metrics is funds from operations – and FFO increased from $2.05 in the same quarter last year to $3.13 – an increase of 52.7% YoY. And ending occupancy rate of U.S. Malls and Premium Outlets increased from 91.4% one year earlier to 92.8%, but the base minimum rent per square foot for the total U.S. Mall and Premium Outlet portfolio declined from $56.13 one year earlier to $53.91. Ending occupancy rate for “The Mills” increased from 94.5% to 97.0% YoY, but base minimum rent per square foot also declined slightly from $33.83 one year ago to $33.68 right now.
Dividend
I mentioned above that the dividend was one of the reasons I got interested in Simon Property Group in the first place (although it does not fit my wide economic moat criteria). And after the company had to cut its dividend from $2.10 to $1.30 during 2020 (after it was unclear for some time if Simon Property Group would pay a dividend at all during the pandemic), it increased the dividend again every single quarter in the recent past – from $1.30 to $1.40 to $1.50 and now $1.65.
The current quarterly dividend is resulting in an annual payout of $6.60 and a dividend yield of 4.52%. However, I would assume that Simon Property Group will continue to increase its dividend in the coming quarters if the business is performing well. Before the pandemic (in fiscal 2019), Simon Property Group paid out $8.35 in dividends and generated FFO of $12.04 per diluted share resulting in a payout ratio of 69%. For fiscal 2021, Simon Property Group is estimating funds from operations to be around $11.60 resulting in a payout ratio of 57% with the current quarterly dividend and it seems like SPG has the potential to increase the dividend and almost reach pre-crisis levels in the foreseeable future.
Growth
One of the major concerns about mall REITs – as well as brick and mortar businesses – is the growth potential in the years to come. There seem to be constant fears that e-commerce will lead to declining sales for brick-and-mortar businesses. And while we should not ignore these challenges, Simon Property Group clearly demonstrated in the recent past that high growth rates are possible – even with competitors like Amazon (AMZN).
Simon Property Group: Earnings per share Author’s work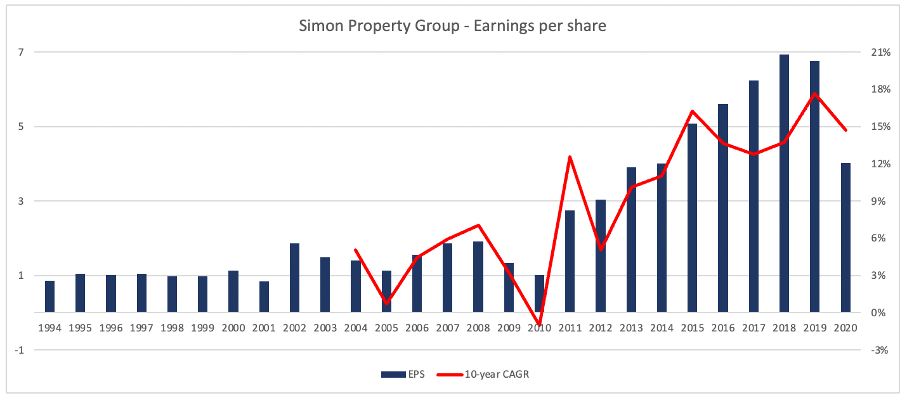
When looking at earnings per share, we can not only see that SPG accelerated growth rates in the past 10 years (looking at the 10-year EPS CAGR), but that earnings per share are also growing with a high pace. Right now – even when including the horrible year 2020 – Simon Property Group could grow earnings per share with a CAGR of 15% in the last ten years. And since 1994, Simon Property Group could grow earnings per share with a CAGR of 6.12%. When calculating with the expected earnings per share of $6.66 (midpoint of guidance) for fiscal 2021, we get a CAGR of even 7.88% for the years between 1994 and 2021.
However, past growth rates are no guarantee for a similar growth in future years and when looking at analysts’ expectations for the years to come, we don’t see so much optimism. Between fiscal 2021 and fiscal 2030, funds from operations per share are only expected to increase from $11.71 to $13.61 – resulting in a CAGR of only 1.68% for the next nine years.
Simon Property Group: FFO Estimates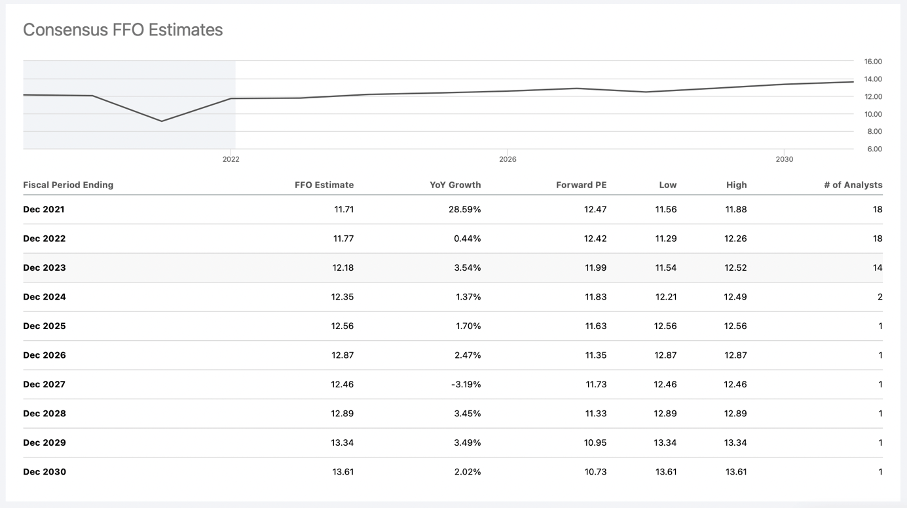
It seems like analysts remain unimpressed by past growth rates and assume that Simon Property Group will have a hard time growing in the years to come.
But as I have argued in my last article, Simon Property Group has several ways to grow – at least in theory. Aside from acquisitions or buying a stake in other businesses (like its 80% stake in Taubman and 22.4% stake in Klépierre (OTCPK:KLPEF)), it can expand by building new malls and outlets. During the third quarter, construction started on Fukaya-Hanazono Premium Outlets, which is projected to open in October 2022. And on October 15, 2021, Jeju Premium Outlets opened with 92,000 square feet in South Korea.
Risks
And of course, risks remain. The COVID-19 pandemic is still not over, but despite record numbers of daily cases all over the world (including the United States of America), we can be quite optimistic the pandemic will come to an end in the next few months. And although it might take some time before we can go back to pre-pandemic levels (and “normality” comes back), lockdowns will most likely not be an issue anymore.
An additional small problem I see is the number of outstanding shares, which increased over time – and when most other businesses are buying back shares with an aggressive pace, this is worth mentioning. And while there are reasons for increasing the number of outstanding shares that are acceptable (for example increasing shares due to an acquisition), I can’t identify any acceptable reasons in case of Simon Property Group (Taubman acquisition was paid for in cash). And over the last ten years, Simon Property Group increased the number of outstanding shares from 294 million ten years ago to 328.6 million right now. And we should not dramatize this but increasing the number of outstanding shares – without any reason – is not what shareholders would like to see.
Intrinsic Value Calculation
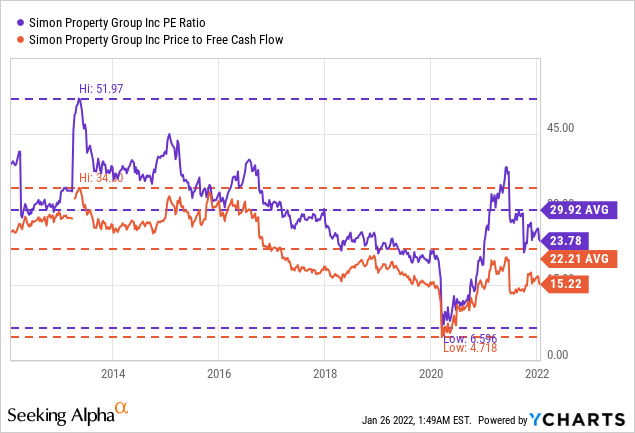
Aside from these aspects about the fundamental business, we also must compare the share price to the fundamental numbers to get a feeling if SPG could be a good investment or not. When looking at simple valuation metrics – price/earnings ratio as well as price/free-cash-flow ratio – Simon Property Group is not as cheap as it was in the last few quarters, but it does not seem expensive either. Right now, SPG is trading for a P/E ratio of 23.78 with the average P/E ratio of the last 10 years being 29.92. Simon Property Group is also trading for 15.22 times free cash flow, which is also below the average P/FCF ratio of 22.21 during the last ten years. Of course, SPG is nowhere close to the ratios we saw in March 2020 (P/E ratio of 4.7 and P/FCF ratio of 6.6), but it does not seem to be expensive either.
When trying to determine an intrinsic value for Simon Property Group by using a discount cash flow analysis (instead of looking at simple valuation metrics), we can get completely different numbers when using different assumptions. If I take the rather high free cash flow of the last four quarters ($3,140 million) as basis for our calculation and assume moderate growth of 1.7% for the next ten years as well as for perpetuity (in line with analysts’ assumptions), we get an intrinsic value of $115.13 for Simon Property Group (assuming 10% growth rate and 328.6 million outstanding shares) and the stock is therefore overvalued.
But we can question if such low growth rates are actually realistic for Simon Property Group. At least in the past, Simon Property Group was growing with a much higher pace and so far, the stock is recovering quite well from the pandemic. In my last article, I assumed 5% annual growth to be realistic for Simon Property Group and this would lead to an intrinsic value of $191.11 – making Simon Property Group still undervalued. And when looking at past growth rates, 5% growth seems realistic.
On the other hand, we can question if the free cash flow of the last four quarters is a realistic basis to calculative with, as it seems exceptionally high. Considering a revenue of $4,922 million and a net income of $2,018 million, a free cash flow of $3,140 million (TTM numbers) seems not completely unrealistic, but we could make the case, that we are dealing with an outlier. On the other hand, Simon Property Group could report similarly high numbers in the years 2017 till 2019 and we must take into account the Taubman acquisition, which will also contribute to free cash flow.
To be honest, I have troubles to come up with an intrinsic value calculation, I would assign a high probability to and call the most realistic scenario. Maybe we must rather look at an “intrinsic value range” and you must decide for yourself, which intrinsic value might be realistic.
|
1.7% |
5% |
6% |
|
|
$2,636 million (5 year average) |
$96.65 |
$160.44 |
$200.55 |
|
$3,140 million (TTM numbers) |
$115.13 |
$191.11 |
$238.89 |
While I have troubles to come up with a clear opinion about Simon Property Group right now, CEO David Simon does not seem to have similar problems. During the last earnings call, he stated:
And let me just conclude by saying the following, even though our stock has posted impressive year to date returns, we strongly believe it is still undervalued. Our current multiple of 13 times is approximately 3 turns lower than our historical average and screams very cheap compared to the REIT sector at 24 times, and in many cases, even close to 30.
It is quite interesting that the CEO of a company is commenting on the stock price and intrinsic value in the prepared statement. The statement was made on November 1, 2021 – and according to Seeking Alpha, the stock was trading for $158.99 when the transcript was published. As we saw quite some volatility during these days, it does not make much sense to ascribe a precise stock price to the statement. But it is fair to say, that the statement was made at a point when Simon Property Group was trading at least for the same price as right now.
Avoid Anchoring
The question whether to buy, sell or hold is depending a lot on the growth expectations we have for Simon Property Group in the years to come and the free cash flow it can generate in the future.
But it seems like some investors are getting a little cautious about the stock and might fall victim to some kind of anchoring bias. We know from studies done by Amos Tversky and Daniel Kahneman (for further reading see Thinking, Fast and Slow) that decisions of individuals are influenced by a particular reference point or “anchor”. And when looking at the performance of Simon Property Group we often just look at the performance in the recent past. And as the stock increased 53% in value in the last 12 months and 256% since the March 2020 lows, we might tend to argue that the stock ran too far and must be overvalued.
In this case we did not only ignore that the stock declined extremely steep before the March 2020 low (Simon Property Group declined more than 80% from its previous all-time high), but also took these extremely low stock prices as anchor to which we are comparing current stock prices. And compared to a stock price of $40, a current stock price of $150 not even two years later seems ridiculously high – completely ignoring that the lowest stock price in the last 11 years is probably not the price we should “anchor” ourselves to.
And even when considering the stock price performance over a long time – and realizing the extreme decline in 2020, we are still anchored by a stock price and totally ignore that the stock price does not necessarily represent the true intrinsic value of a business and that we should not be anchored by any stock price. We should do our analysis without looking at the stock price, as it is not an information that is important. Only at the end, we can look at the stock price and determine if we should buy the stock or not.
Conclusion
Without much doubt, Simon Property Group is one of the best picks in the mall REIT sector and although SPG – as well as almost all its peers – don’t have any economic moat around the business, the stock could be interesting as an investment nonetheless. I personally am not invested in the sector, and I don’t intend to purchase shares now. And although Simon Property Group doesn’t have a wide economic moat around its business, it is still a well-run company and might even be undervalued at this point. It is definitely not a sell for those already holding the stock.
Be the first to comment