


adrian825
Silvercrest Asset Management Group (NASDAQ:SAMG) has a simple business model. In that business model, the company needs to grow assets under management in order to grow revenues and profits. So far, the asset manager has been able to do that, thanks to the success of its investment strategies. Its ability to grow AUM seems sustainable. Given that, its attractive relative valuation and very attractively priced free cash flows, are a strong buy signal for the long-term investor.
Silvercrest Has Lagged the Stock Market
In the last five years, Silvercrest has significantly trailed the S&P 500, with its share price growing by 24.29%, compared to 53.56% for the S&P 500.
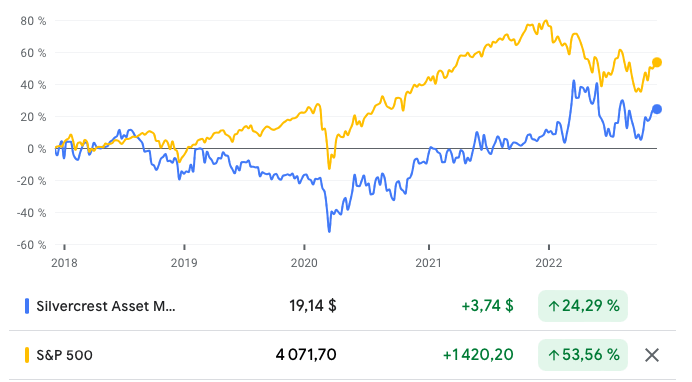
Source: Google Finance
In a year that has seen a rotation toward previously unfashionable stocks, Silvercrest has been one of the winners, with the market appreciating its history of strong financial performance. In the year-to-date, Silvercrest is up 13.52%, compared to a decline of 15.11% for the S&P 500.
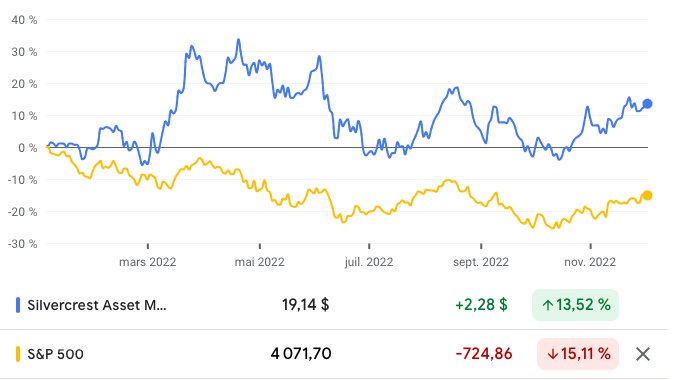
Source: Google Finance
Sustained Profitable Growth
Silvercrest has grown revenue from $91.36 million in 2017, to $131.6 million in 2021, at a five-year revenue compound annual growth rate (CAGR) of 7.57%. According to Credit Suisse’s (CS) The Base Rate Book, 24.2% of firms earned a similar rate of growth, between 1950 and 2015.
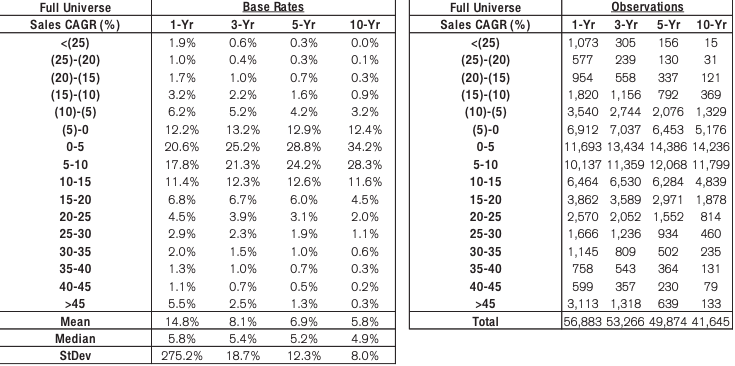
Source: Credit Suisse
Revenues are derived from three segments: management and advisory fees; performance fees and allocations, and family office services. Management and advisory fees make up over 96% of revenues, with family office services providing more than 3% of revenues; and the residual coming from performance fees and allocations. In the first nine months of the year, the firm earned revenues of $94.73 million, compared to $97.8 million in the same period in 2021.
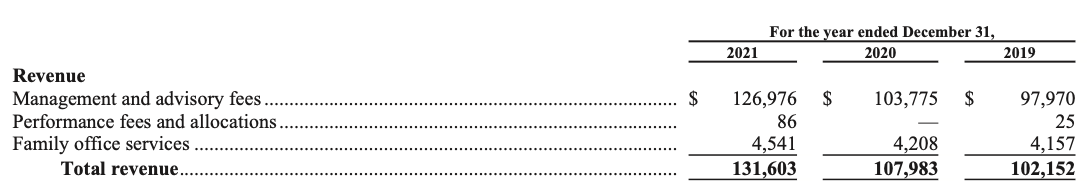
Source: Silvercrest Asset Management Group Inc. 2021 Form 10-K
Silvercrest’s gross profitability declined from 0.77 in 2017, to 0.57 in 2021. Gross profitability, given the nature of the asset management business, is bound to be higher than the 0.33 threshold that Robert Novy-Marx found was attractive, in his paper, “The Other Side of Value.”
The decline in gross profitability reflects the growth in Silvercrest’s total assets; which grew from $117.36 million in 2017 to $229.32 million in 2021, at a five-year total assets CAGR 14.34%. This is important given that there is an inverse relationship between asset growth and future returns, due to the tendency of managers to misallocate resources. The subsequent deterioration of profitability leads to poor returns. In the first nine months of the year, total assets were $$205 million, down from $$229 million for the same period in the year prior.
Operating income grew from $20.37 million in 2017, to $30.52 million in 2021, at a five-year operating income CAGR of 8.42%. In the first nine months of the year, operating income was $34.4 million, compared to $21.2 million for the same period in 2021. Operating income margin rose from 22.3% in 2017, to 23.2% in 2021. In the first nine months of the year, operating income margin jumped to 36.36%, compared to 21.69% for the same period in the year prior. The rising operating income margin reflects secular trends among the most profitable companies, who have been getting richer and richer in the last two decades.
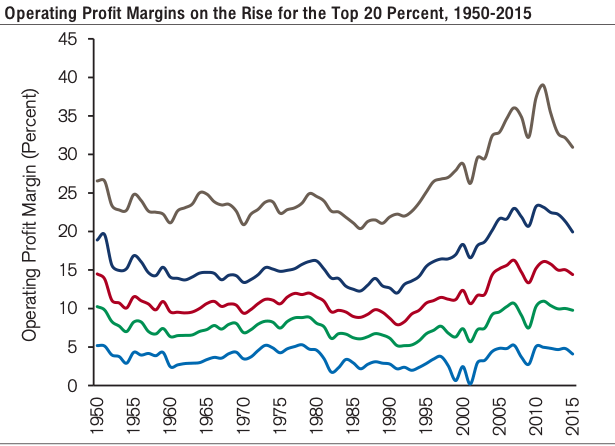
Source: Credit Suisse
Net income has risen from $5.34 million in 2017 to $14.7 million in 2021, at a five-year earnings CAGR of 22.45%. Just 8.8% of firms achieved a similar rate of growth, between 1950 and 2015. In the first nine months of the year, net income rose to $16.77 million, from $9.6 million for the same period in the year prior.
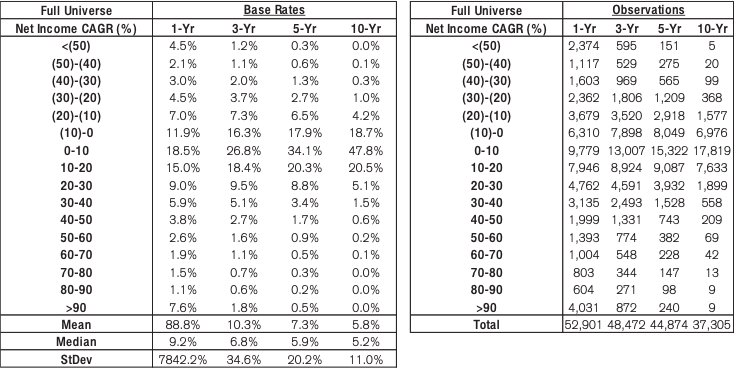
Source: Credit Suisse
Silvercrest grew free cash flows from $28.78 million in 2017, to $43.37 million in 2021, at a five-year FCF CAGR of 8.55%. In the first nine months of the year, the firm earned $7 million in FCF, compared to $21 million for the same period in the year prior.
Finally, return on invested capital declined from 57.4% in 2017, to 21.4%. Given the link between ROIC and corporate valuation, the decline in ROIC and the corresponding struggles with the share price, are significant issues to note. However, in the trailing twelve months (TTM), Silvercrest lifted ROIC to 33.9%.
Business Model
Silvercrest is a full-service wealth management firm that provides financial advisory and family office services to ultra-wealthy individuals and institutional investors. The firm also offers complementary and customized family office services for families that need comprehensive oversight over their financial affairs.
An asset management firm’s success in bridging capital under its management is reflected by the evolution of its assets under management (AUM). Since the firm was established in 2002, AUM has grown at a CAGR of 30%. In the last five years, AUM has grown at a CAGR of 8.68%, from $21.3 billion in 2017, to $32.3 billion in 2021. At the end of the first nine months of the year, the company had $27.4 billion in AUM, compared to $31 billion in the same period last year.
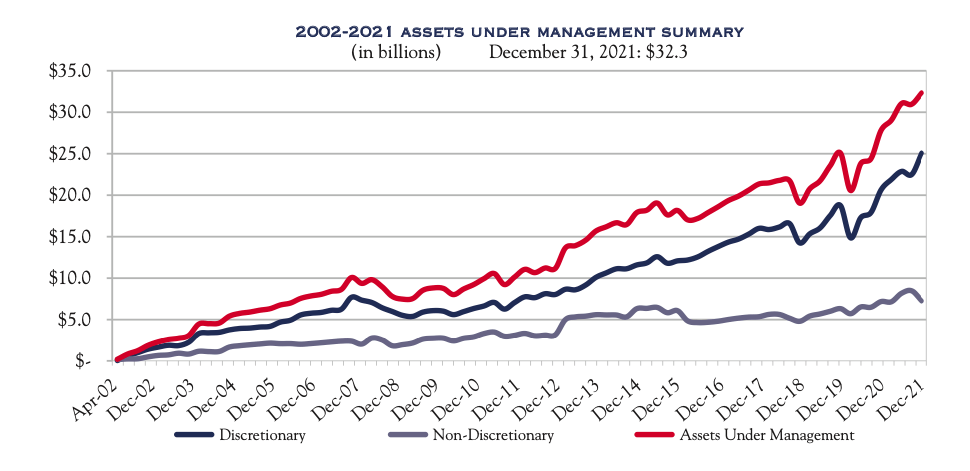
Source: Silvercrest Asset Management Group Inc. 2021 Form 10-K
As we saw earlier, revenue is largely derived from management and advisory fees levied on AUM. Thus, the higher the level of AUM, the higher the fees the company can earn. While in the near term, a firm can and often will experience a decline in AUM, an asset manager seeks to enjoy a trend of rising AUM.
Roughly 66% of that AUM is invested in proprietary equities and fixed income strategies. In the company’s proprietary equity asset portfolio, the Small Cap Value strategy is the largest, with 27% of the portfolio at the end of last year.
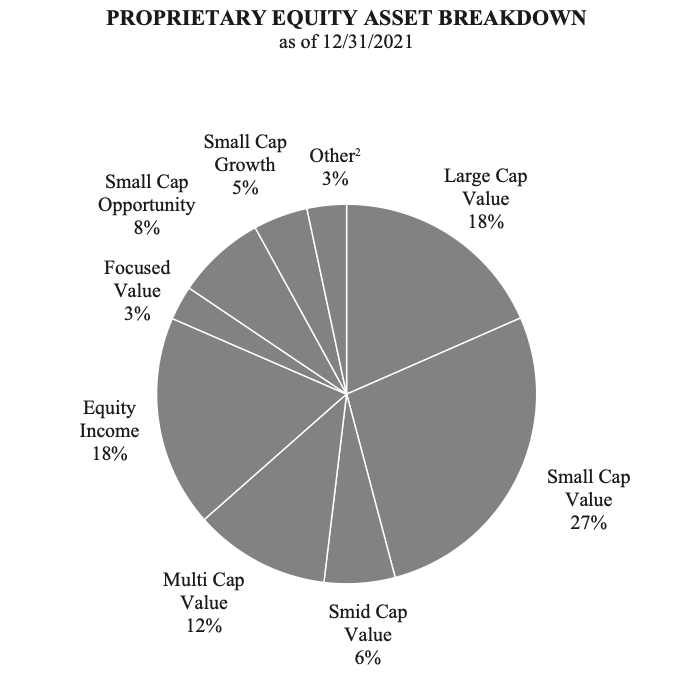
Source: Silvercrest Asset Management Group Inc. 2021 Form 10-K
All the proprietary strategies have beaten their benchmark index since inception. In the five-year period, only the Focused Value fund has failed to beat its benchmark.
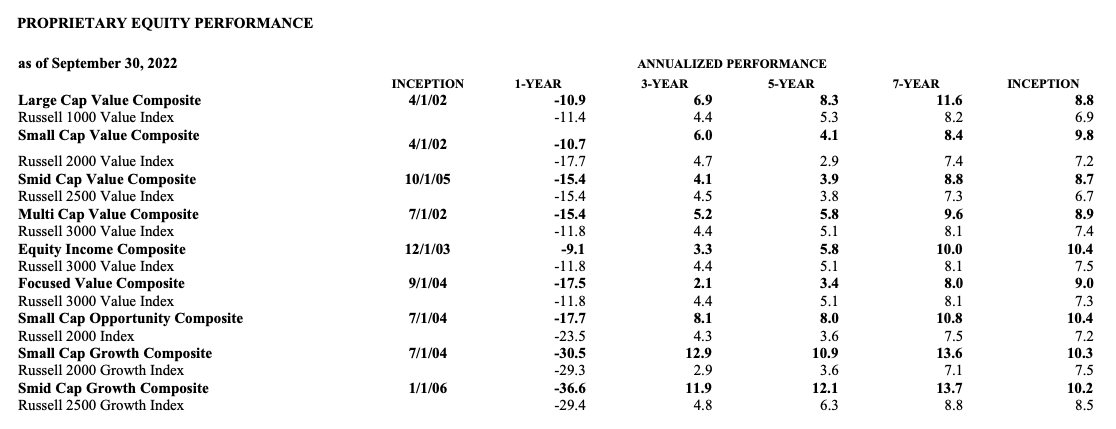
Source: Silvercrest Asset Management Group Inc. 2022 Third Quarter Form 10-Q
The firm’s proprietary fixed income portfolio is composed of investment grade and non-investment grade instruments, with investment grade instruments making up 58% of the portfolio.
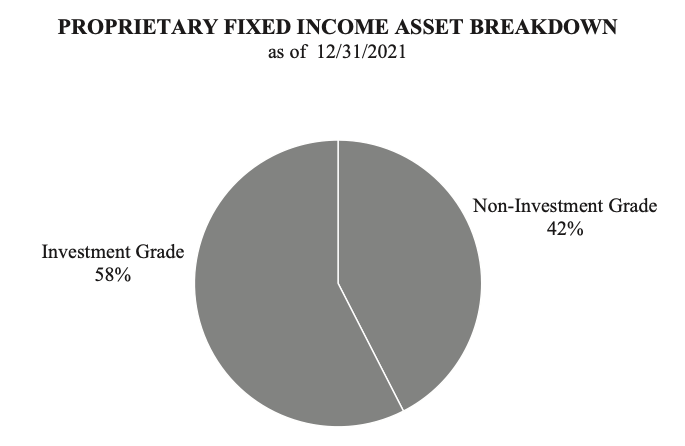
Source: Silvercrest Asset Management Group Inc. 2021 Form 10-K
The weighted average fee rate has declined from 0.46% of AUM in 2017 to 0.42% at the end of the first nine months of the year. The fees are under secular downward pressure, a pressure that extends across the industry. Given the success of passive investment vehicles, it is harder and harder to justify high fees. Fees are being driven down toward zero because anything beyond that tends to ensure that an investor’s net gains from investing match or underperform those of a passive investment vehicle. Only an active investor with returns that are reliably far in excess of those of passive investment vehicles, can charge high fees with impunity. Silvercrest is not Renaissance Technologies, and so, their fees will continue to decline.
The trend toward zero fees is made even more critical by the explosion in the supply of asset managers. They are everywhere. The barriers to entry are low, and so, even though demand for their services has risen, the net effect has been a further erosion in their pricing power. Asset managers lust therefore, grow AUM faster than fees are declining, in order to experience revenue stability or growth.
As with most asset managers, the biggest expenditure on incremental capital is for the attraction and retention of talent. The company has grown its staff from 119 in 2017, to 146 in 2021, at a five-year employee CAGR of 4.17%. In that time, compensation and benefits have risen from $54.14 million to $71.14 million in 2021, at a five-year compensation and benefits CAGR of 5.6%. In the first nine months of the year, compensation and benefits were $52.9 million, a decline from $54.88 million for the same period in the year prior.
The company has a well-diversified client base, with 69% of its discretionary AUM coming from individual clients, and 31% from institutional investors. The family office services have the advantage of aligning the business with a traditionally long-term focused investment class, and help to further diversify earnings.
Valuation
Silvercrest has a price-earnings multiple of 8.58, compared to the S&P 500, which has a PE multiple of 21.18, giving an attractive relative valuation. In addition, with $29.38 million in FCF in the TTM period, the company has an FCF yield (FCF/enterprise value) of 19.47%. This is far in excess of the 1.5% FCF yield of the 2,000 largest firms in the United States, as measured by New Constructs. This suggests that the future stock market performance of the company will be very strong, given how cheap its FCF are going for.
Conclusion
Silvercrest’s scale and business model make the business very easy to understand. Key to Silvercrest’s success is its ability to grow AUM. Given the success of its investment strategies, it should continue to be able to do so, resulting in future growth and profitability. Silvercrest remains attractively relatively valued, with very attractively priced FCF. The company could be a winner for the long-term investor.
Be the first to comment